AI Profiling is a non-intrusive performance analysis tool for GPU containers running in Kubernetes. It uses extended Berkeley Packet Filter (eBPF) and dynamic process injection to collect data from running containers without modifying application code or restarting pods. It covers five profiling dimensions: Python process execution, CPU function calls, system calls, CUDA library interactions, and CUDA kernel operations.
This topic describes how to deploy and use AI Profiling from the command line to identify performance bottlenecks in containerized GPU workloads.
Prerequisites
Before you begin, make sure you have:
-
An ACK cluster with Elastic Compute Service (ECS) or Lingjun nodes — profiling jobs only run on these node types
-
The kubectl plugin download link and the profiling image address, obtained by Submit a ticket to the Container Service team
-
(If using Python profiling) Verified USDT availability in your workload container — see Verify USDT availability
Verify USDT availability
Python profiling depends on User Statically-Defined Tracing (USDT) in the Python interpreter. Run the following command inside your workload container:
python -c "import sysconfig; print(sysconfig.get_config_var('WITH_DTRACE'))"The output must be 1 for Python profiling to work. If the output is 0 or empty, Python profiling is unavailable in that container.
Step 1: Install the kubectl plugin
AI Profiling is deployed using the kubectl-prof plugin. This example uses the Linux amd64 binary.
-
Download and install the plugin:
wget https://xxxxxxxxxxxxxxxxx.aliyuncs.com/kubectl_prof_linux_amd64 mv kubectl_prof_linux_amd64 /usr/local/bin/kubectl-prof chmod +x /usr/local/bin/kubectl-prof -
Verify the installation:
kubectl prof deploy -hExpected output:
deploy the profiling tool pod

Usage:
  kubectl-profile deploy [flags]

Aliases:
  deploy, run

Flags:
      --container string        Specify the target container name
  -d, --duration uint           Specify the profiling duration in seconds (default 60)
  -h, --help                    help for deploy
      --image string            Specify the profiling tool image
      --kubeconfig string       Specify the kubeconfig file
      --memory-limit string     Specify the memory limit (default "1Gi")
      --memory-request string   Specify the memory request (default "128Mi")
      --namespace string        Specify the target pod namespace (default "default")
      --node string             Specify the node name
      --pod string              Specify the target pod name
      --region-id string        Specify the region-id
      --ttl uint                Specify the ttl (default 60)
Step 2: Deploy a profiling pod
A profiling pod runs on the same node as the target container and collects profiling data without touching the application.
-
Get the namespace, name, and node of the application pod. This example uses a PyTorch training job:
NAME READY STATUS RESTARTS AGE IP NODE pytorch-train-worker-sample 1/1 Running 0 82s 172.23.224.197 cn-beijing.10.0.17.XXX -
Deploy the profiling pod using the information from the previous step:
kubectl prof deploy \
    --image xxxxxxxxxx \              # Profiling image address provided by Alibaba Cloud
    --duration 100000 \              # Lifetime of the profiling pod in seconds
    --namespace default \            # Namespace of the application pod
    --region-id cn-beijing \         # Alibaba Cloud region ID
    --pod pytorch-train-worker-sample \  # Application pod name
    --container pytorch \            # Container name within the application pod
    --memory-limit 10G \             # Memory limit for the profiling pod
    --memory-request 1G              # Memory request for the profiling pod
Step 3: Run a profiling job
After profiling completes, you export the result file and visualize it in TensorBoard or Chrome Tracing (Perfetto).
Start profiling
-
Get the profiling pod name:
kubectl get podExpected output:
NAME READY STATUS RESTARTS AGE ai-profiler-89bf5b305acf2ec-xxxxx 2/2 Running 0 1m -
Open a shell in the profiling pod's
debuggercontainer:kubectl exec -ti ai-profiler-89bf5b305acf2ec-xxxxx -c debugger -- bash -
List GPU processes and generate a profiling command template:
If you plan to use Python-level profiling, set the environment variable shown at the end of the output before running the profiling command.
llmtracker generateCommandExpected output:
I0314 11:42:42.389890 2948136 generate.go:51] GPU PIDs in container: I0314 11:42:42.389997 2948136 generate.go:53] PID: xxxxx, Name: {"pid":xxxxx} I0314 11:42:42.390008 2948136 generate.go:69] The profiling command is: llmtracker profile\ -p <ProcessID-To-Profiling>\ -t <Profiling-Type(python,cuda,syscall,cpu or all)>\ -o /tmp/data.json\ -v 5\ --cpu-buffer-size <CPU-Buffer-Size, recommand to 20>\ --probe-file <Enable-CUDA-Lib-Profile-File>\ -d <Duration-To-Profiling>\ --delay <Delay-Time>\ --enable-cuda-kernel <Enable-CUDA-Kenrel-Profile(true or none)> I0314 14:37:12.436071 3083714 generate.go:86] Profiling Python Path is: /usr/bin/python3.10. If you want to profiling Python, please ser the environment variable: export EBPF_USDT_PYTHON_PATH=/usr/bin/python3.10 -
Modify the generated command for your scenario and run it. The following parameters control profiling scope and duration: Difference between `-t cuda` and `--enable-cuda-kernel`: For all available parameters, run
llmtracker profile -h.-
-t cudauses eBPF to record CUDA library symbol calls — the call time and parameters of each API function — to analyze the actual call behavior of the process. -
--enable-cuda-kerneluses process injection to collect execution details of individual CUDA kernel functions, enabling inspection of task flow states on the GPU.
Parameter Default Description -p— PID to profile. Can be specified multiple times to profile multiple processes. -t— Profiling type: python,cuda,syscall,cpu, orall.-o/tmp/data.jsonOutput file path. -v— Log verbosity level. --cpu-buffer-size20CPU buffer size for eBPF data collection. --probe-file— JSON configuration file for CUDA library profiling. See CUDA library configuration file for the format or use the default template. -d— Profiling duration in seconds. We recommend keeping this value below 60s, as prolonged profiling durations may generate excessive data, which can lead to increased memory consumption and storage load. --delay— Delay before profiling starts, in seconds. Set this to at least 2 if CUDA kernel profiling is enabled. --enable-cuda-kernel— Set to trueto enable CUDA kernel profiling. -
-
Run the profiling command. The following example enables all profiling types (including CUDA kernel profiling), uses
probe.jsonfor CUDA library configuration, writes output to/tmp/data.json, delays 3 seconds before starting, and profiles for 5 seconds:export EBPF_USDT_PYTHON_PATH=/usr/bin/python3.10 llmtracker profile -p xxxxx -t all -o /tmp/data.json -v 5 --enable-cuda-kernel true --cpu-buffer-size 20 --probe-file probe.json --delay 3 -d 5
Export results
Convert the result file to a standard format for timeline visualization:
llmtracker export -i /tmp/data.json -o /output/out.json --cupti-dir /tmpInclude --cupti-dir /tmp if the result file contains CUDA kernel profiling data.
Step 4: Visualize profiling results
TensorBoard
If your cluster uses Object Storage Service (OSS) or Apsara File Storage NAS for storage, start a TensorBoard pod in the cluster that mounts a PVC containing the profiling result data, then open TensorBoard to view the timeline. See View TensorBoard for details.
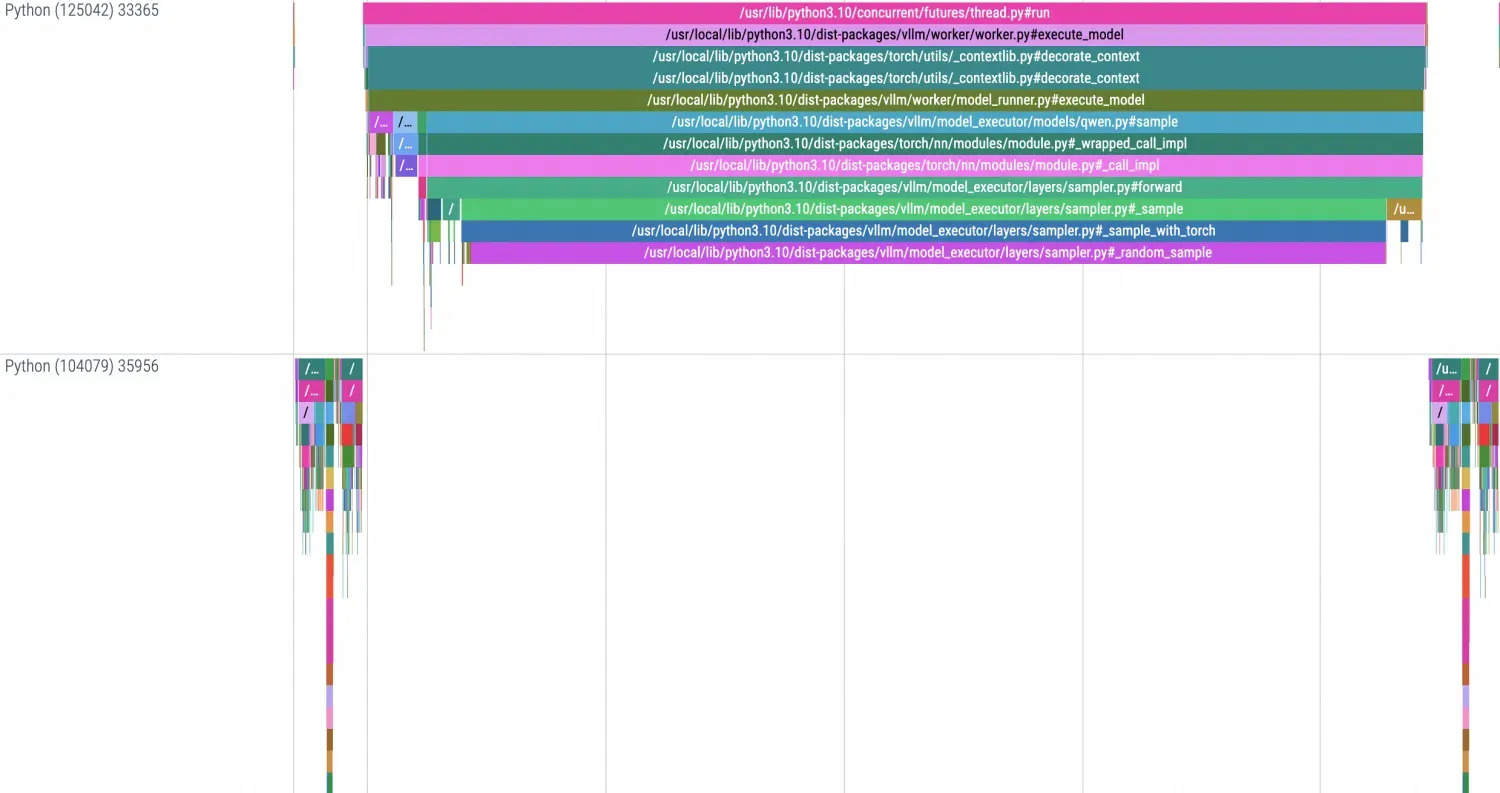
The timeline in TensorBoard looks like this:
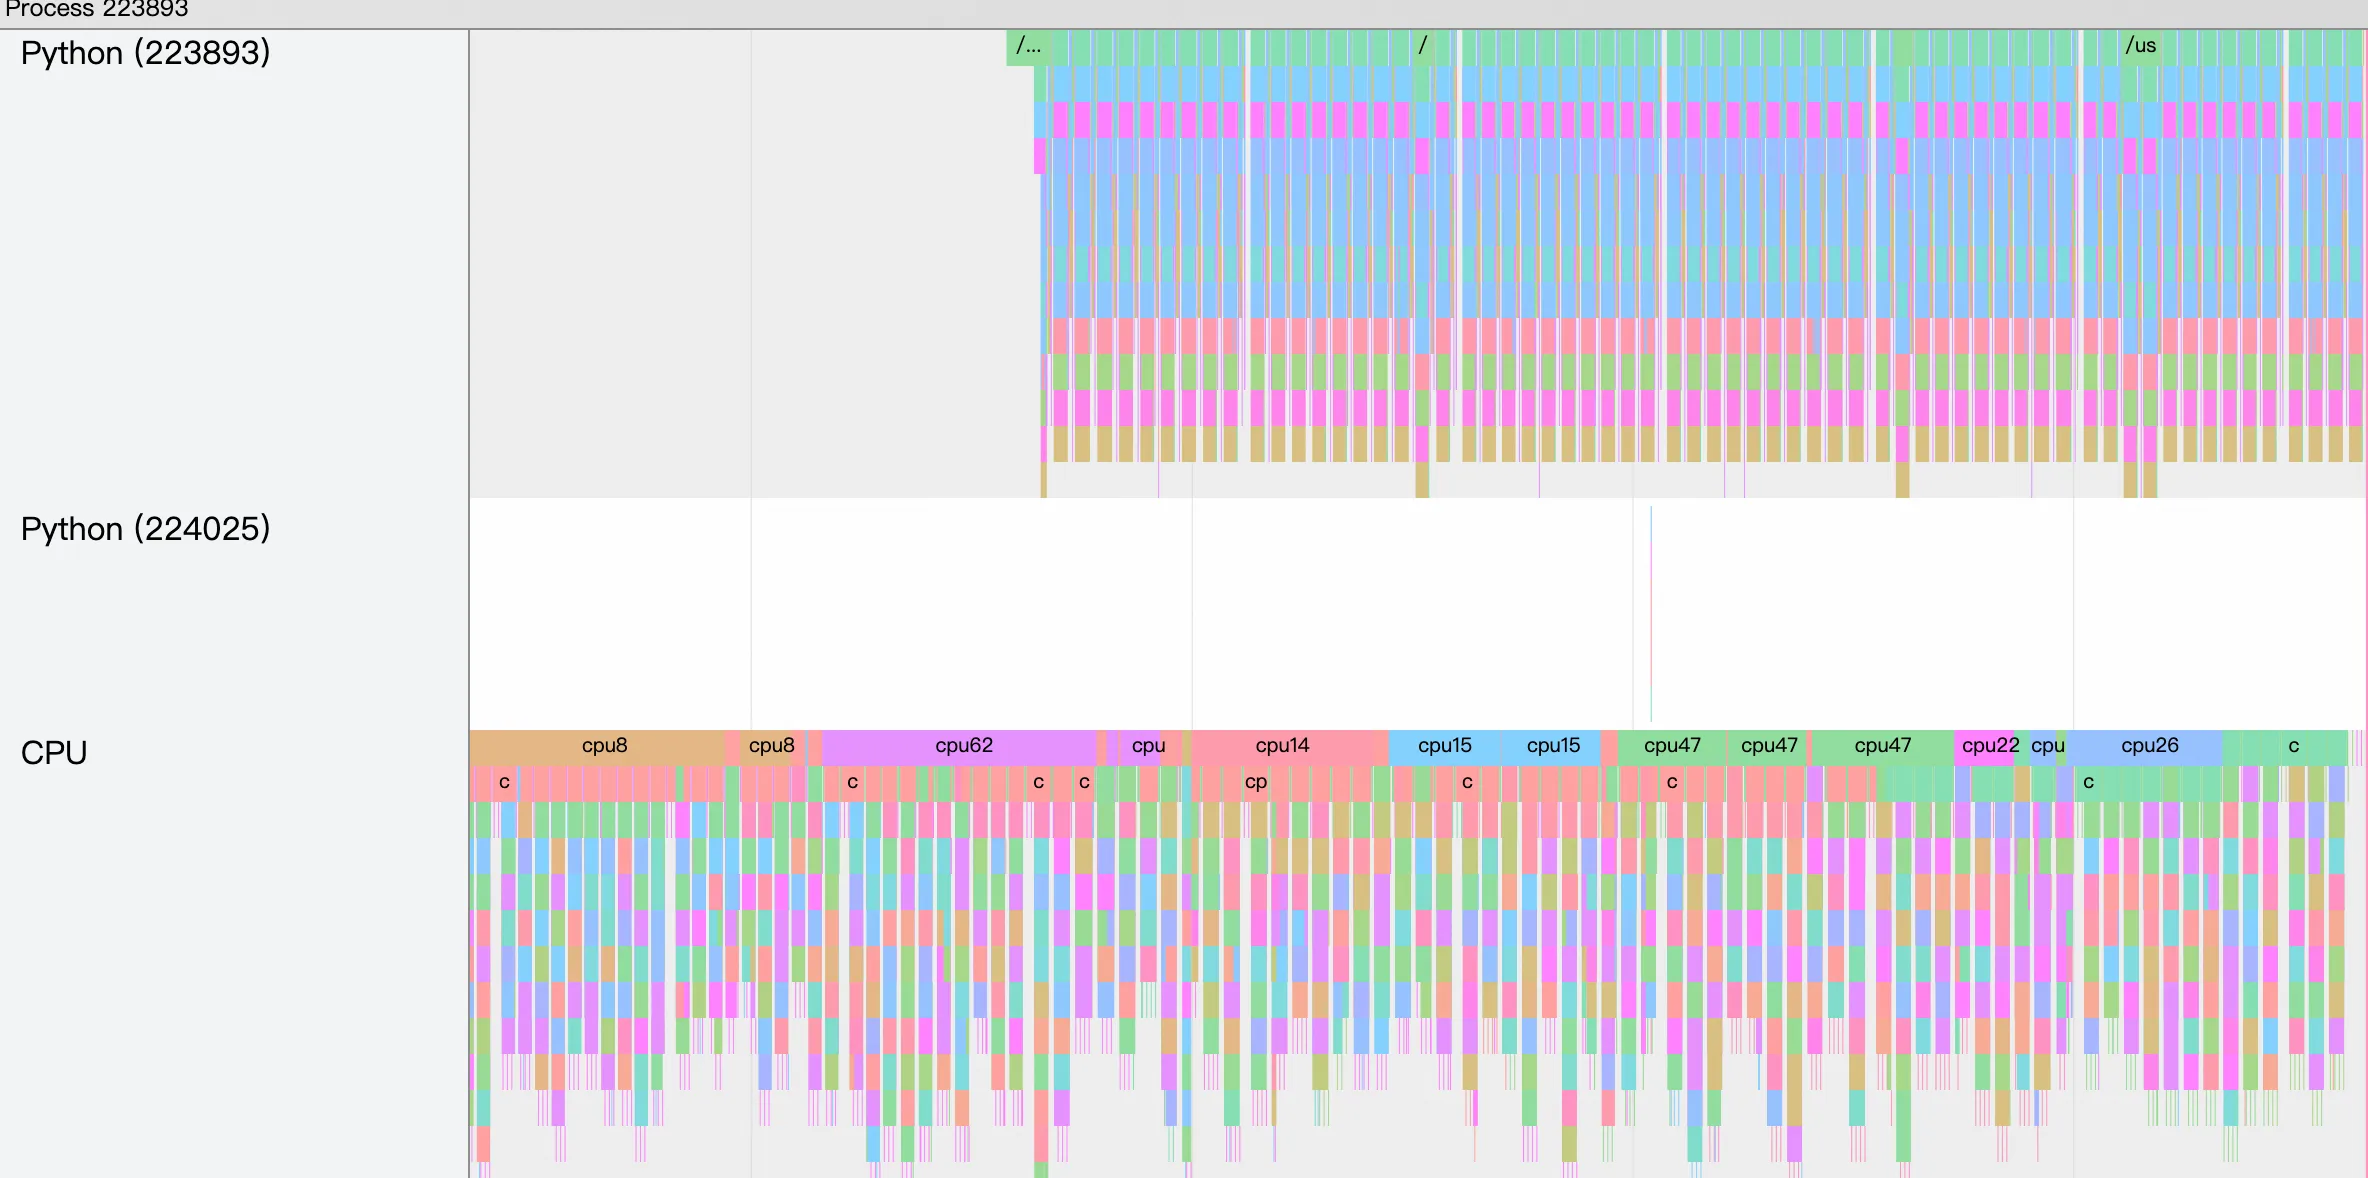
Chrome Tracing (Perfetto)
For local storage, copy the result file to your local machine and open it at https://ui.perfetto.dev/.
The timeline in Chrome Tracing looks like this:
CUDA library configuration file
The --probe-file parameter accepts a JSON configuration file that defines which library symbols to trace. Use the default template below or build a custom one.
Build a custom configuration
-
Use
lddto get the link dependencies of your target library and identify which library files to trace.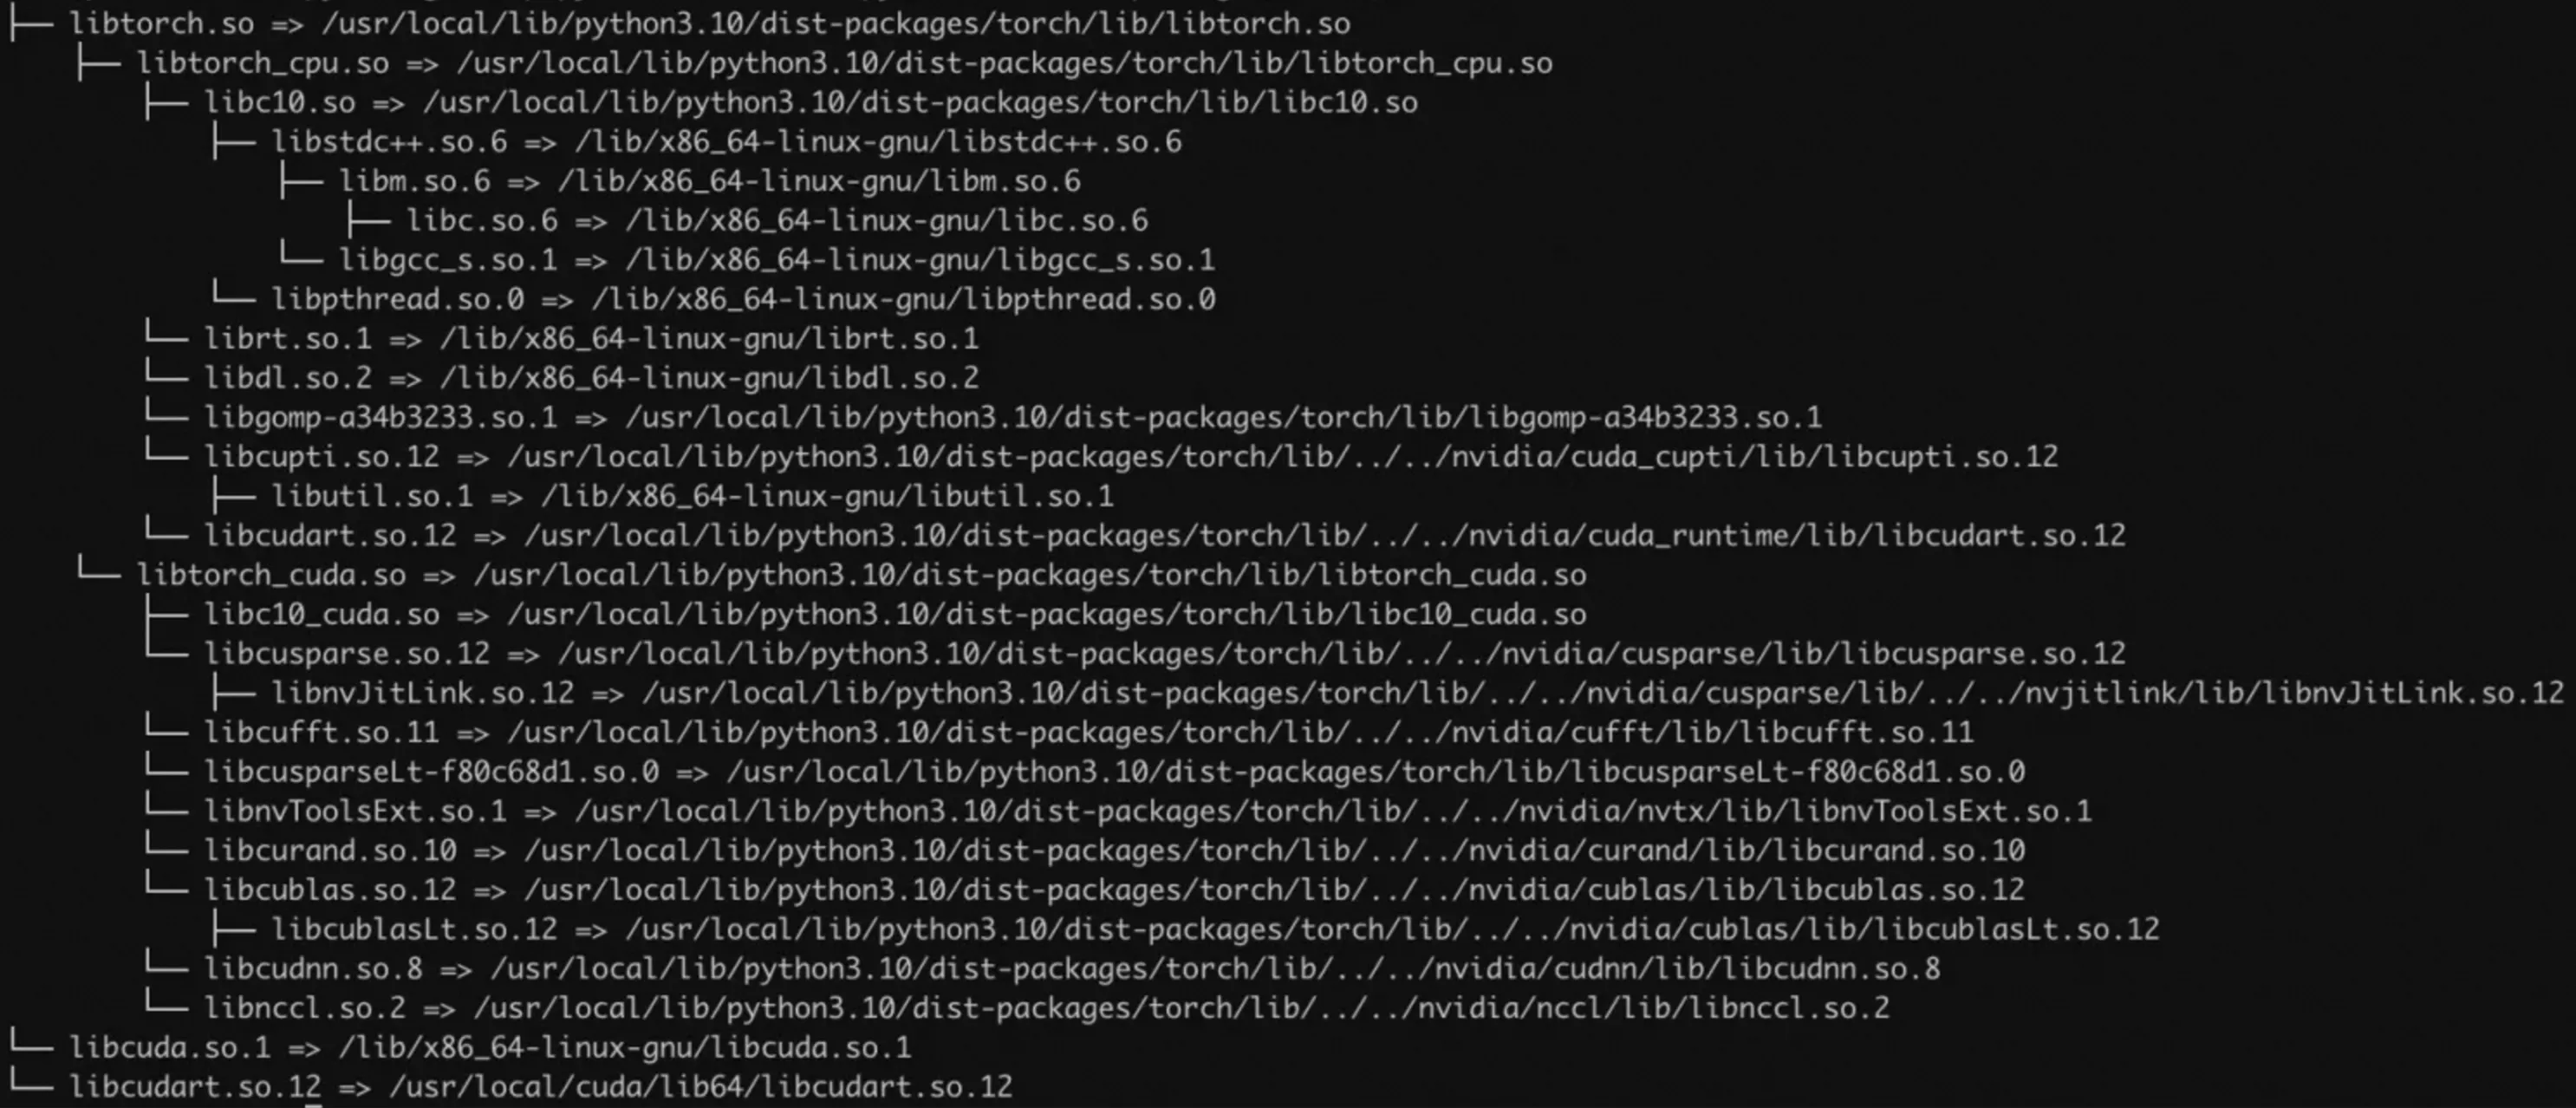
-
Extract symbol names from the target library. The following example uses
libnccl.so:readelf -Ws libnccl.so.2 | grep pncclExpected output:
... 223: 00000000000557d0 650 FUNC GLOBAL DEFAULT 11 pncclGroupStart 224: 0000000000050200 243 FUNC GLOBAL DEFAULT 11 pncclRedOpDestroy 225: 0000000000062081 656 FUNC GLOBAL DEFAULT 11 pncclCommAbort 227: 000000000006320c 721 FUNC GLOBAL DEFAULT 11 pncclCommUserRank 228: 0000000000064ee0 20 FUNC GLOBAL DEFAULT 11 pncclGetVersion 231: 0000000000045f60 1778 FUNC GLOBAL DEFAULT 11 pncclAllGather 232: 00000000000604f8 1578 FUNC GLOBAL DEFAULT 11 pncclCommInitAll 233: 000000000004ff20 728 FUNC GLOBAL DEFAULT 11 pncclRedOpCreatePreMulSum 238: 0000000000074520 653 FUNC GLOBAL DEFAULT 11 pncclCommDeregister 240: 00000000000474b0 30 FUNC GLOBAL DEFAULT 11 pncclBcast 243: 000000000006173d 789 FUNC GLOBAL DEFAULT 11 pncclCommFinalize 244: 00000000000483d0 2019 FUNC GLOBAL DEFAULT 11 pncclSend ... -
Build the JSON configuration file. The file defines the information needed for Probe, including: the relative path of the target library file in the container for uprobes, the symbol of the method to monitor in the library for uprobes, and the symbol of the system method to monitor for kprobes.