On multi-NUMA instances, collocated workloads can exhaust local memory and push an application's memory pages to remote NUMA nodes. Cross-node access over the QuickPath Interconnect (QPI) bus is slower than local access, degrading throughput and increasing latency. The nearby memory access acceleration feature of ack-koordinator detects remote memory pages at runtime and migrates them back to the local NUMA node without interrupting running services.
Prerequisites
Before you begin, ensure that you have:
An ACK Pro cluster running Kubernetes 1.18 or later. For more information, see Create an ACK managed cluster.
A kubectl client connected to the cluster. For more information, see Obtain the kubeconfig file of a cluster and use kubectl to connect to the cluster.
ack-koordinator (FKA ack-slo-manager) 1.2.0-ack1.2 or later installed. For more information, see ack-koordinator (FKA ack-slo-manager).
Noteack-koordinator includes all features from resource-controller. If you currently use resource-controller, uninstall it before installing ack-koordinator. For more information, see Uninstall resource-controller.
5th-, 6th-, 7th-, or 8th-generation Elastic Compute Service (ECS) instances from the ecs.ebmc, ecs.ebmg, ecs.ebmgn, ecs.ebmr, ecs.ebmhfc, or ecs.scc instance families, deployed as multi-NUMA instances.
NoteThe feature performs best on 8th-generation ECS instances of the ecs.ebmc8i.48xlarge, ecs.c8i.32xlarge, and ecs.g8i.48xlarge types. For more information, see ECS instance families.
Applications deployed on multi-NUMA instances with CPU cores bound using topology-aware CPU scheduling. For more information, see Enable topology-aware CPU scheduling.
Billing
No fee is charged to install or use ack-koordinator. However, the following scenarios may incur charges:
ack-koordinator is a non-managed component that consumes worker node resources after installation. You can specify how many resources each module requests during installation.
By default, ack-koordinator exposes monitoring metrics (such as resource profiling and fine-grained scheduling metrics) as Prometheus metrics. If you enable Prometheus metrics for ack-koordinator and use Managed Service for Prometheus, these metrics are counted as custom metrics and fees apply. Before enabling, read the Billing topic for Managed Service for Prometheus to understand the free quota and billing rules. For more information, see Query the amount of observable data and bills.
How it works
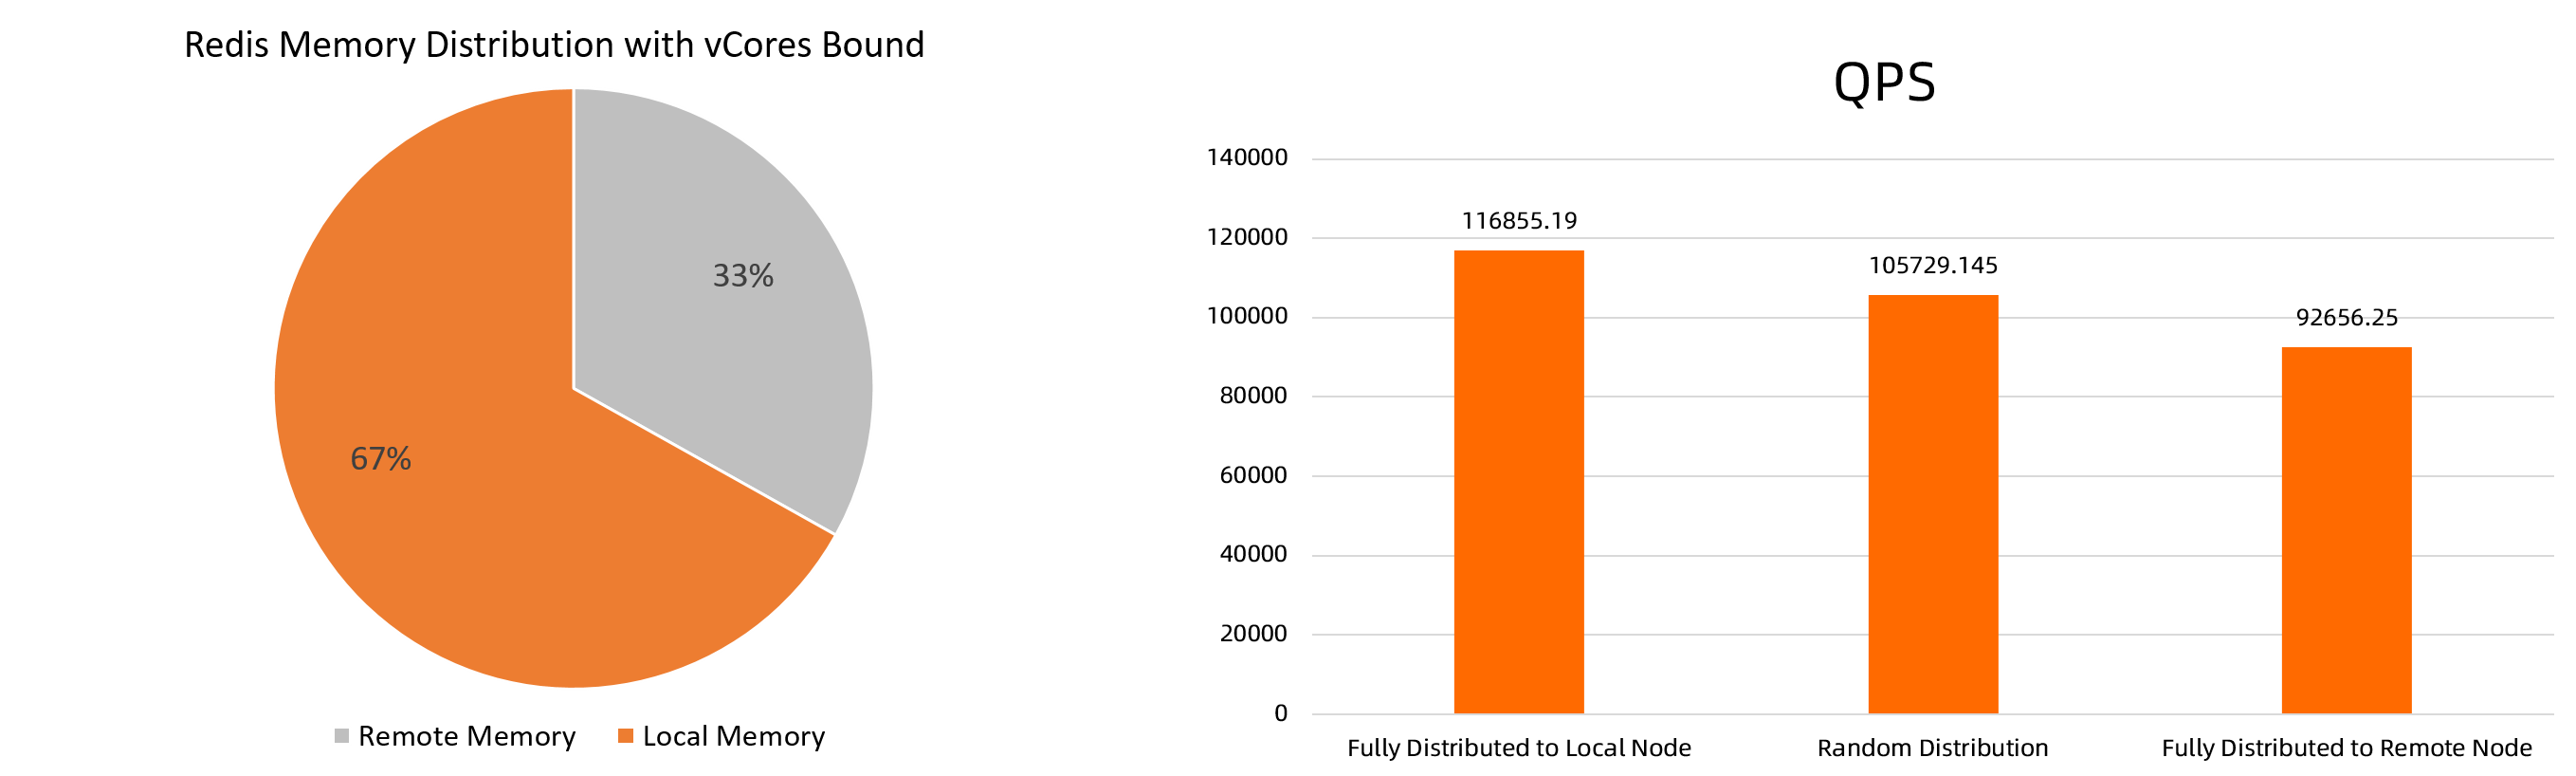
In the multi-NUMA architecture, processes running on a vCore of one NUMA node may need to access memory on a remote NUMA node. Such cross-node access travels over the QPI bus and takes longer than local memory access. Under high memory loads—for example, when collocated workloads on the same NUMA node exhaust local memory—an application's memory pages can be pushed to a remote NUMA node, reducing the local memory hit ratio and degrading performance.
ack-koordinator addresses this runtime memory drift. When memory locality is enabled for a pod, the koordlet agent on each node detects which of the pod's memory pages reside on remote NUMA nodes and migrates them to the local node. Migration is safe and does not require restarting the pod or interrupting traffic.
Benchmarks on an ecs.ebmc8i.48xlarge instance running Redis show that fully local memory delivers 10.52% higher QPS than randomly distributed memory and 26.12% higher QPS than fully remote memory.
The benchmark figures are theoretical. Actual results vary by environment.
Use cases
The nearby memory access acceleration feature is suited for:
Memory-intensive workloads — large-scale Redis in-memory databases and similar workloads where memory access latency directly affects throughput.
DSA-enabled ECS instances — ECS instances integrated with Intel Data Streaming Accelerator (DSA) can improve feature performance and reduce CPU consumption.
Limitations
The feature is skipped when the instance uses a non-NUMA architecture or when the process runs across all NUMA nodes. In both cases, there is no remote NUMA node to migrate from.
If a process is terminated during migration, the migration for that process fails. ack-koordinator records the failed process ID in the pod event and continues migrating other processes.
When using periodic acceleration (
migrateIntervalMinutes > 0), an event is recorded only when the change in the local memory ratio or the acceleration result exceeds 10%.
Enable nearby memory access acceleration
Step 1: Enable the feature
Two methods are available. Use the annotation method to target individual pods, or use the ConfigMap method to apply the setting to all pods of a given quality of service (QoS) class.
Enable for an individual pod
Run the following command to enable nearby memory access acceleration for a pod:
kubectl annotate pod <pod-name> koordinator.sh/memoryLocality='{"policy": "bestEffort"}' --overwriteThe policy parameter accepts the following values:
| Value | Behavior |
|---|---|
bestEffort | Triggers an immediate migration of memory pages from remote NUMA nodes to the local NUMA node |
none | Disables nearby memory access acceleration |
Enable for all pods of a QoS class
Create a file named
ml-config.yamlwith the following content:apiVersion: v1 data: resource-qos-config: |- { "clusterStrategy": { "lsClass": { "memoryLocality": { "policy": "bestEffort" } } } } kind: ConfigMap metadata: name: ack-slo-config namespace: kube-systemCheck whether the
ack-slo-configConfigMap already exists in the kube-system namespace:kubectl get cm ack-slo-config -n kube-systemIf the ConfigMap does not exist, create it:
kubectl apply -f ml-config.yamlIf the ConfigMap already exists, patch it to avoid overwriting existing QoS settings:
kubectl patch cm -n kube-system ack-slo-config --patch "$(cat ml-config.yaml)"
Step 2: Verify the feature
Run the following command to check pod events:
kubectl describe pod <pod-name>The following table describes the expected event types and their meanings:
| Event type | Example message | Meaning |
|---|---|---|
MemoryLocalityCompleted | Container <name> completed: migrated memory from remote numa: 1 to local numa: 0 ... Total: 2 container(s) completed, 0 failed, 0 skipped; cur local memory ratio 100, rest remote memory pages 0 | Migration succeeded. The event records the migration direction for each container and the resulting local memory ratio. |
MemoryLocalityCompleted (with failures) | failed to migrate the following processes: failed pid: 111111, error: No such process, from remote numa: 0 to local numa: 1 | One or more processes were terminated during migration. The event records the PID of each failed process. Remaining containers migrated successfully. |
MemoryLocalitySkipped | no target numa | No remote NUMA node was found. This occurs on non-NUMA instances or when the process runs across all NUMA nodes. No action is needed. |
MemoryLocalityFailed | Error message varies | An unexpected error occurred. Check the error message for details. |
Step 3 (Optional): Set up periodic acceleration
By default, the annotation triggers a single migration. To run migrations repeatedly on a schedule, add the migrateIntervalMinutes parameter.
Before setting a recurring interval, make sure the most recent migration has completed. An event is recorded only when the local memory ratio or the acceleration result changes by more than 10%.
kubectl annotate pod <pod-name> koordinator.sh/memoryLocality='{"policy": "bestEffort","migrateIntervalMinutes":10}' --overwriteThe migrateIntervalMinutes parameter specifies the minimum interval between migrations, in minutes:
| Value | Behavior |
|---|---|
0 | Triggers a single immediate migration (same as omitting the parameter) |
> 0 | Triggers an immediate migration, then repeats at the specified interval |
none | Disables the nearby memory access acceleration feature |
Benchmark: performance impact on Redis
This section describes benchmark results for the ecs.ebmc8i.48xlarge and ecs.ebmg7a.64xlarge instance types.
Results depend on the stress testing tool and environment. The following results are specific to these two instance types.
Test environment
Tested machines: ecs.ebmc8i.48xlarge and ecs.ebmg7a.64xlarge instances running a Redis application
Redis application: multi-thread, 4 vCores, 32 GB memory (image:
redis:6.0.5)Stress test machine: a separate machine that sends requests to the tested machine
NoteFor lower-spec test machines, deploy a single-thread Redis instance and reduce the CPU and memory requests accordingly.
Test procedure

Deploy a Redis application using the following YAML. Adjust
redis-configto match the specifications of your test machine.--- kind: ConfigMap apiVersion: v1 metadata: name: example-redis-config data: redis-config: | maxmemory 32G maxmemory-policy allkeys-lru io-threads-do-reads yes io-threads 4 --- kind: Service apiVersion: v1 metadata: name: redis spec: type: NodePort ports: - port: 6379 targetPort: 6379 nodePort: 32379 selector: app: redis --- apiVersion: v1 kind: Pod metadata: name: redis annotations: cpuset-scheduler: "true" # Bind vCores using topology-aware CPU scheduling labels: app: redis spec: containers: - name: redis image: redis:6.0.5 command: ["bash", "-c", "redis-server /redis-master/redis.conf"] ports: - containerPort: 6379 resources: limits: cpu: "4" # Adjust based on test machine specifications volumeMounts: - mountPath: /redis-master-data name: data - mountPath: /redis-master name: config volumes: - name: data emptyDir: {} - name: config configMap: name: example-redis-config items: - key: redis-config path: redis.confIncrease memory loads to simulate remote NUMA memory drift.
Write business data into Redis using the following shell script. The script writes data in batches via pipelines. Replace
<max-out-cir>and<max-in-cir>with the appropriate values for your setup. For a 4 vCore, 32 GB Redis instance, usemax-out-cir=300andmax-in-cir=1000000.NoteWriting large volumes of data takes time. Run the script on the tested machine to maximize write speed.
for((j=1;j<=<max-out-cir>;j++))
do
        echo "set k$j-0 v$j-0" > data.txt
        for((i=1;i<=<max-in-cir>;i++))
        do
                echo "set k$j-$i v$j-$i" >> data.txt
        done
        echo "$j"
        unix2dos data.txt  # Pipeline writes require DOS format
        cat data.txt | redis-cli --pipe -h <redis-server-IP> -p <redis-server-port>
done
While data is being written, increase the memory loads from collocated workloads on the same NUMA node to simulate memory drift. Use
numactl --membindto bind the workloads to a specific NUMA node.Run the following command to increase memory pressure. Replace
<workers-num>with the number of stress processes and<malloc-size-per-workers>with the memory allocated per process.NoteBecause vCores are bound to the Redis pod, local NUMA memory is preferentially allocated to it until local memory is exhausted and overflow spills to remote NUMA nodes. Run
numactl -Hto check memory utilization per NUMA node and set the parameters accordingly.numactl --membind=<numa-id> stress -m <workers-num> --vm-bytes <malloc-size-per-workers>
Run stress tests with acceleration disabled and enabled.
Stress test with acceleration disabled
Send requests from the stress test machine to generate medium-level and high-level loads on redis-server.
500 concurrent requests (medium load):
redis-benchmark -t GET -c 500 -d 4096 -n 2000000 -h <redis-server-IP> -p <redis-server-port>10,000 concurrent requests (high load):
redis-benchmark -t GET -c 10000 -d 4096 -n 2000000 -h <redis-server-IP> -p <redis-server-port>
Enable nearby memory access acceleration
Run the following command to enable acceleration for the Redis pod:
kubectl annotate pod redis koordinator.sh/memoryLocality='{"policy": "BestEffort"}' --overwriteVerify that migration completed:
kubectl describe pod redisExpected output (large volumes of remote memory may take time to migrate):
Normal MemoryLocalitySuccess 0s koordlet-resmanager migrated memory from remote numa: 0 to local numa: 1, cur local memory ratio 98, rest remote memory pages 28586Stress test with acceleration enabled
Repeat the stress tests from step a to generate medium-level and high-level loads.
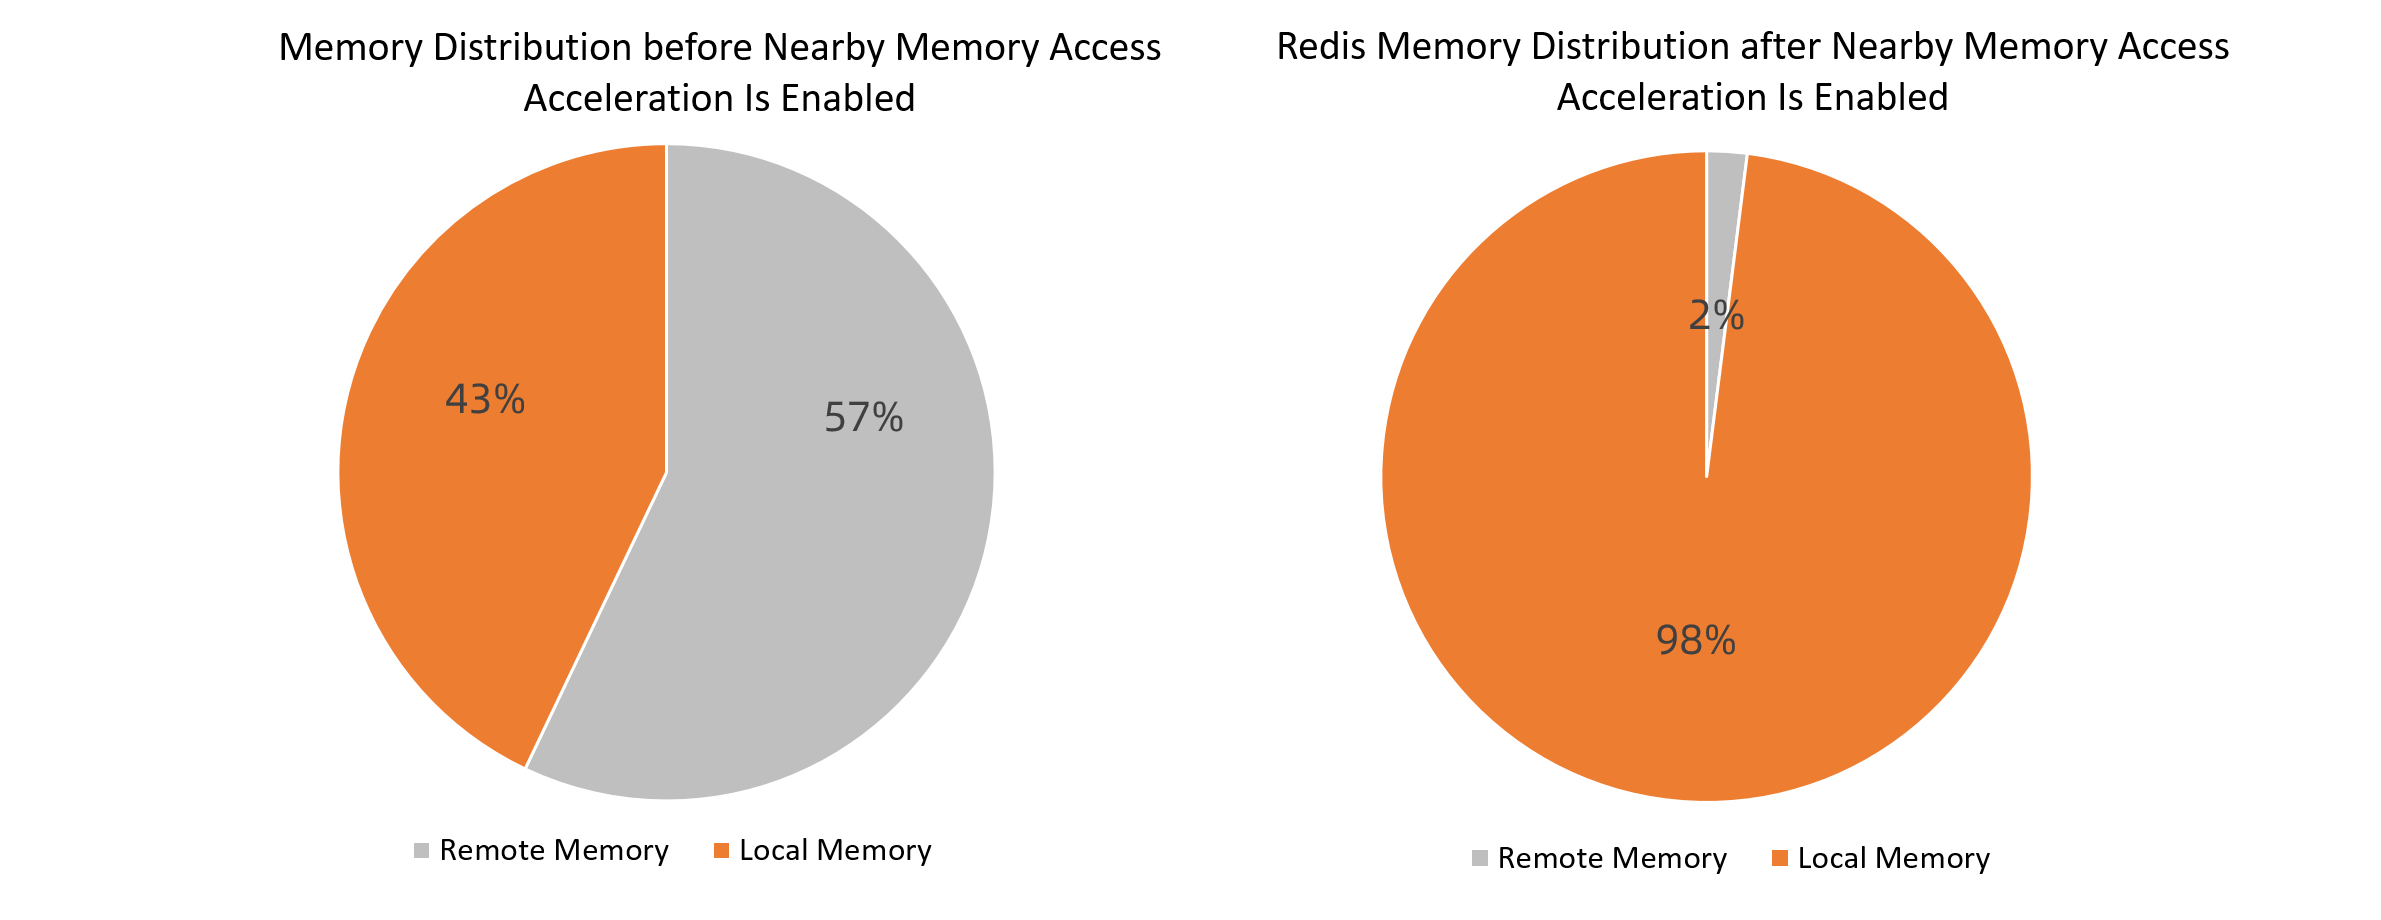
Results for ecs.ebmc8i.48xlarge
Memory distribution: 43% local before acceleration, 98% local after acceleration.
500 concurrent requests
Scenario
P99 ms
P99.99 ms
QPS
Before acceleration
3
9.6
122,139.91
After acceleration
3
8.2
129,367.11
P99 latency unchanged. P99.99 latency reduced by 14.58%. QPS increased by 5.917%.
10,000 concurrent requests
Scenario
P99 ms
P99.99 ms
QPS
Before acceleration
115
152.6
119,895.56
After acceleration
101
145.2
125,401.44
P99 latency reduced by 12.17%. P99.99 latency reduced by 4.85%. QPS increased by 4.59%.
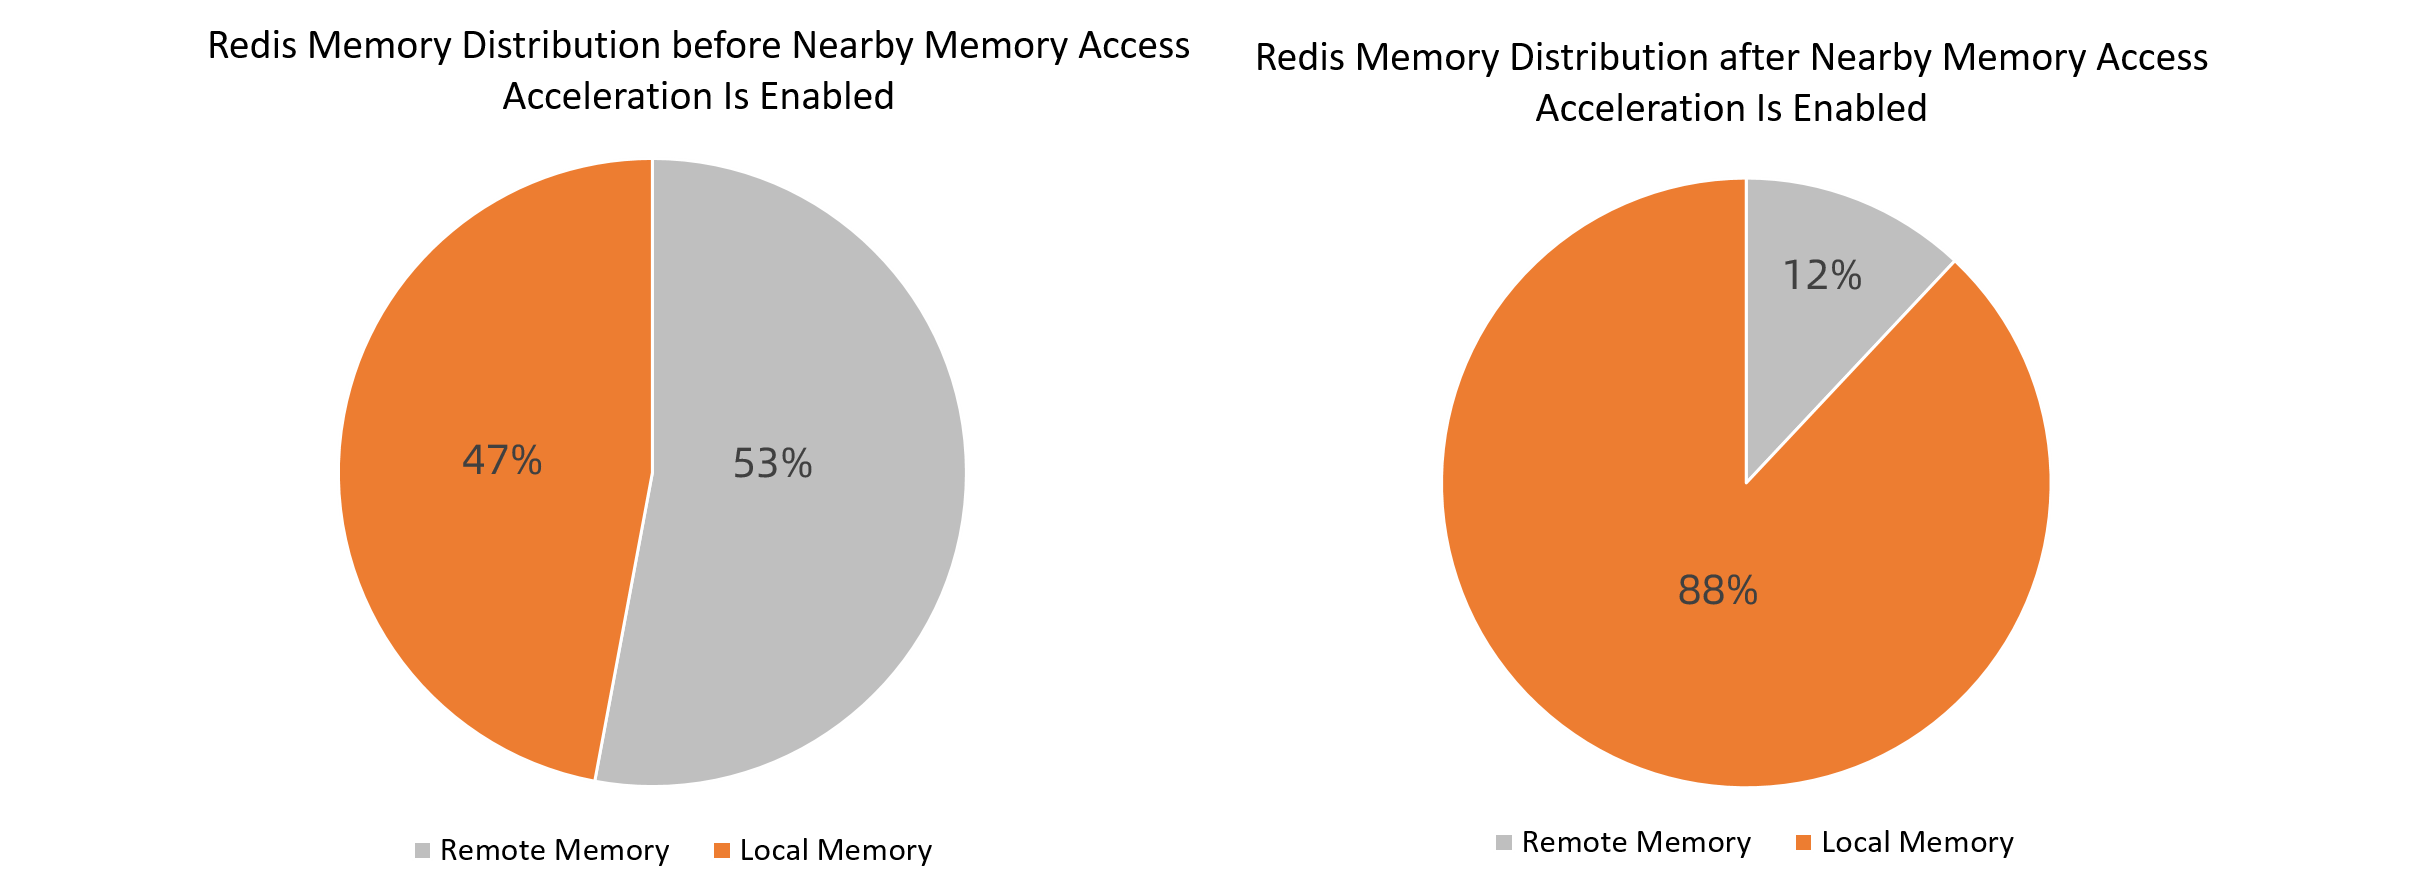
Results for ecs.ebmg7a.64xlarge
Memory distribution: 47% local before acceleration, 88% local after acceleration.
500 concurrent requests
Scenario
P99 ms
P99.99 ms
QPS
Before acceleration
2.4
4.4
135,180.99
After acceleration
2.2
4.4
136,296.37
P99 latency reduced by 8.33%. P99.99 latency unchanged. QPS increased by 0.83%.
10,000 concurrent requests
Scenario
P99 ms
P99.99 ms
QPS
Before acceleration
58.2
80.4
95,757.10
After acceleration
56.6
76.8
97,015.50
P99 latency reduced by 2.7%. P99.99 latency reduced by 4.4%. QPS increased by 1.3%.
Conclusion: Under high memory loads where application data has drifted to remote NUMA nodes, binding vCores and enabling nearby memory access acceleration reduces access latency and increases throughput for Redis under both medium and high concurrency.