To address limited visibility at the container engine layer, SysOM provides OS kernel-level container monitoring that improves observability for memory issues and supports container migration. This topic explains how to use SysOM to diagnose container memory problems, including working set breakdowns beyond standard metrics.
Prerequisites
Ensure that you have:
-
An ACK Managed Cluster or ACK Serverless Cluster created after October 2021, running Kubernetes 1.18.8 or later. Manually upgrade if needed.
-
Prometheus Service for Alibaba Cloud enabled.
-
The ack-sysom-monitor feature is enabled.
Billing
When enabled, ack-sysom-monitor sends monitoring metrics to Prometheus Service for Alibaba Cloud. These metrics are billed as Custom Metrics and incur additional fees.
Review the billing overview for Prometheus Service for Alibaba Cloud before enabling this feature. Costs depend on cluster size and application count. Use Resource Consumption to monitor usage.
Key concepts
Container memory components
ACK provides OS kernel-level container monitoring to precisely track memory usage and prevent OOM issues.
Container memory has three categories:
| Category | Subcategory | Description |
|---|---|---|
| Application memory | Anonymous memory: heap, stack, and data segments of a process, allocated via brk and mmap system calls |
Memory used by the running application |
File cache: data cached for file I/O. Frequently accessed cache (ActiveFileCache) is not easily reclaimed. |
||
| Buffers: metadata for block devices or file systems | ||
| HugeTLB: memory allocated via HugePages | ||
| Kernel memory | Slab: memory pool for kernel object caches | Memory used by the OS kernel |
| Vmalloc: allocates large virtual memory blocks | ||
| allocpage: allocates local memory | ||
| Others: kernel stack, page table, and reserved memory | ||
| Free memory | — | Unused, available memory |
Working set vs. RSS
Kubernetes tracks two key memory metrics:
-
Working set — memory a container actively uses:
working set = inactive_anon + active_anon + active_file. The OOM killer and Kubernetes use this to decide whether to evict or terminate a container. -
RSS (resident set size) — physical memory mapped into the container's address space, excluding file cache. RSS reflects actual application memory but excludes cached memory that Kubernetes counts against the limit.
Because Kubernetes uses working set for eviction decisions, file cache can silently inflate it and trigger OOM kills even when application memory is stable. SysOM breaks down working set into components to identify which memory type causes the problem.
How it works
SysOM surfaces OS kernel-level metrics in Prometheus Monitoring dashboards in the ACK console, organizing pod memory into working set components to trace high usage to specific memory types.
Use these formulas when diagnosing memory issues:
-
Total pod memory = RSS + Cache ≈ inactive_anon + active_anon + inactive_file + active_file -
working set = inactive_anon + active_anon + active_file
Locate and fix container memory issues
Step 1: Open the SysOM dashboard
-
Log on to the ACK console. In the left navigation pane, click Clusters.
-
On the Clusters page, click your cluster name. In the left navigation pane, click Operations > Prometheus Monitoring.
-
On the Prometheus Monitoring page, click the SysOM tab, then click SysOM - Pods.
Step 2: Identify the memory black hole
-
In the Pod Memory Monitor section, apply the total pod memory formula to break down memory into cache and RSS. Review cache (
active_file,inactive_file,shmem) and RSS (active_anon,inactive_anon) proportions. In this example,inactive_anondominates.
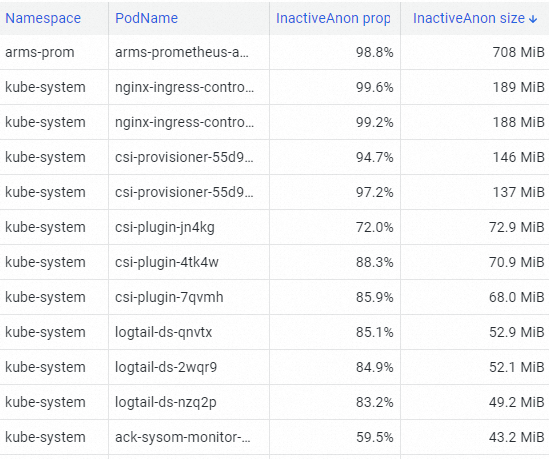
-
In the Pod Resource Analysis section, use top to identify the pod with the highest InactiveAnon consumption. In this example, arms-prom has the highest consumption.
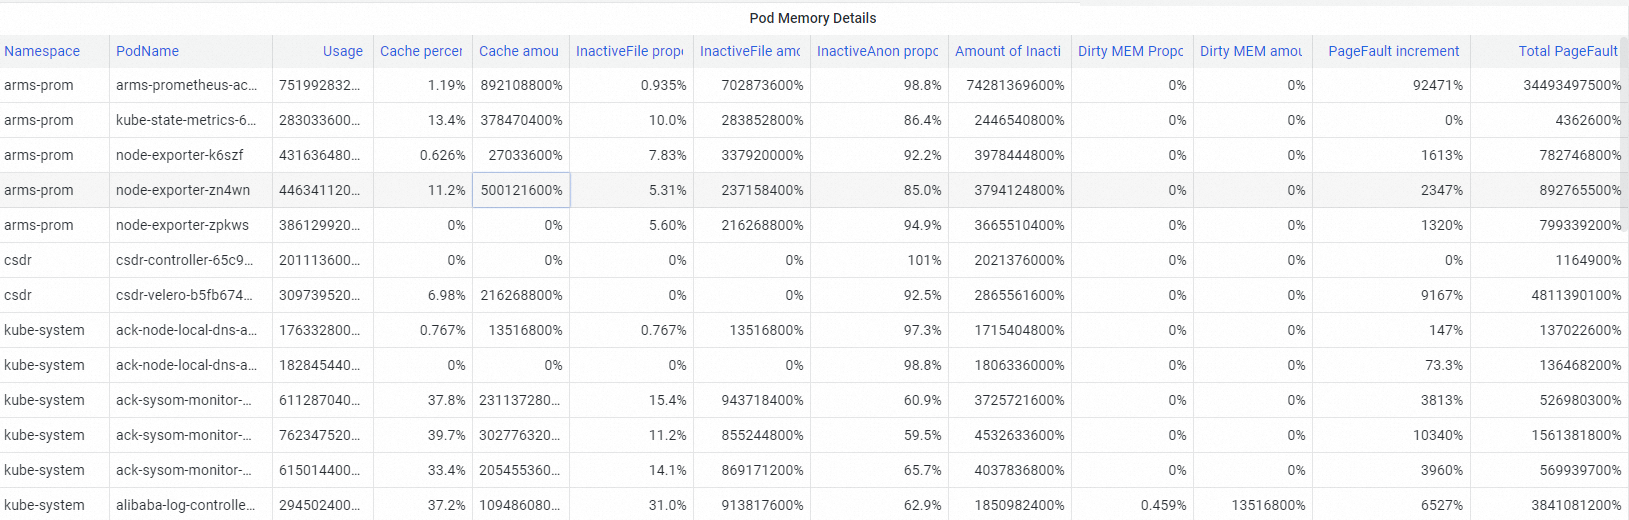
-
In the Pod Memory Details section, view the memory composition of the identified pod. Components include Pod Cache, InactiveFile (inactive file cache), InactiveAnon (inactive anonymous memory), and dirty memory (unwritten modifications). Use these breakdowns to pinpoint the memory black hole.
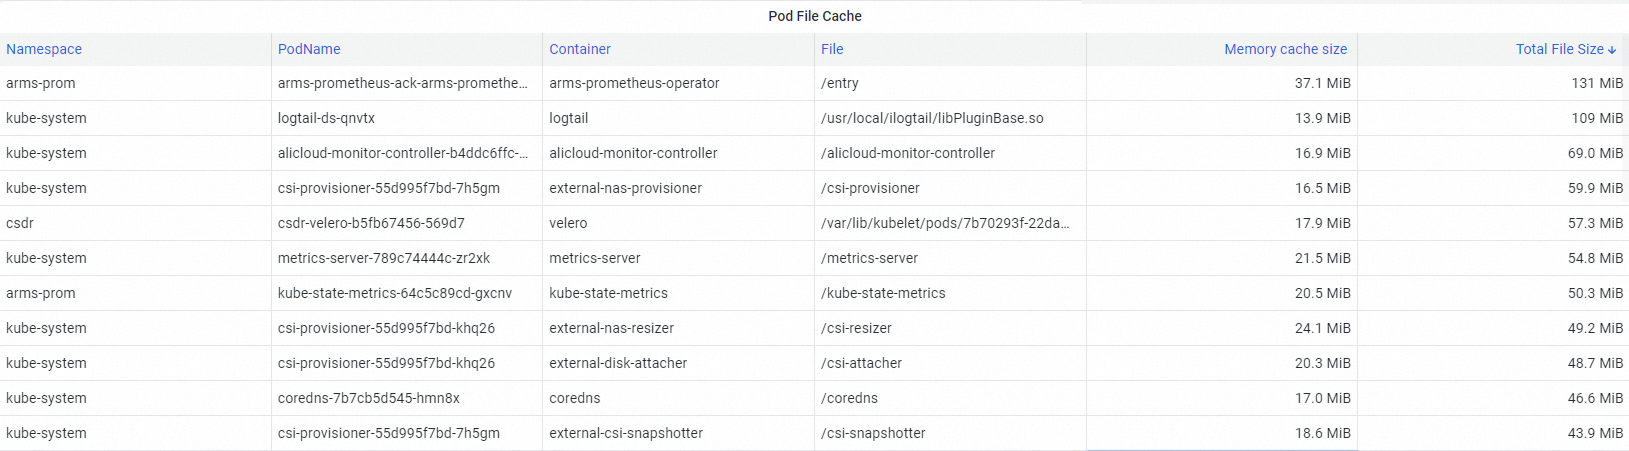
Step 3: Investigate file cache usage
In the Pod File Cache section, identify what drives high cache memory.
Unreclaimable file cache inflates working set, becoming a memory black hole that counts toward the pod's memory limit and can trigger eviction or OOM kills without increased application memory.
Step 4: Fix the memory black hole
After identifying the memory black hole, resolve it with ACK fine-grained scheduling. See Enable container memory QoS.
Next steps
-
For all SysOM metrics, see SysOM kernel-level container monitoring.
-
For kernel capabilities behind ACK memory QoS, see Overview of kernel features and interfaces.