AHPA uses GPU utilization data from the Prometheus Adapter, combined with historical load trends and prediction algorithms, to forecast future GPU resource requirements. It automatically adjusts the number of pod replicas or allocates GPU resources to scale out before GPU resources become constrained and scale in when resources are idle. This approach reduces costs and improves cluster efficiency.
Prerequisites
-
You have created a managed GPU cluster. For more information, see Add GPU nodes to a cluster.
-
Install the AHPA component and configure the metric source. For more information, see Elastic scaling prediction (AHPA).
-
Enable Prometheus monitoring and ensure that at least seven days of historical application data (GPU) have been collected in Prometheus. For more information, see Connect to and configure Alibaba Cloud Prometheus monitoring.
How it works
In high-performance computing (HPC), especially for deep learning model training and inference, fine-grained management and dynamic adjustment of GPU resources improve utilization and reduce costs. Container Service for Kubernetes supports elastic scaling based on GPU metrics. You can use Prometheus to collect key GPU metrics such as real-time utilization and GPU memory usage. Then, use the Prometheus Adapter to transform these metrics into a Kubernetes-compatible format and integrate them with AHPA. AHPA uses this data, along with historical load trends and prediction algorithms, to forecast future GPU resource requirements and automatically adjusts the number of pod replicas or GPU resource allocation. This ensures scale-out occurs before resources become constrained and scale-in happens promptly when resources are idle, reducing costs and improving cluster efficiency.
Step 1: Deploy Metrics Adapter
-
Obtain the internal HTTP API endpoint.
-
Log on to the ARMS console.
-
In the left navigation pane, choose .
-
On the Instances page, select the region where your Container Service for Kubernetes cluster is located.
-
Click the name of your target Prometheus instance. In the left navigation pane, click Settings to obtain the internal endpoint under HTTP API address.
-
-
Deploy ack-alibaba-cloud-metrics-adapter.
Log on to the ACK console. In the left navigation pane, click .
-
On the Marketplace page, click the App Catalog tab, search for ack-alibaba-cloud-metrics-adapter, and click it.
-
On the ack-alibaba-cloud-metrics-adapter page, click Quick Deployment in the upper-right corner.
-
In the Basic Information wizard, select your Cluster and Namespace, then click Next.
-
In the Parameters wizard, select a Chart Version. In the Parameter section, set the internal HTTP API endpoint obtained in Step 1 as the value for
prometheus.url, then click OK.prometheus: enabled: true url: http://
Step 2: Implement AHPA elastic prediction based on GPU metrics
This topic deploys a model inference service on a GPU and continuously sends requests to it. AHPA performs elastic prediction based on GPU utilization.
-
Deploy the inference service.
-
Run the following command to deploy the inference service.
-
Run the following command to check the pod status.
kubectl get pods -o wideExpected output:
NAME READY STATUS RESTARTS AGE IP NODE NOMINATED NODE READINESS GATES bert-intent-detection-7b486f6bf-f**** 1/1 Running 0 3m24s 10.15.1.17 cn-beijing.192.168.94.107 <none> <none> -
Run the following command to call the inference service and verify the deployment.
Use the command
kubectl get svc bert-intent-detection-svcto obtain the IP address of the GPU node and replace47.95.XX.XXin the following command.curl -v "http://47.95.XX.XX/predict?query=Music"Expected output:
*   Trying 47.95.XX.XX...
* TCP_NODELAY set
* Connected to 47.95.XX.XX (47.95.XX.XX) port 80 (#0)
> GET /predict?query=Music HTTP/1.1
> Host: 47.95.XX.XX
> User-Agent: curl/7.64.1
> Accept: */*
>
* HTTP 1.0, assume close after body
< HTTP/1.0 200 OK
< Content-Type: text/html; charset=utf-8
< Content-Length: 9
< Server: Werkzeug/1.0.1 Python/3.6.9
< Date: Wed, 16 Feb 2022 03:52:11 GMT
<
* Closing connection 0
PlayMusic #Intent recognition result.
If the HTTP request returns status code
200and an intent recognition result, the inference service is deployed successfully.
-
-
Configure AHPA.
This example uses GPU utilization. Scale-out is triggered when GPU utilization of a pod exceeds 20%.
-
Configure the AHPA metric source.
-
Create a file named application-intelligence.yaml with the following content.
prometheusUrlsets the endpoint for Alibaba Cloud Prometheus. Use the internal endpoint obtained in Step 1.apiVersion: v1 kind: ConfigMap metadata: name: application-intelligence namespace: kube-system data: prometheusUrl: "http://cn-shanghai-intranet.arms.aliyuncs.com:9090/api/v1/prometheus/da9d7dece901db4c9fc7f5b*******/1581204543170*****/c54417d182c6d430fb062ec364e****/cn-shanghai" -
Run the following command to deploy application-intelligence.
kubectl apply -f application-intelligence.yaml
-
-
Deploy AHPA.
-
Create a file named fib-gpu.yaml with the following content.
The mode is set to
observer. For more information about parameters, see metric description. -
Run the following command to deploy AHPA.
kubectl apply -f fib-gpu.yaml -
Run the following command to check the AHPA status.
kubectl get ahpaExpected output:
NAME             STRATEGY   REFERENCE               METRIC   TARGET(%)   CURRENT(%)   DESIREDPODS   REPLICAS   MINPODS   MAXPODS   AGE
fib-gpu          observer   bert-intent-detection   gpu      20          0          0            1          10        50        6d19h
The expected output shows that
CURRENT(%)is0andTARGET(%)is20. This means the current GPU utilization is 0%. Elastic scale-out is triggered when GPU utilization exceeds 20%.
-
-
-
Test elastic scaling for the inference service.
-
Run the following command to access the inference service.
-
While accessing the service, run the following command to check the AHPA status.
kubectl get ahpaExpected output:
NAME             STRATEGY   REFERENCE               METRIC   TARGET(%)   CURRENT(%)   DESIREDPODS   REPLICAS   MINPODS   MAXPODS   AGE
fib-gpu          observer   bert-intent-detection   gpu      20          189          10            4          10        50        6d19h
The expected output shows that the current GPU utilization
CURRENT(%)exceeds theTARGET(%)value. Elastic scaling is triggered, and the desired number of podsDESIREDPODSis10. -
Run the following command to view the prediction trend.
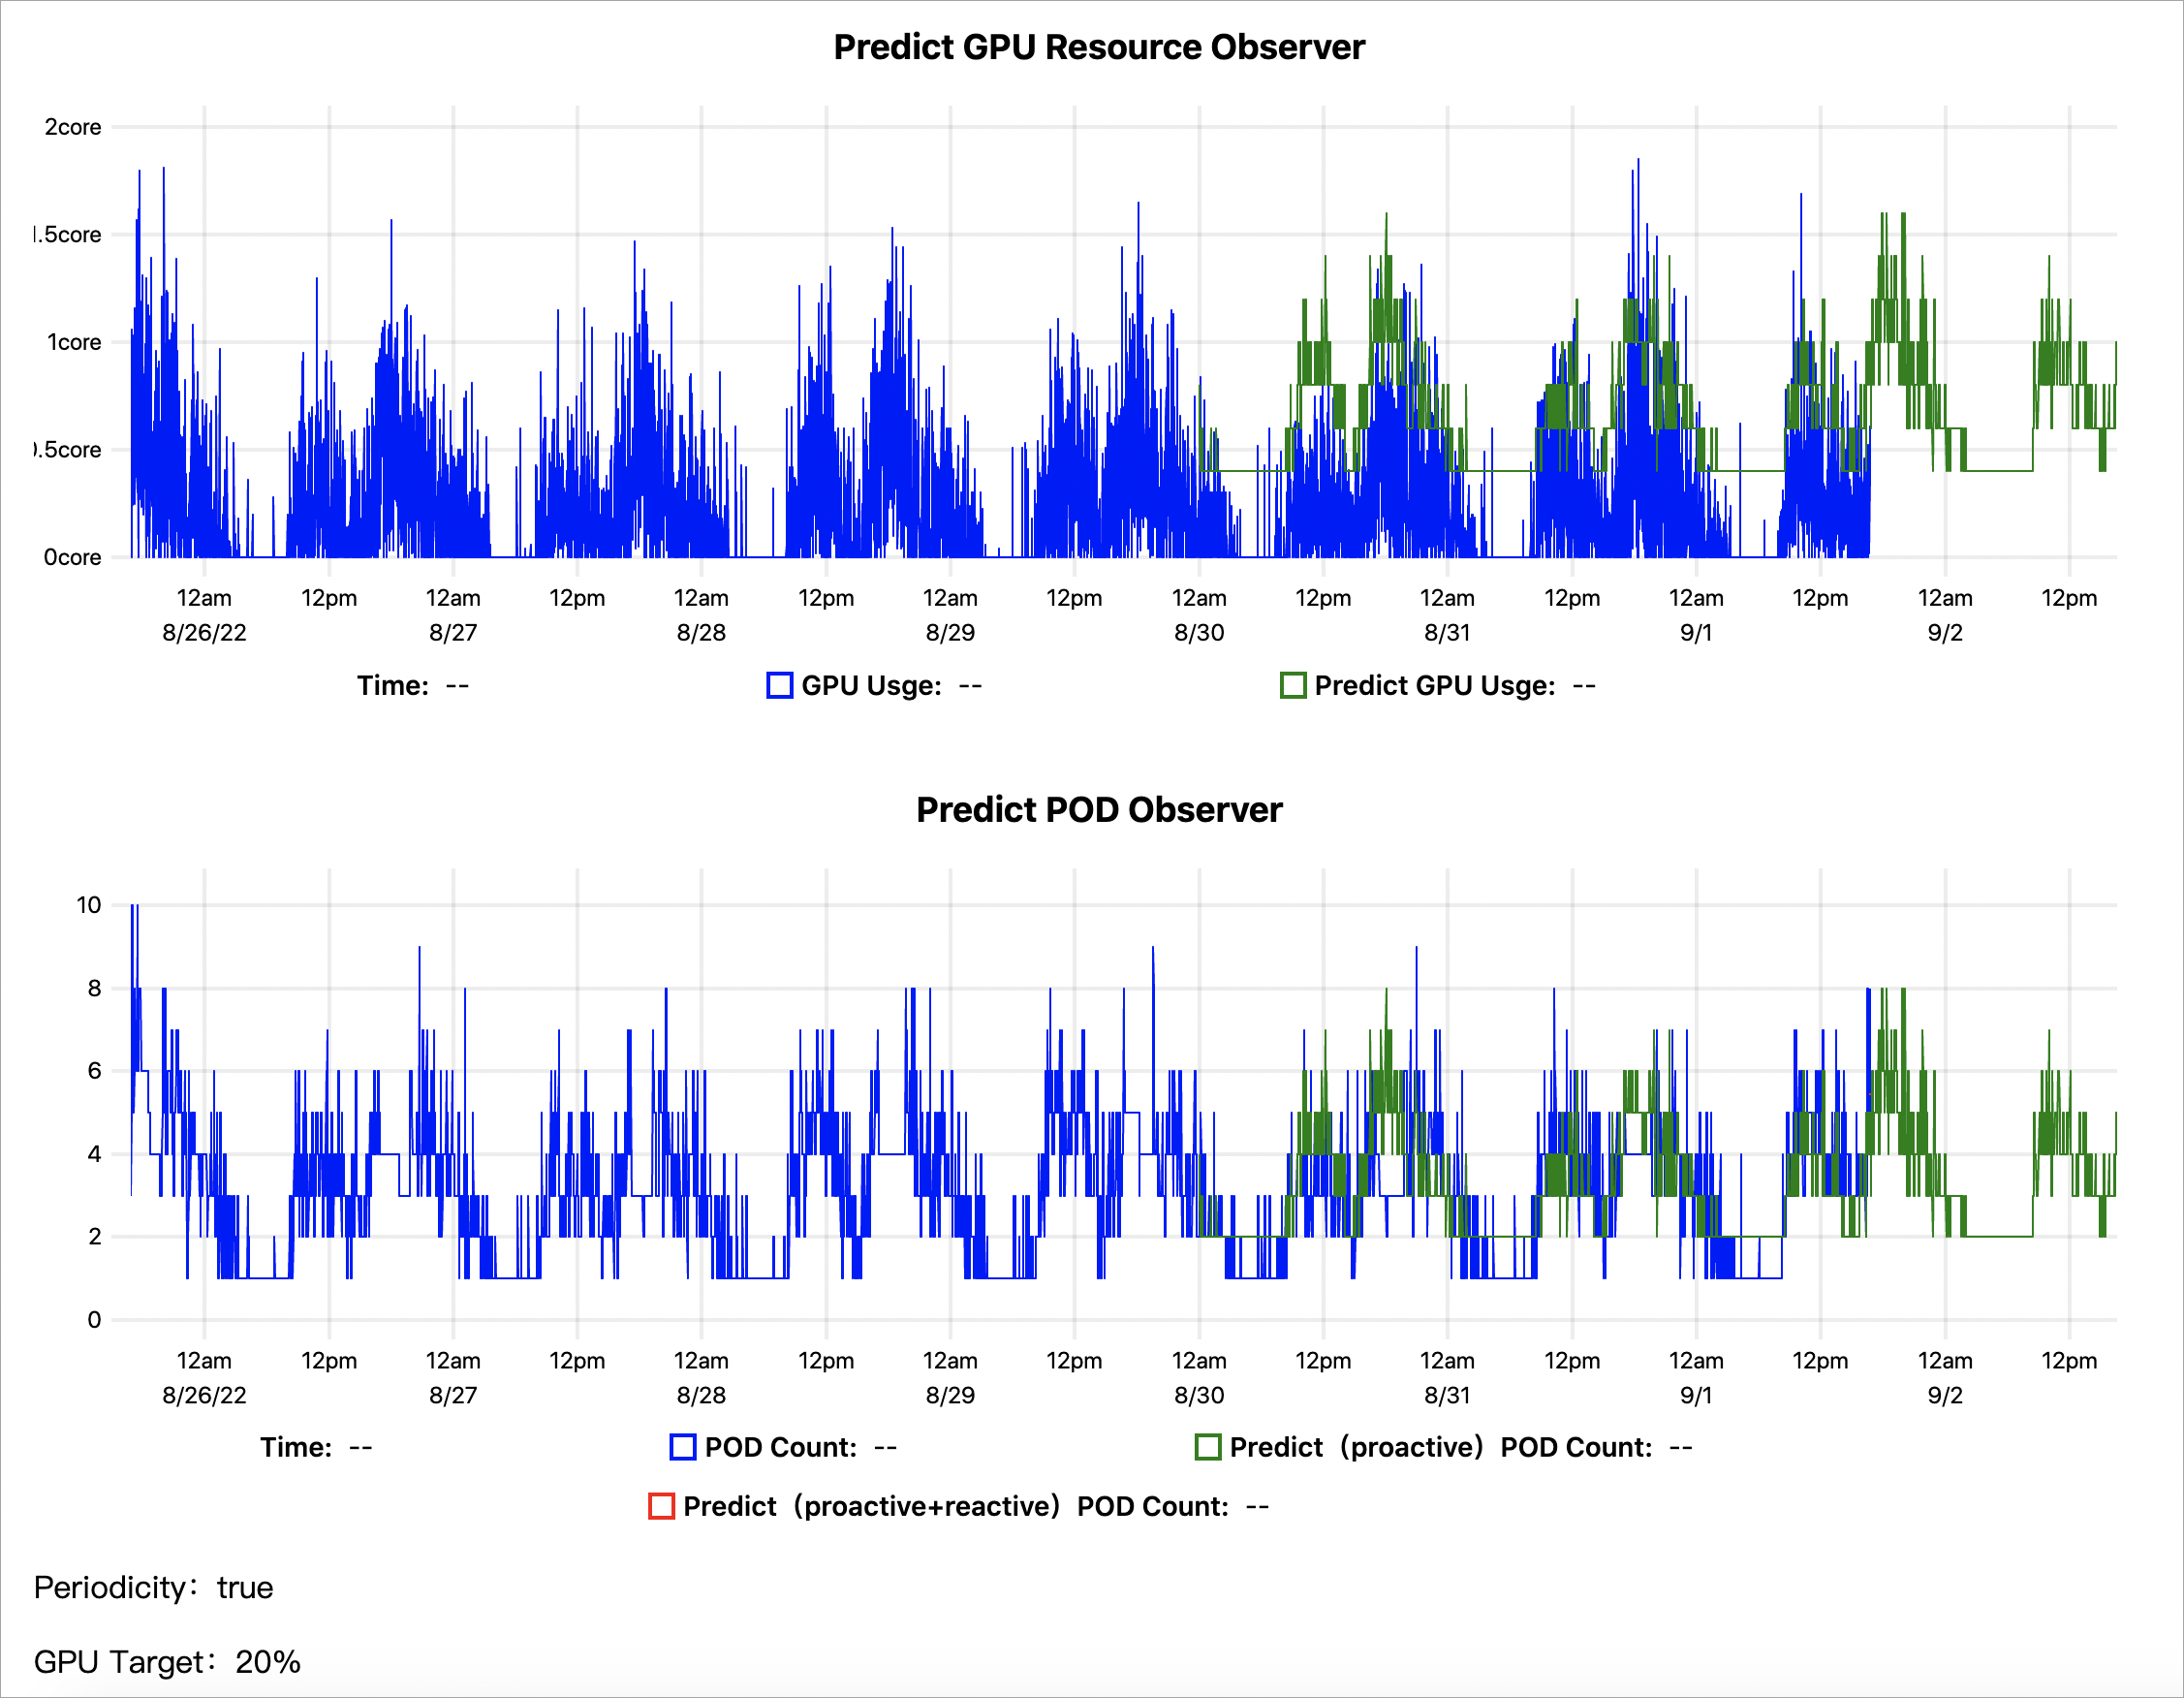
kubectl get --raw '/apis/metrics.alibabacloud.com/v1beta1/namespaces/default/predictionsobserver/fib-gpu'|jq -r '.content' |base64 -d > observer.htmlThe following figure shows an example prediction trend based on seven days of historical GPU metrics:
-
Predict GPU Resource Observer: The blue line shows actual GPU usage. The green line shows GPU usage predicted by AHPA. The green curve is mostly above the blue curve, indicating that the predicted GPU capacity is sufficient.
-
Predict POD Observer: The blue line shows the actual number of scaled pods. The green line shows the number of pods predicted by AHPA. The green curve is mostly below the blue curve, indicating that AHPA predicts fewer pods. You can set the elastic scaling mode to
autoto use the predicted pod count, which saves pod resources and avoids waste.
The prediction results meet expectations. After observation, if the results remain satisfactory, set the elastic scaling mode to
autoso AHPA handles scaling. -
-
References
-
Knative Serverless supports AHPA (Advanced Horizontal Pod Autoscaler) elastic capabilities. When application resource requirements are periodic, elastic prediction preheats resources and solves cold start issues in Knative. For more information, see Use AHPA elastic prediction in Knative.
-
In many scenarios, applications must scale based on custom metrics such as HTTP request QPS or message queue length. AHPA provides an External Metrics mechanism. Combined with the alibaba-cloud-metrics-adapter component, it offers richer scaling options. For more information, see Configure custom metrics with AHPA to scale applications.