Container Service for Kubernetes supports the Advanced Horizontal Pod Autoscaler (AHPA). AHPA analyzes historical data to predict future resource demand. It then dynamically adjusts the number of pod replicas to scale out and pre-warm resources before traffic peaks occur. This improves system responsiveness and stability. AHPA also scales in resources during off-peak periods to reduce costs.
Prerequisites
You have an ACK managed cluster or an ACK Serverless cluster. For more information, see Create an ACK managed cluster or Create a cluster.
Managed Service for Prometheus must be enabled and have at least seven days of collected historical application data, such as CPU and memory usage. For more information about how to enable it, see Access and configure Managed Service for Prometheus.
Step 1: Install AHPA Controller
Log on to the ACK console. In the left navigation pane, click Clusters.
On the Clusters page, click the name of your cluster. In the left navigation pane, click Components and Add-ons.
On the Add-ons page, locate the AHPA Controller component. Click Install on the component card and follow the on-screen instructions to complete the installation.
Step 2: Configure Prometheus data source
Log on to the ARMS console.
-
In the left navigation pane, choose .
At the top of the Instances page, select the region of your Prometheus instance, and then click the name of the instance, which is the same as your ACK cluster name.
On the Settings page, in the HTTP API Address (Grafana Read Address) section, record the values of the following fields:
(Optional) If token-based authentication is enabled, record the access token.
View and record the Internal Network endpoint (Prometheus URL).
Set the Prometheus query URL in your ACK cluster.
Create a file named
application-intelligence.yamlwith the following content.prometheusUrl: The endpoint for Managed Service for Prometheus.token: The access token for Prometheus.
apiVersion: v1 kind: ConfigMap metadata: name: application-intelligence namespace: kube-system data: prometheusUrl: "http://cn-hangzhou-intranet.arms.aliyuncs.com:9443/api/v1/prometheus/da9d7dece901db4c9fc7f5b9c40****/158120454317****/cc6df477a982145d986e3f79c985a****/cn-hangzhou" token: "eyJhxxxxx"NoteTo view the AHPA dashboard in Managed Service for Prometheus, you must also configure the following fields in this ConfigMap:
prometheus_writer_url: The internal Remote Write endpoint.prometheus_writer_ak: The AccessKey ID of your Alibaba Cloud account.prometheus_writer_sk: The AccessKey secret of your Alibaba Cloud account.
For more information, see Enable the Prometheus dashboard for AHPA.
Run the following command to deploy
application-intelligence.kubectl apply -f application-intelligence.yaml
Step 3: Deploy a test service
The test service includes a Deployment named fib-deployment, a Service named fib-svc, and a load generator named fib-loader to simulate traffic fluctuations. You will also deploy a HorizontalPodAutoscaler (HPA) resource to establish a baseline for comparison with AHPA.
Create a file named demo.yaml with the following content.
apiVersion: apps/v1
kind: Deployment
metadata:
  name: fib-deployment
  namespace: default
  annotations:
    k8s.aliyun.com/eci-use-specs: "1-2Gi"
spec:
  replicas: 1
  selector:
    matchLabels:
      app: fib-deployment
  strategy:
    rollingUpdate:
      maxSurge: 25%
      maxUnavailable: 25%
    type: RollingUpdate
  template:
    metadata:
      creationTimestamp: null
      labels:
        app: fib-deployment
    spec:
      containers:
      - image: registry.cn-huhehaote.aliyuncs.com/kubeway/knative-sample-fib-server:20200820-171837
        imagePullPolicy: IfNotPresent
        name: user-container
        ports:
        - containerPort: 8080
          name: user-port
          protocol: TCP
        resources:
          limits:
            cpu: "1"
            memory: 2000Mi
          requests:
            cpu: "1"
            memory: 2000Mi
---
apiVersion: v1
kind: Service
metadata:
  name: fib-svc
  namespace: default
spec:
  ports:
  - name: http
    port: 80
    protocol: TCP
    targetPort: 8080
  selector:
    app: fib-deployment
  sessionAffinity: None
  type: ClusterIP
---
apiVersion: apps/v1
kind: Deployment
metadata:
  name: fib-loader
  namespace: default
spec:
  progressDeadlineSeconds: 600
  replicas: 1
  revisionHistoryLimit: 10
  selector:
    matchLabels:
      app: fib-loader
  strategy:
    rollingUpdate:
      maxSurge: 25%
      maxUnavailable: 25%
    type: RollingUpdate
  template:
    metadata:
      creationTimestamp: null
      labels:
        app: fib-loader
    spec:
      containers:
      - args:
        - -c
        - |
          /ko-app/fib-loader --service-url="http://fib-svc.${NAMESPACE}?size=35&interval=0" --save-path=/tmp/fib-loader-chart.html
        command:
        - sh
        env:
        - name: NAMESPACE
          valueFrom:
            fieldRef:
              apiVersion: v1
              fieldPath: metadata.namespace
        image: registry.cn-huhehaote.aliyuncs.com/kubeway/knative-sample-fib-loader:20201126-110434
        imagePullPolicy: IfNotPresent
        name: loader
        ports:
        - containerPort: 8090
          name: chart
          protocol: TCP
        resources:
          limits:
            cpu: "8"
            memory: 16000Mi
          requests:
            cpu: "2"
            memory: 4000Mi
---
apiVersion: autoscaling/v1
kind: HorizontalPodAutoscaler
metadata:
  name: fib-hpa
  namespace: default
spec:
  maxReplicas: 50
  minReplicas: 1
  scaleTargetRef:
    apiVersion: apps/v1
    kind: Deployment
    name: fib-deployment
  targetCPUUtilizationPercentage: 50
---
Step 4: Deploy AHPA
To configure a scaling policy, create an AdvancedHorizontalPodAutoscaler resource.
Create a file named
ahpa-demo.yamlwith the following content.apiVersion: autoscaling.alibabacloud.com/v1beta1 kind: AdvancedHorizontalPodAutoscaler metadata: name: ahpa-demo spec: scaleStrategy: observer metrics: - type: Resource resource: name: cpu target: type: Utilization averageUtilization: 40 scaleTargetRef: apiVersion: apps/v1 kind: Deployment name: fib-deployment maxReplicas: 100 minReplicas: 2 stabilizationWindowSeconds: 300 prediction: quantile: 95 scaleUpForward: 180 instanceBounds: - startTime: "2021-12-16 00:00:00" endTime: "2031-12-16 00:00:00" bounds: - cron: "* 0-8 ? * MON-FRI" maxReplicas: 15 minReplicas: 4 - cron: "* 9-15 ? * MON-FRI" maxReplicas: 15 minReplicas: 10 - cron: "* 16-23 ? * MON-FRI" maxReplicas: 20 minReplicas: 15The following table describes some of the parameters.
Parameter
Required
Description
scaleTargetRef
Yes
Specifies the target Deployment.
metrics
Yes
Configures the metrics for scaling. Supported metrics include CPU, GPU, memory, QPS, and RT.
target
Yes
The target threshold. For example,
averageUtilization: 40sets the target CPU utilization to 40%.scaleStrategy
No
Specifies the scaling mode. The default value is
observer.auto: AHPA performs scaling operations.observer: AHPA observes but does not perform scaling operations. You can use this mode to check if AHPA works as expected.proactive: Only proactive prediction takes effect.reactive: Only reactive scaling takes effect.
maxReplicas
Yes
The maximum number of replicas to scale out to.
minReplicas
Yes
The minimum number of replicas to scale in to.
stabilizationWindowSeconds
No
The stabilization window for scaling operations. This prevents rapid fluctuations in the number of replicas. The default value is 300 seconds.
prediction.quantile
Yes
The prediction quantile. A higher value results in a more conservative prediction. The value must be between 0 and 100. The recommended range is 90 to 99, with a default of 99.
prediction.scaleUpForward
Yes
The time it takes for a new pod to become
Ready. This is also known as the cold start time.instanceBounds
No
The boundaries for the number of replicas within specific time periods.
startTime: The start time.endTime: The end time.
instanceBounds.bounds.cron
No
Configures a scheduled task. A cron expression specifies a schedule using several space-separated fields to specify a set of times. For example,
- cron: "* 0-8 ? * MON-FRI"specifies that the task runs every minute from 00:00 to 08:59 on Monday to Friday.The fields of a cron expression are described as follows. For more information, see Cron scheduled tasks.
Field
Required
Allowed values
Special characters
Minutes
Yes
0–59
* / , -
Hours
Yes
0–23
* / , -
Day of month
Yes
1–31
* / , - ?
Month
Yes
1–12 or JAN–DEC
* / , -
Day of week
Yes
0–6 or SUN–SAT
* / , - ?
NoteThe Month and Day of week fields are not case-sensitive. For example,
SUN,Sun, andsunhave the same effect.If the Day of Week field is not configured, it defaults to
*.Special characters:
*: Matches all possible values in the field./: Specifies an increment for a value.,: Lists enumerated values.-: Specifies a range.?: Indicates that no specific value is set. Use this in either the Day of month or Day of week field when the other is specified.
Run the following command to create the AHPA scaling policy.
kubectl apply -f ahpa-demo.yaml
Step 5: View prediction results
To view the predictive scaling results of AHPA, you can enable the Prometheus dashboard for AHPA.
Because prediction requires seven days of historical data, you must run the sample application for seven days after deployment to see the prediction results. If you have an existing production application, you can specify it directly in the AHPA resource.
This example uses the observer scaling mode (observer mode) to compare the AHPA prediction results with the results from a standard HPA policy. The HPA results serve as a baseline for the application's actual resource requirements. This comparison helps you observe whether the AHPA predictions meet your expectations.
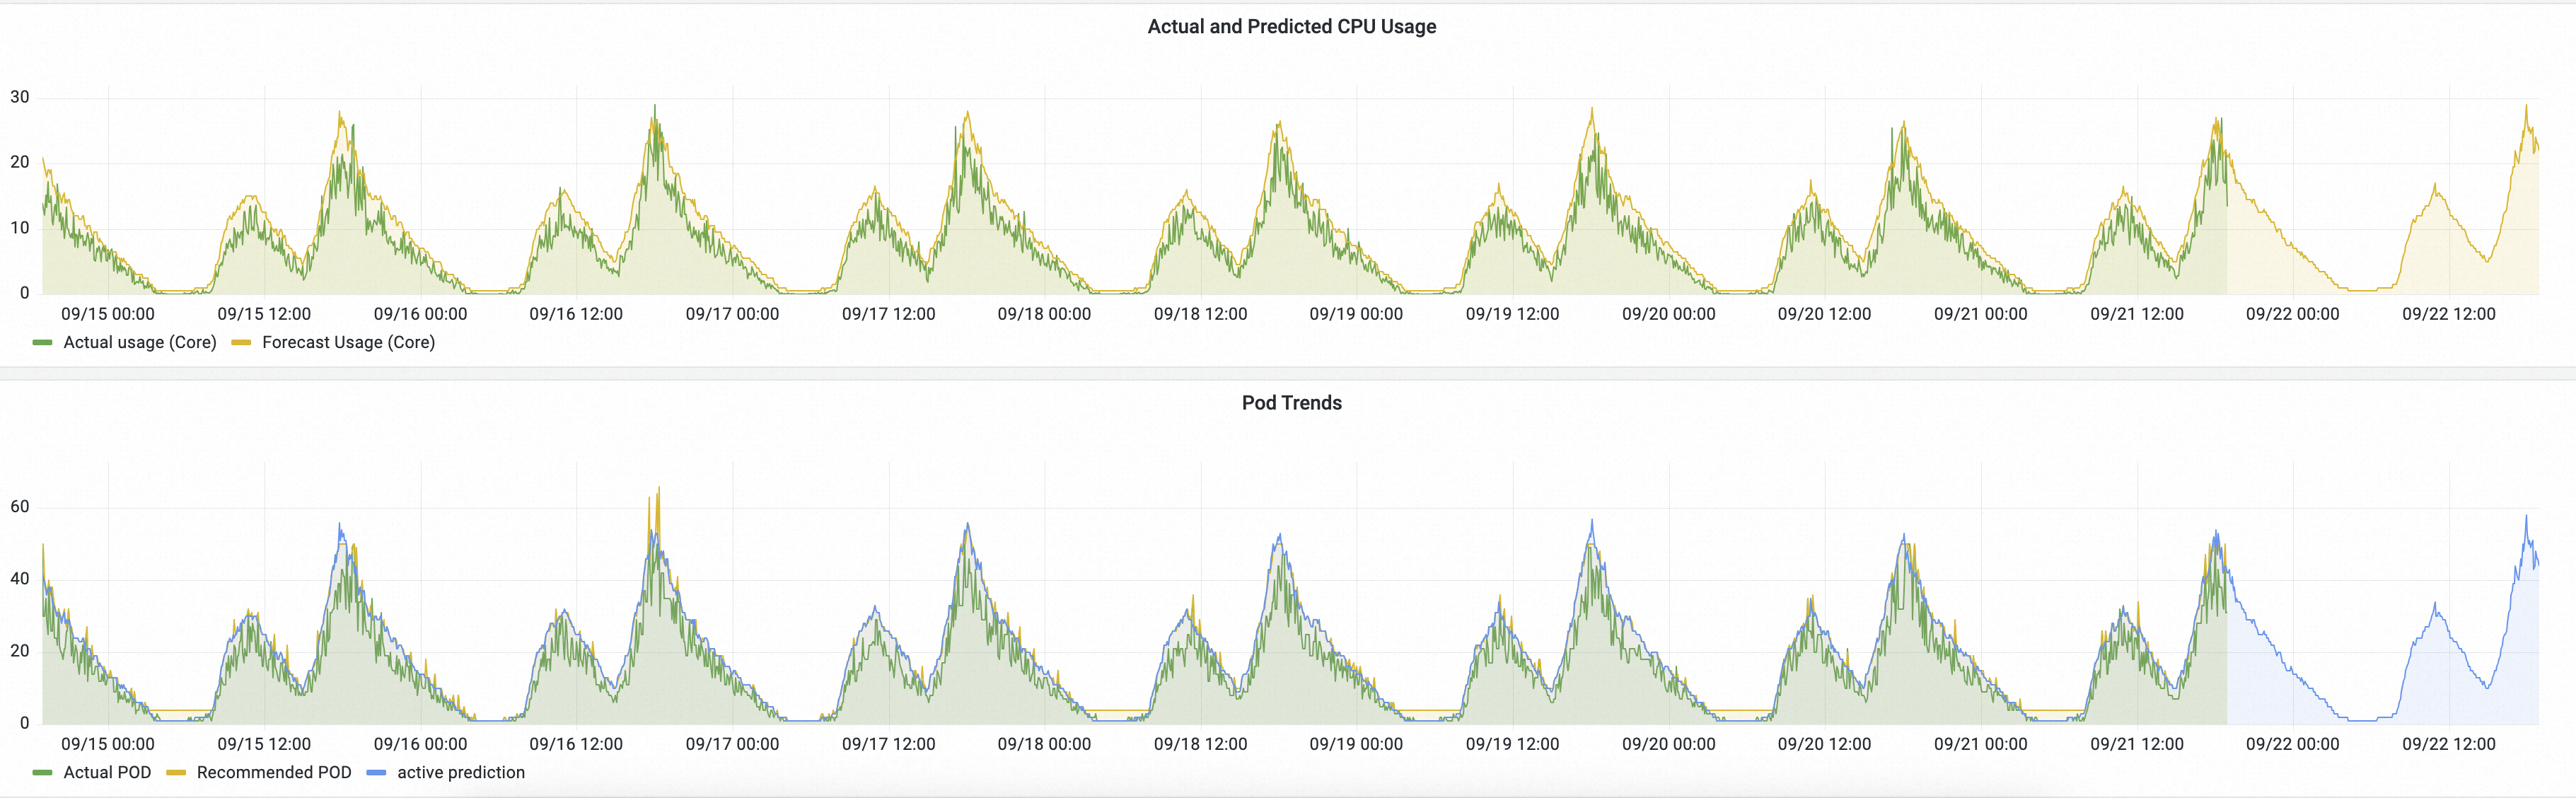
Actual and Predicted CPU Usage: The green line represents the actual CPU usage managed by HPA. The yellow line represents the CPU usage predicted by AHPA.
When the yellow curve is above the green curve, it indicates that the predicted CPU capacity is sufficient.
When the yellow curve rises before the green curve, it indicates that AHPA prepares the required resources in advance.
Pod Trends: The green line represents the actual number of pods scaled by HPA. The yellow line represents the number of pods predicted by AHPA.
A lower yellow curve can indicate that AHPA achieves the same goal with fewer pods.
The yellow curve is smoother than the green curve, indicating that scaling events managed by AHPA are less volatile, which improves service stability.
The prediction results indicate that the scaling trend is as expected. If the trend meets your expectations after a period of observation, you can set the scaling mode to auto and let AHPA manage the scaling.
Related documents
To use GPU metrics from Managed Service for Prometheus for AHPA predictive scaling, see Configure AHPA predictive scaling based on GPU metrics.
To view the monitoring dashboards provided by Managed Service for Prometheus, see Enable the Prometheus dashboard for AHPA.