When someone accesses a container — through kubectl exec or a direct shell session — any commands they run inside are invisible to standard perimeter defenses. A compromised container can download malware, exfiltrate data, or escalate privileges without triggering network-level alerts. The intra-container operation audit feature records every command executed inside a container after access, giving you concrete audit events you can query, alert on, and act on before a local incident becomes a cluster-wide breach.
This topic explains how to enable the feature, view audit reports and detailed logs, set up real-time alerts, and cleanly disable the feature when it is no longer needed.
This is a whitelist feature. Submit a ticket to enable access before proceeding.
Billing
The intra-container operation audit feature itself is free. After you enable it, you are charged for using Simple Log Service (SLS) features. For pricing details, see Billing overview.
Limits
Cluster types: ACK Managed Cluster Pro Edition, ACK Managed Cluster Basic Edition, and ACK Dedicated Cluster.
Operating system and kernel: Alibaba Cloud Linux, Ubuntu, or ContainerOS with a kernel version later than 4.19.
| OS | Minimum cluster version | Additional requirements |
|---|---|---|
| Alibaba Cloud Linux | 1.18 | — |
| ContainerOS | 1.24 | — |
| Ubuntu | 1.30 (see Manually upgrade a cluster) | Automatic OS upgrades must be disabled during node initialization. The /etc/resolv.conf symlink must point to /run/systemd/resolve/stub-resolv.conf, and DNS must be configured by DHCP. Cloud Parallel File System (CPFS) persistent volumes (PVs), image acceleration plugins, and security hardening are not supported. |
Step 1: Enable the feature
Enabling the intra-container operation audit feature installs two components:
Log collection component — collects audit logs, sends them to Simple Log Service, and creates a default audit report. See Log collection component.
ack-advanced-audit component — audits operations within containers.
A Logstore named advaudit-${cluster_id} is created automatically in the log project used by the log collection component. Audit logs are stored there with a default retention period of 180 days. To adjust the retention period, see Manage a Logstore.
To enable the feature:
Log in to the ACK console and click Clusters in the left navigation pane.
Click the name of your cluster. In the left navigation pane, choose Security > Audit.
On the Audit page, click the Container Audit tab and then click Install.
Step 2: View audit reports
On the Audit page, click the Container Audit tab and then click the Container Audit Overview tab.
The overview report shows:
Pod access frequency and related pod details.
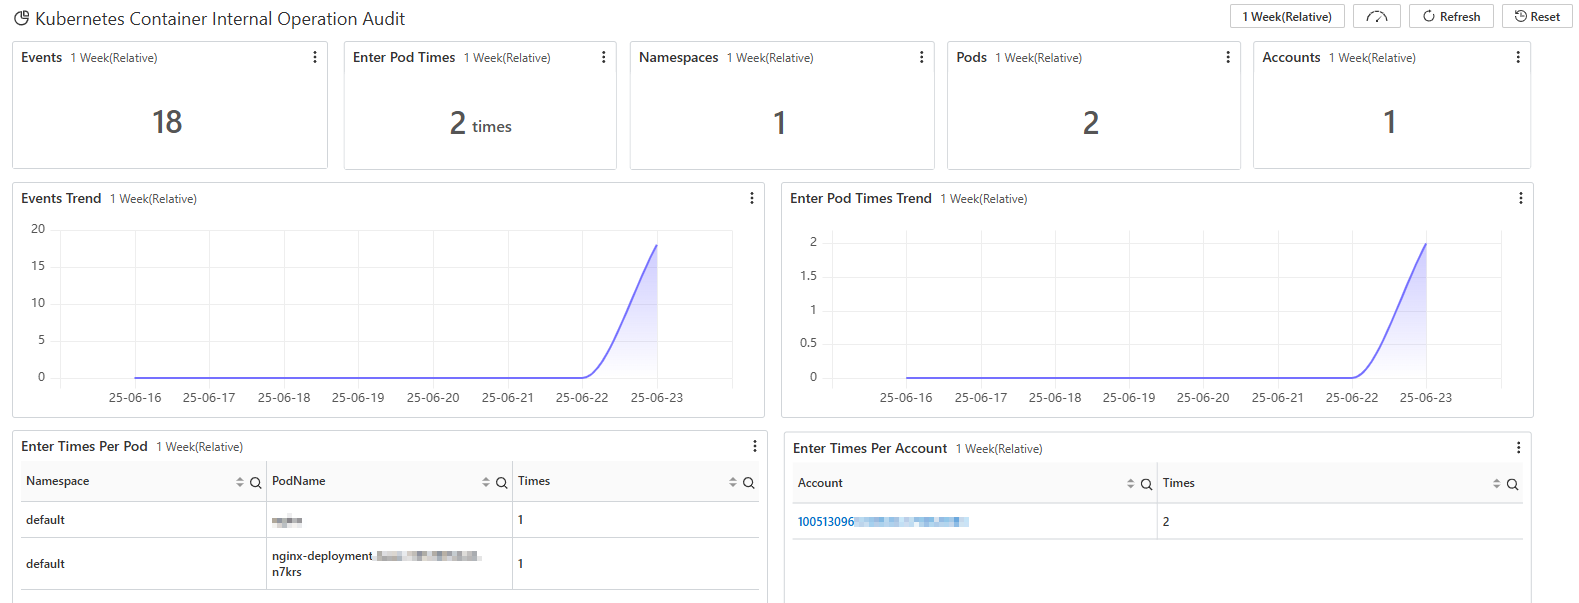
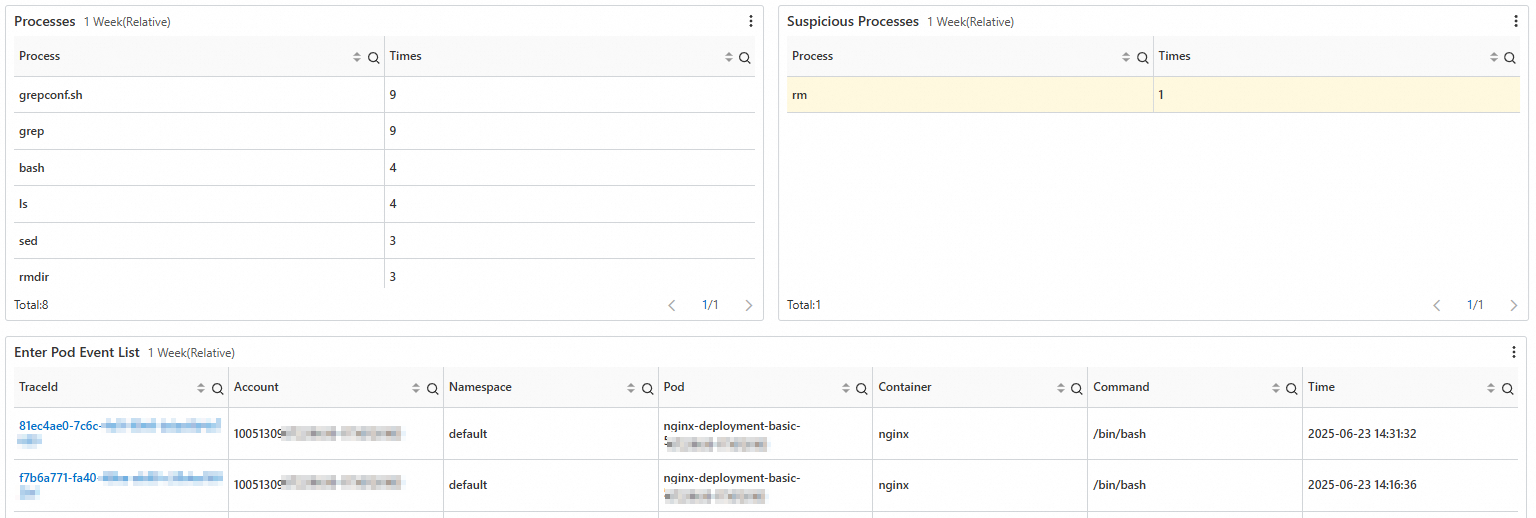
Kubernetes accounts that performed operations, commands run after container access, and a list of common important threats.
Step 3: View detailed log records
Two methods are available depending on your goal:
| Method | Best for |
|---|---|
| Audit report page | Quickly reviewing a recent individual event |
| Logstore page with search statements | Historical queries and complex filters |
View logs from the audit report page
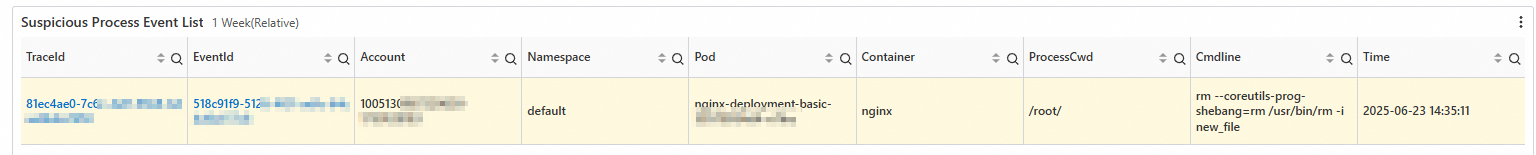
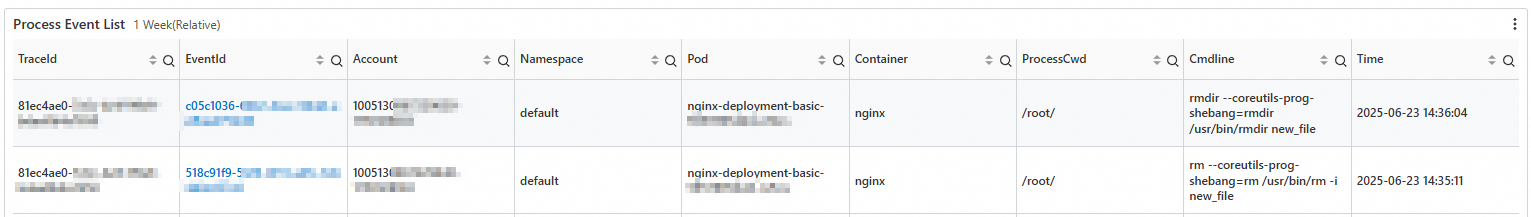
On the Container Audit Overview tab, scroll to the Suspicious Process Event List section. Click a link in the traceId or eventId column:
traceId — shows all commands run after a container was accessed.
eventId — shows the details of one specific command.
View logs from the Logstore page
Log in to the ACK console and click Clusters in the left navigation pane.
Click your cluster name. In the left navigation pane, choose Security > Audit.
On the Audit page, click the Container Audit tab and then click the Query Container Audit Logs tab.
Enter a search statement in the search box. Query by pod — replace
<namespace>and<pod_name>with actual values:Category Field Description Pod k8s.pod.namespaceNamespace of the pod Pod k8s.pod.nameName of the pod Process process.nameName of the process that was executed * and k8s.pod.namespace: <namespace> and k8s.pod.name: <pod_name>Query by process name — replace
<name>with the program name:* and process.name: <name>The following table lists the key log fields available for queries: For a full list of supported query and analysis methods, see Log search and analysis.
Set a time range and click Search & Analyze.
(Optional) Step 4: Configure alerts
Use the Simple Log Service alerting feature to monitor key container operations in real time. Supported alert channels include DingTalk robots, custom webhooks, and the Notification Center.
For configuration details, see Alerting.
Disable the feature
Uninstalling the ack-advanced-audit component disables the feature.
Disabling the feature does not delete the advaudit-${cluster_id} Logstore. If you leave it in place, SLS storage charges continue to accrue. To stop billing, log in to the Simple Log Service console and manually delete the Logstore. See Stop billing for or delete a Logstore.
To uninstall the component:
Log in to the ACK console and click Clusters in the left navigation pane.
Click your cluster name. In the left navigation pane, click Add-ons.
On the Add-ons page, find the ack-advanced-audit component, click Uninstall in the lower-right corner of the component card, and follow the on-screen instructions.
What's next
For ack-advanced-audit release notes and component details, see ack-advanced-audit.
To audit API Server operations (who did what to which resource and when), see Use the cluster API Server audit feature.