Prometheus是一款面向云原生应用程序的监控工具,本文介绍如何在阿里云Kubernetes上部署Prometheus。
背景信息
本文将讨论在Kubernetes集群中如何高效地监控系统组件和资源实体。监控对象可分为以下两类:
资源监控:涉及节点和应用的资源使用情况。在Kubernetes环境中,这包括节点的资源利用率、集群的资源利用率及Pod的资源利用率等。
应用监控:应用内部指标的监控,例如实时统计应用的在线人数,并通过端口暴露来实现应用业务级别的监控与告警等。
监控对象具体为:
系统组件:包括Kubernetes集群内置的组件,如API Server、cloud-controller-manager、etcd等。可通过在配置文件中进行设置来实现对这些组件的监控。
静态资源实体:如节点的资源状态和内核事件等,其监控可在配置文件中指明。
动态资源实体:例如Deployment、DaemonSet、Pod等,是Kubernetes中抽象的工作负载实体。为了监控这些实体,可以采用Prometheus监控部署方案。
自定义应用:针对需要定制化监控的数据和指标的应用情况,需具体设置以满足独特的监控需求,通过端口暴露和Prometheus监控方案相结合的方式实现。
步骤一:部署开源Prometheus监控
登录容器服务管理控制台,在左侧导航栏选择集群列表。
在集群列表页面,单击目标集群名称,然后在左侧导航栏,选择。
在Helm页面,单击创建,在Chart区域搜索并选中ack-prometheus-operator,其他设置保持默认,然后单击下一步。
组件默认安装在monitoring命名空间,并以组件名称发布应用。
如需自定义应用名和命名空间,请根据页面提示设置。
在参数配置页面中,选择Chart版本为12.0.0,并设置相应参数,然后单击确定。
12.0.0版本支持报警配置,您可以通过内置功能设定监控告警条件。
您根据实际需求自定义以下可选参数:
告警配置:支持钉钉告警和邮件告警。
Prometheus挂载自定义ConfigMap:支持配置个性化需求。
将Dashboard文件挂载到Grafana:支持自定义仪表盘增强数据可视化。
安装后,可在Helm页面的Helm Chart列表中查看组件的安装状态。
步骤二:查看Prometheus采集任务
登录容器服务管理控制台,在左侧导航栏选择集群列表。
在集群列表页面,单击目标集群名称,然后在左侧导航栏,选择。
在服务页面选择ack-prometheus-operator部署的命名空间(默认为monitoring),单击ack-prometheus-operator-prometheus操作列下的更新。
在对话框中,选择负载均衡(LoadBalancer)作为服务类型。选择新建资源,将访问方式配置为公网访问;计费方式配置为按量计费(PayByCLCU),按照页面提示提交配置的修改。
关于CLB的计费说明,请参见CLB计费概述。
更新完成后,复制其外部IP地址,然后在浏览器中通过
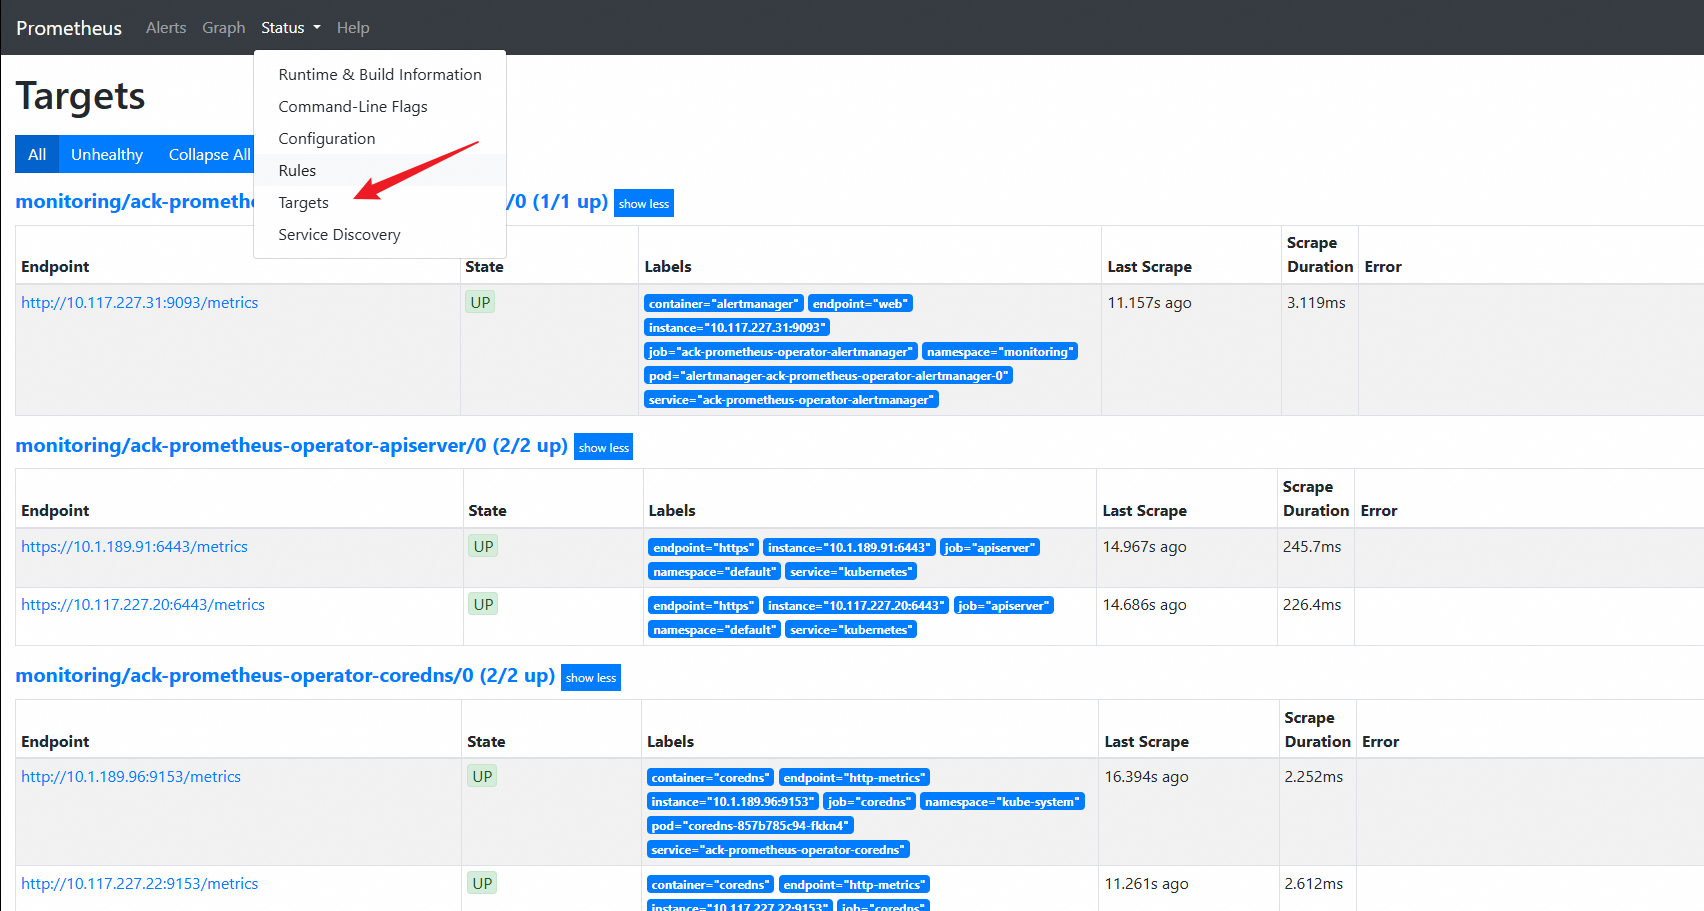
IP地址:端口号(如47.XX.XX.12:9090)访问Prometheus。在Prometheus页面,选择菜单栏,查看所有采集任务。
如果所有任务的状态为UP,表明所有采集任务均已正常运行。
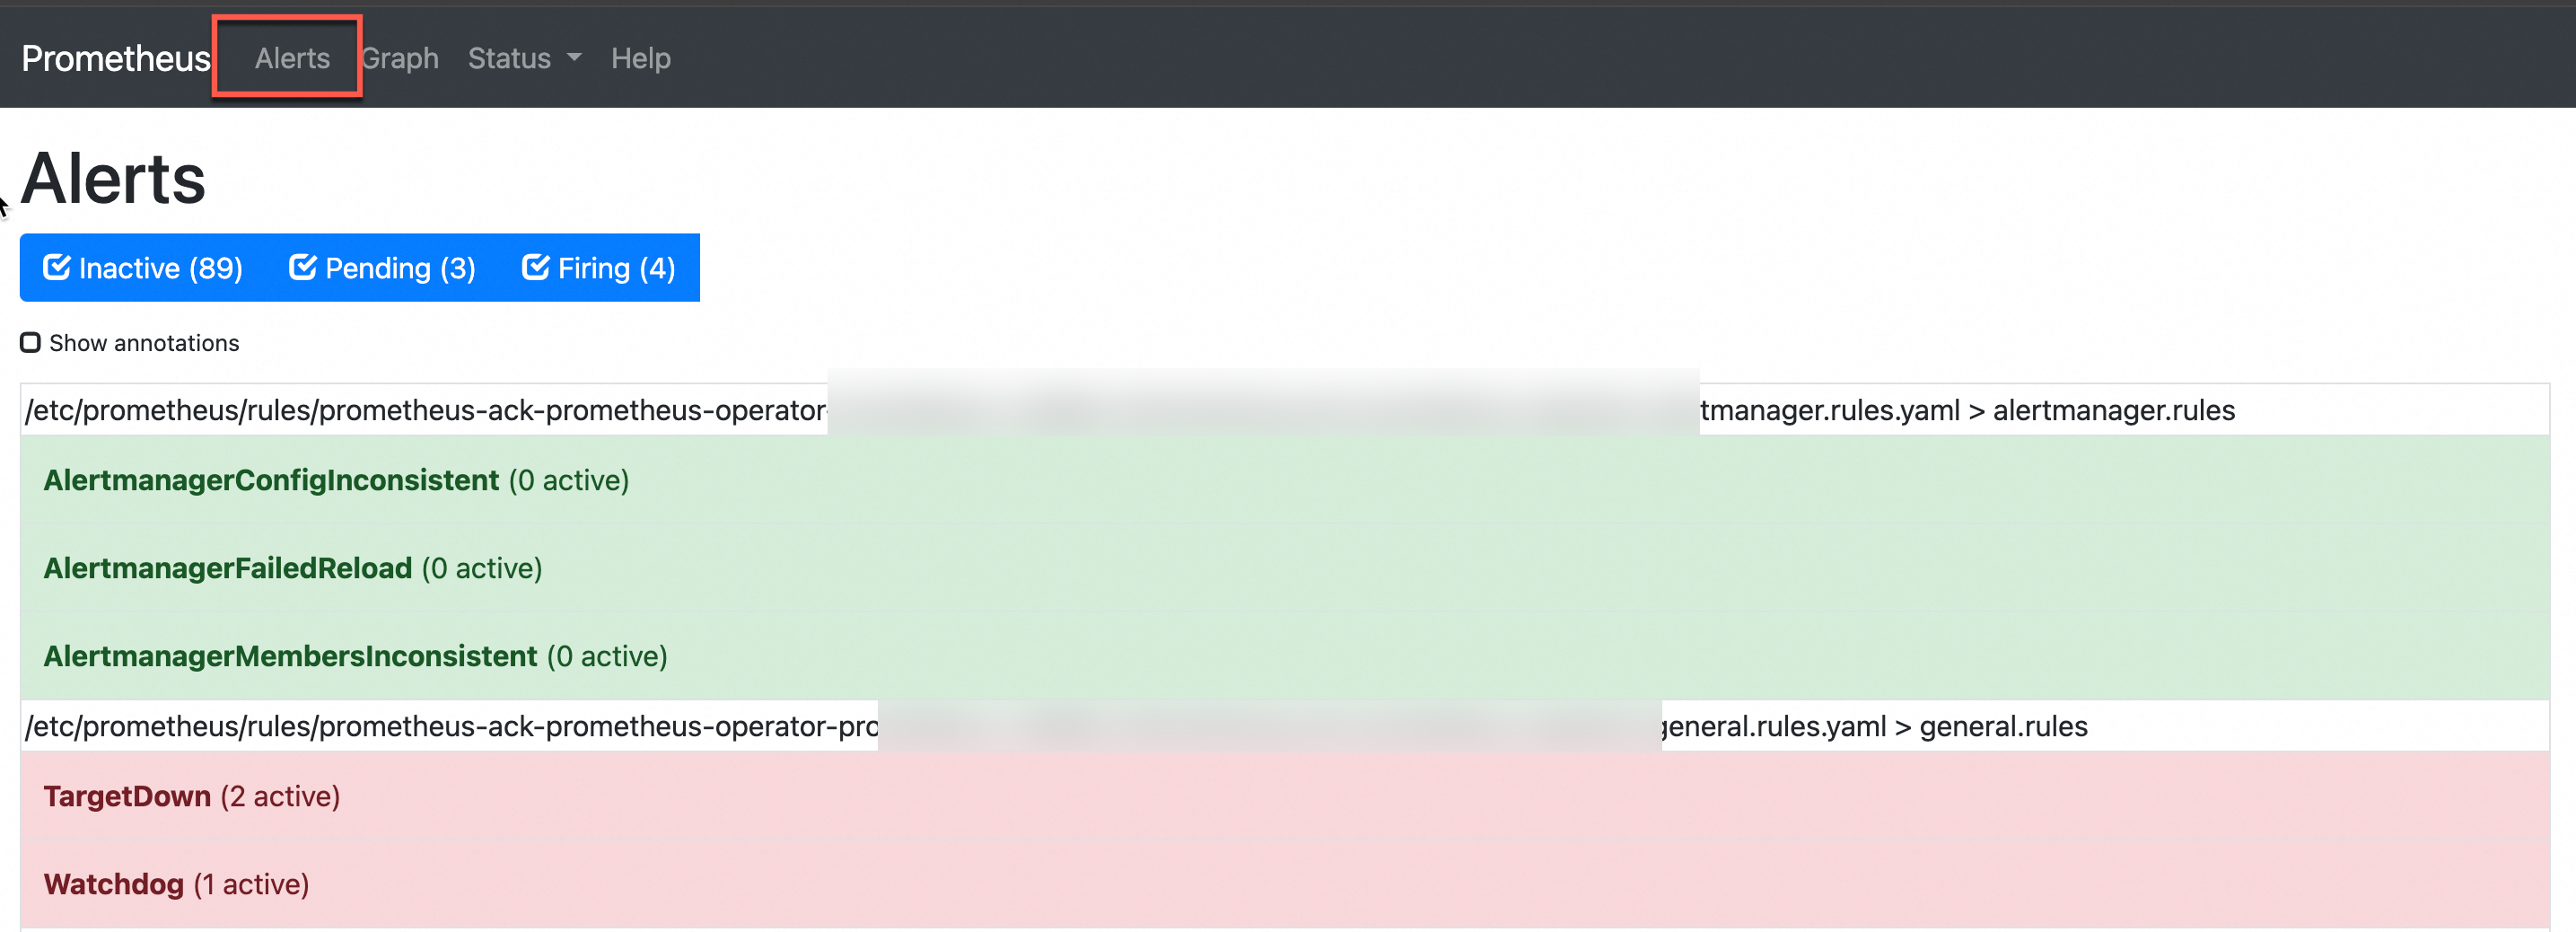
在菜单栏单击Alerts,查看当前的告警规则。
步骤三:查看Grafana数据聚合
登录容器服务管理控制台,在左侧导航栏选择集群列表。
在集群列表页面,单击目标集群名称,然后在左侧导航栏,选择。
在服务页面选择ack-prometheus-operator部署的命名空间(默认为monitoring),单击名称为ack-prometheus-operator-grafana的操作列下的更新。
在对话框中,选择负载均衡(LoadBalancer)作为服务类型。选择新建资源,将访问方式配置为公网访问,计费方式配置为按量计费(PayByCLCU),按照页面提示提交配置的修改。
关于CLB的计费说明,请参见CLB计费概述。
更新完成后,复制其外部IP地址,然后在浏览器中通过
IP地址:端口号(端口号默认为80,如47.XX.XX.12:80)访问Grafana,按照页面提示查看大盘。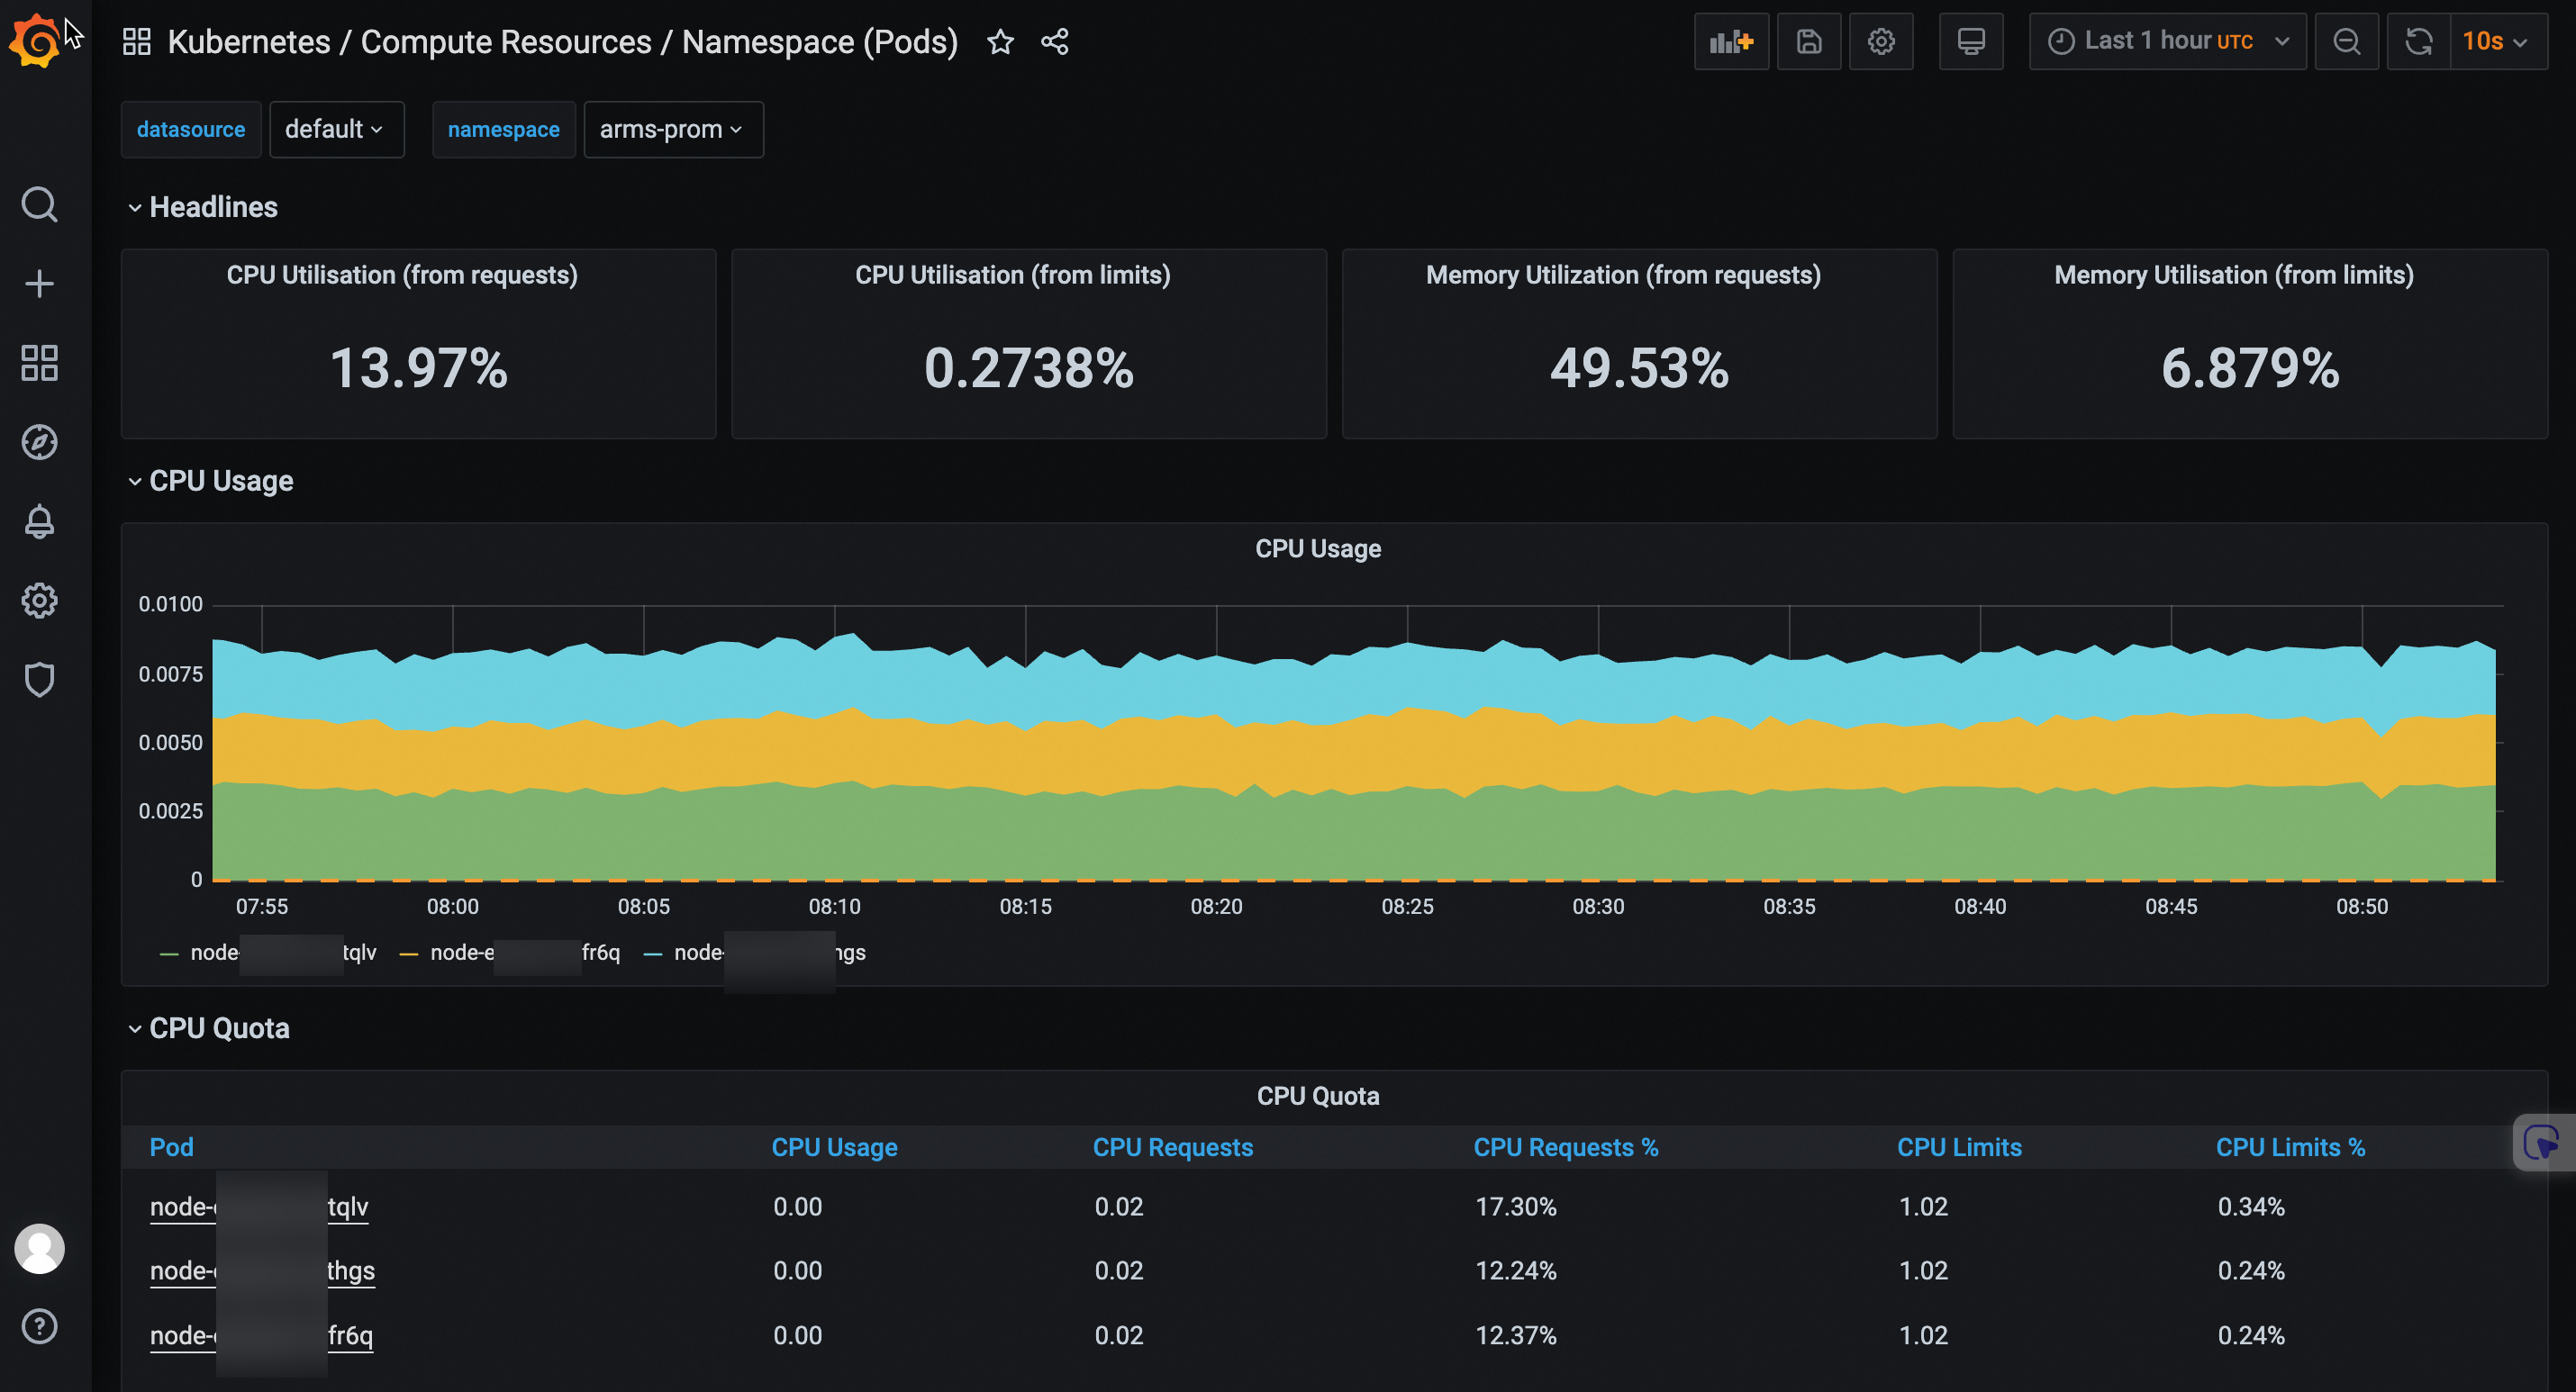
告警配置
ack-prometheus-operator支持钉钉告警和邮件告警。配置入口如下。
登录容器服务管理控制台,在左侧导航栏选择集群列表。
在集群列表页面,单击目标集群名称,然后在左侧导航栏,选择。
单击创建,定位ack-prometheus-operator,按照页面提示进入下一步,在参数配置页面选择Chart 版本后,在参数区域参见下文进行配置。
如果您已经安装了ack-prometheus-operator,也可以在Helm Chart列表单击组件名称,然后单击参数配置进行配置。流程类似。
配置钉钉告警
在配置文件中找到
dingtalk字段,将enabled设置为true。在
token字段中填入钉钉的Webhook地址。获取Webhook地址请参见使用钉钉机器人:使用钉钉机器人实现Kubernetes监控告警。
在
alertmanager的config字段下的receiver配置中,填写您在receivers中定义的钉钉告警名称(默认为webhook)。例如您有两个钉钉机器人,操作示例如下:
替换钉钉的
token配置在钉钉机器人中,将Webhook地址分别替换为dingtalk1和dingtalk2的地址,即使用Webhook地址替换下图中的
https://oapi.dingtalk.com/robot/send?access_token=xxxxxxxxxx。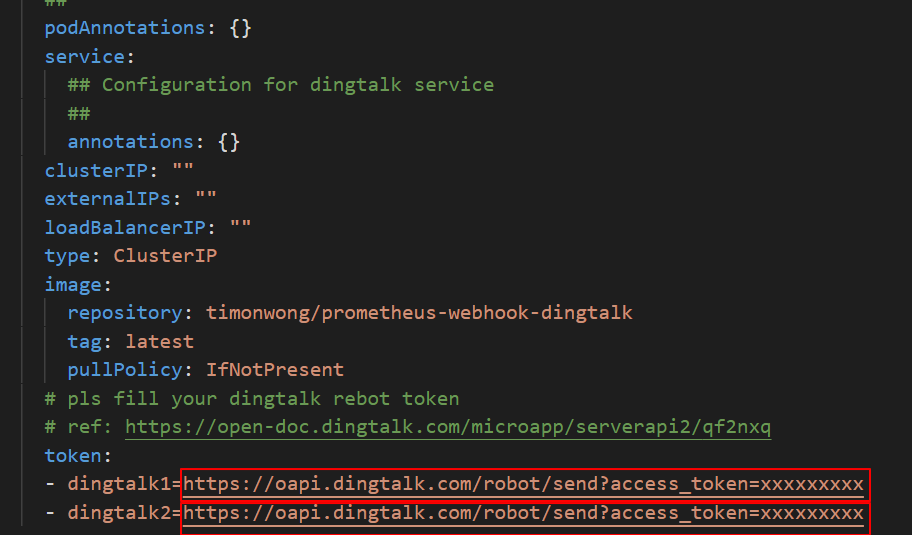
修改
receiversalertmanager的config字段中找到receiver,填写您receivers中对应的钉钉告警名称。本示例中分别为webhook1和webhook2。修改URL的值
将URL中的值替换成实际的dingtalk的值,本例中为
dingtalk1和dingtalk2。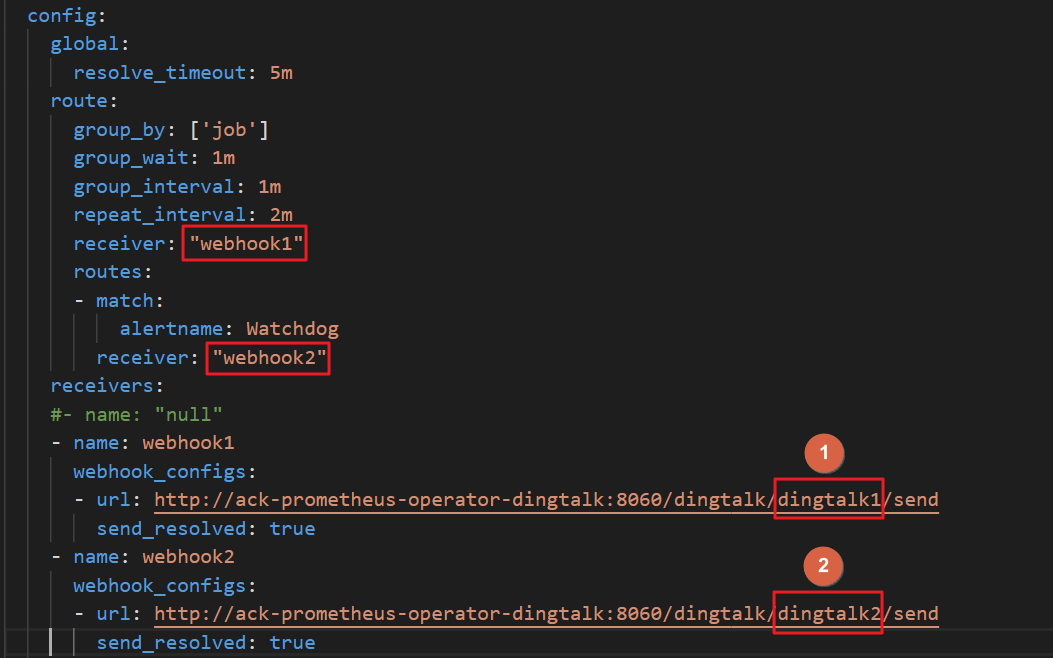
说明如需添加多个钉钉机器人,请将前面的Webhook依次递增。
配置邮件告警
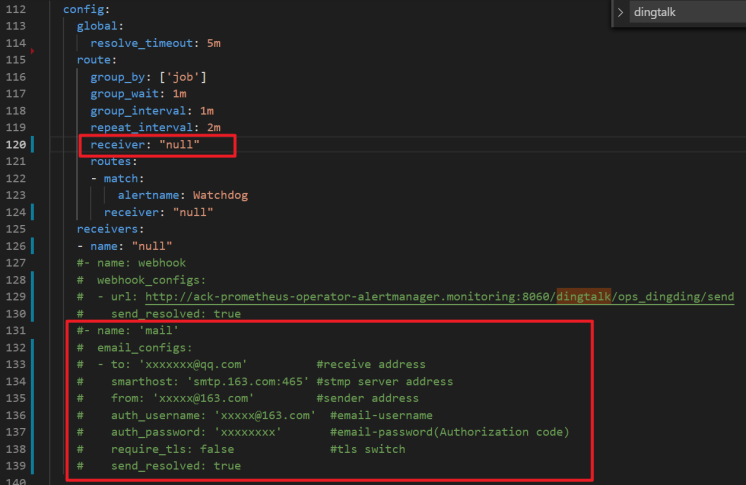
在关于邮件信息的红色选框内,补充完整的邮件信息。
在配置文件的
alertmanager部分中找到config字段,定位到receiver并填写您在receivers中定义的邮件告警名称(默认是mail)。
设置告警接收模板
您可以在alertmanager的templateFiles中自定义告警模板。示例如下。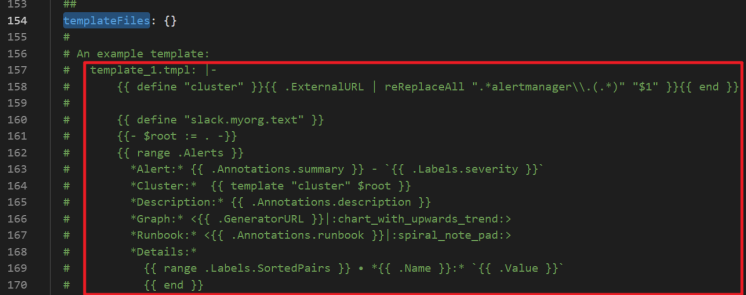
Prometheus挂载自定义ConfigMap
以下展示如何在 Prometheus 中通过名为 special-config 的 ConfigMap 挂载配置文件,并在 Pod 启动时将其指定为 --config.file 参数。
创建ConfigMap。

挂载ConfigMap。
在参数配置页面,在
configmaps字段中添加以下内容,将指定的 ConfigMap 挂载到 Prometheus Pod 的/etc/prometheus/configmaps/路径下。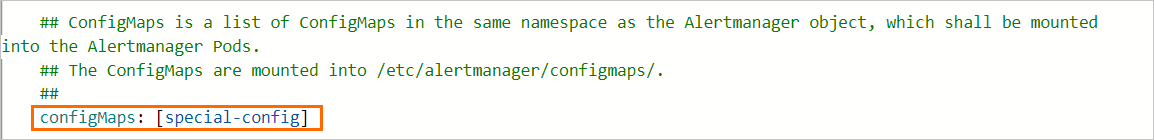
prometheus的configmaps字段配置示例如下。
Grafana配置
将Dashboard文件挂载到Grafana
如需将Dashboard文件以ConfigMap的方式挂载到Grafana Pod中,您可以在参数配置向导中,定位extraConfigmapMounts字段。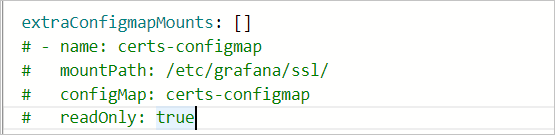 需确保:
需确保:
Dashboard以ConfigMap的形式存在于集群中,且ConfigMap的Labels与其他ConfigMap格式保持一致。
在Grafana的
extraConfigmapMounts字段中填入Dashboard的ConfigMap信息和挂载信息。mountPath:配置为/tmp/dashboards/。ConfigMap:自定义的ConfigMap的名称。name:Dashboard的JSON名称。
实现Dashboard持久化
如需Dashboard导出到本地,您可将需要保存的Dashboard导出为JSON文件,将其保存到本地。更多信息,请参见Grafana导出。
登录容器服务管理控制台,在左侧导航栏单击集群列表。
在集群列表页面,单击目标集群名称,然后在左侧导航栏,选择。
定位ack-prometheus-operator,单击右侧的更新。在
grafana字段的persistence选项中,按照下图完成配置。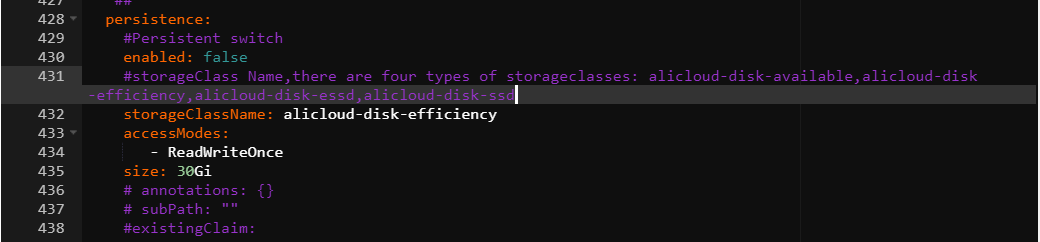
相关操作
卸载开源Prometheus
请根据Helm Chart版本参见以下流程卸载开源Prometheus,以避免资源残留,继而产生非预期行为。需要手动清理的资源包括相关的Helm Release、命名空间、CRD和kubelet Service资源。
卸载ack-prometheus-operator但无法自动删除关联的kubelet Service是社区已知问题,需参见下文手动卸载。问题详细描述,请参见#1523。
Chart v12.0.0
控制台
登录容器服务管理控制台,在左侧导航栏选择集群列表。
在集群列表页面,单击目标集群名称,然后在左侧导航栏选择不同界面,完成对应操作。
卸载Helm Release:选择,在Helm Release列表的操作列,定位到ack-prometheus-operator对应的删除,按照页面提示完成删除并清除发布记录。
删除命名空间:单击命名空间与配额,在命名空间列表,定位并勾选monitoring,按照页面提示完成删除。
删除CRD:选择,单击资源定义(CustomResourceDefinition)页签,按照页面提示定位并删除
monitoring.coreos.comAPI组下的所有CRD资源,包括:AlertmanagerConfig
Alertmanager
PodMonitor
Probe
Prometheus
PrometheusRule
ServiceMonitor
ThanosRuler
删除kubelet Service:选择网络 > 服务,按照页面提示,在kube-system命名空间下定位并删除ack-prometheus-operator-kubelet。
kubectl
卸载Helm release
helm uninstall ack-prometheus-operator -n monitoring删除命名空间
kubectl delete namespace monitoring删除CRD
kubectl delete crd alertmanagerconfigs.monitoring.coreos.com
kubectl delete crd alertmanagers.monitoring.coreos.com
kubectl delete crd podmonitors.monitoring.coreos.com
kubectl delete crd probes.monitoring.coreos.com
kubectl delete crd prometheuses.monitoring.coreos.com
kubectl delete crd prometheusrules.monitoring.coreos.com
kubectl delete crd servicemonitors.monitoring.coreos.com
kubectl delete crd thanosrulers.monitoring.coreos.com
删除kubelet Service
kubectl delete service ack-prometheus-operator-kubelet -n kube-system
Chart v65.1.1
控制台
登录容器服务管理控制台,在左侧导航栏选择集群列表。
在集群列表页面,单击目标集群名称,然后在左侧导航栏选择不同界面,完成对应操作。
卸载Helm Release:选择,在Helm Release列表的操作列,定位ack-prometheus-operator对应的删除,按照页面提示完成删除并清除发布记录。
删除命名空间:单击命名空间与配额,在命名空间列表,定位并勾选monitoring,按照页面提示完成删除。
删除CRD:选择,单击资源定义(CustomResourceDefinition)页签,按照页面提示定位并删除
monitoring.coreos.comAPI组下的所有CRD资源,包括:AlertmanagerConfig
Alertmanager
PodMonitor
Probe
PrometheusAgent
Prometheus
PrometheusRule
ScrapeConfig
ServiceMonitor
ThanosRuler
删除kubelet Service:选择网络 > 服务,按照页面提示,在kube-system命名空间下定位并删除ack-prometheus-operator-kubelet。
kubectl
卸载Helm release
helm uninstall ack-prometheus-operator -n monitoring删除命名空间
kubectl delete namespace monitoring删除CRD
kubectl delete crd alertmanagerconfigs.monitoring.coreos.com
kubectl delete crd alertmanagers.monitoring.coreos.com
kubectl delete crd podmonitors.monitoring.coreos.com
kubectl delete crd probes.monitoring.coreos.com
kubectl delete crd prometheusagents.monitoring.coreos.com
kubectl delete crd prometheuses.monitoring.coreos.com
kubectl delete crd prometheusrules.monitoring.coreos.com
kubectl delete crd scrapeconfigs.monitoring.coreos.com
kubectl delete crd servicemonitors.monitoring.coreos.com
kubectl delete crd thanosrulers.monitoring.coreos.com
删除kubelet Service
kubectl delete service ack-prometheus-operator-kubelet -n kube-system
设置告警压制
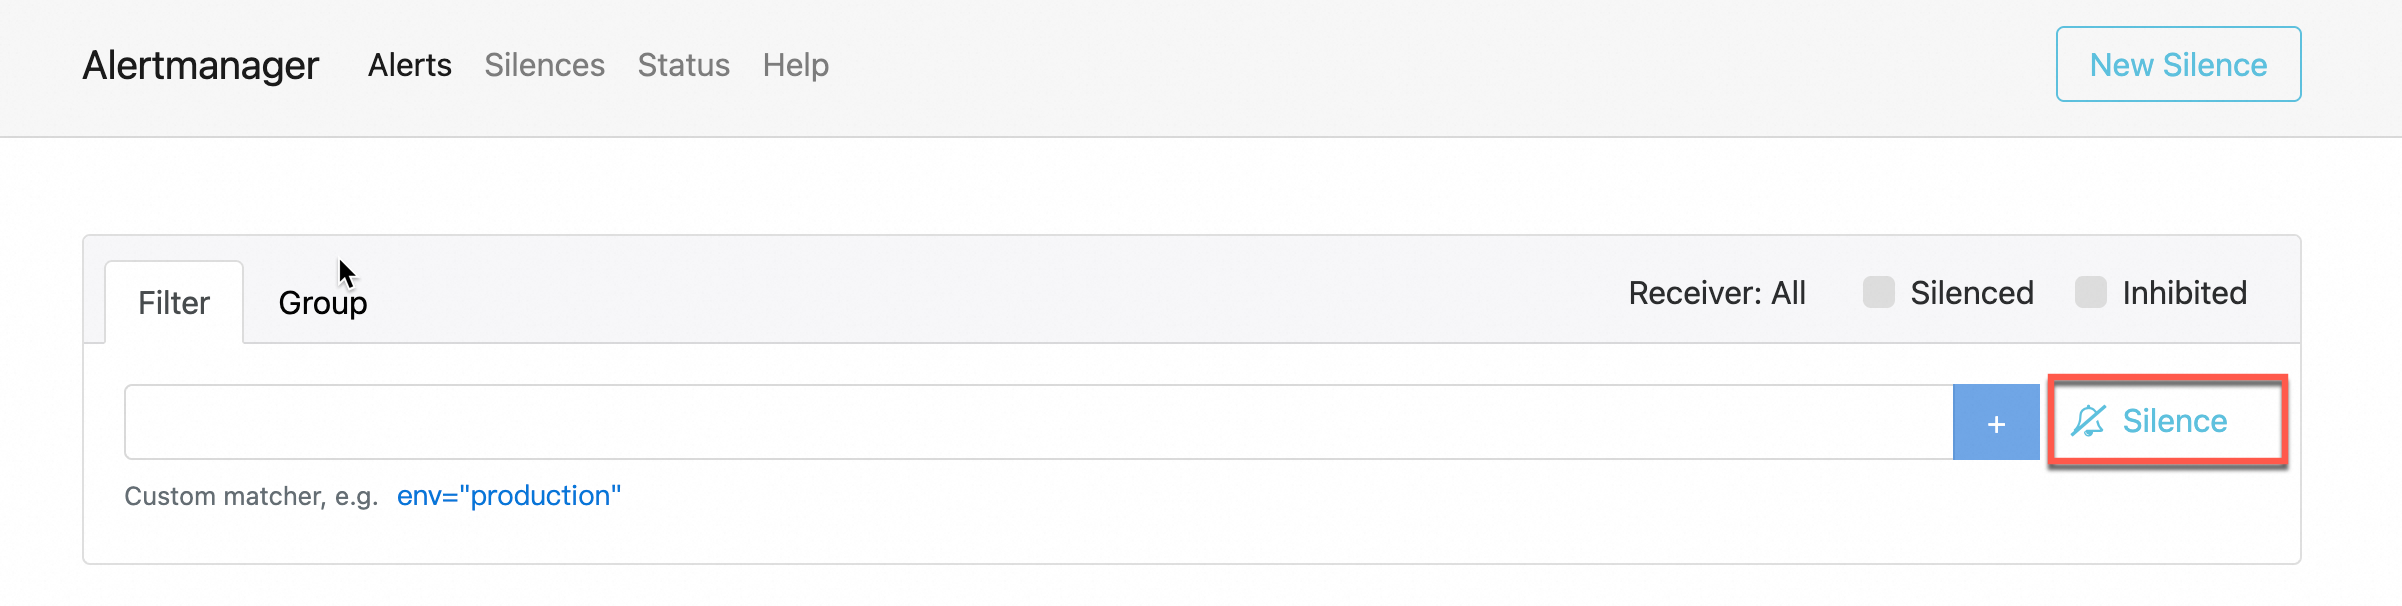
您可通过配置静默规则(Silence Rule) 特定告警进行压制。当告警与规则中的条件匹配时,对应告警不会发送通知或激活,直至压制时间结束或压制规则被手动删除。
执行以下命令,将 Alertmanager 暴露到本地 9093 端口,并允许外部访问。
kubectl --address 0.0.0.0 port-forward svc/alertmanager-operated 9093 -n monitoring将EIP绑定至ECS实例,然后在浏览器中使用
<EIP>:9093进行访问。访问测试时,请确保ECS实例安全组已放行您的本机IP和9093端口。具体操作,请参见添加安全组规则。
单击Silence,按照页面提示设置告警压制。
常见问题
钉钉配置后,没有收到告警
部署prometheus-operator时报错
报错信息如下
Can't install release with errors: rpc error: code = Unknown desc = object is being deleted: customresourcedefinitions.apiextensions.k8s.io "xxxxxxxx.monitoring.coreos.com" already exists在卸载prometheus-operator的时候没有将上一次部署的自定义资源(CRD)及时清理掉,执行如下命令,删除CRD并重新部署。
kubectl delete crd prometheuses.monitoring.coreos.com
kubectl delete crd prometheusrules.monitoring.coreos.com
kubectl delete crd servicemonitors.monitoring.coreos.com
kubectl delete crd alertmanagers.monitoring.coreos.com
邮件告警没有生效
邮件告警没有生效,有可能是因为smtp_auth_password填写的是您的登录密码,而非授权码。另外SMTP的服务器地址需要加端口号。
单击YAML更新时,出现当前集群暂时无法访问,请稍后重试或提交工单反馈
此问题原因是tiller的配置文件过大,导致的集群无法访问,您可以先将部分注释删除,再将配置文件以ConfigMap形式,挂载到pod中,目前prometheus-operator只支持prometheus和alertmanager pod的挂载,详情请参见Prometheus挂载自定义ConfigMap中的方法二。
部署prometheus-operator后,如何开启其中的功能
当部署好prometheus-operator后,如果要开启部分功能,在集群信息页面,选择,在ack-prometheus-operator右侧,单击更新,找到对应的开关,进行相应的设置,然后单击确定开启您想要的功能。
TSDB和阿里云云盘如何选择。
TSDB支持的地域比较少,而阿里云云盘是全域支持,数据回收策略请参见以下配置。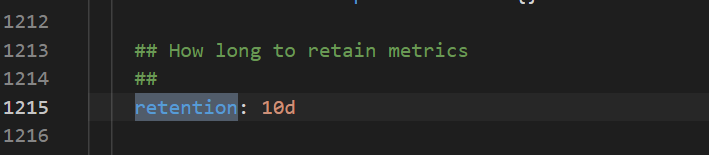
Grafana Dashboard显示有问题
在集群信息页面选择,在ack-prometheus-operator右侧,单击更新,查看clusterVersion的值是否为正确的集群版本。Kubernetes集群是1.16以前的版本,这里请填写1.14.8-aliyun.1,1.16及以后的版本,请填写1.16.6-aliyun.1。
删除ack-prometheus的命名空间后,重新安装ack-prometheus失败
只删除ack-prometheus的命名空间,会导致资源删除后有残留配置,影响再次安装。您可以执行以下操作,删除残余配置。
删除RBAC权限。
删除ClusterRole。
kubectl delete ClusterRole ack-prometheus-operator-grafana-clusterrole
kubectl delete ClusterRole ack-prometheus-operator-kube-state-metrics
kubectl delete ClusterRole psp-ack-prometheus-operator-kube-state-metrics
kubectl delete ClusterRole psp-ack-prometheus-operator-prometheus-node-exporter
kubectl delete ClusterRole ack-prometheus-operator-operator
kubectl delete ClusterRole ack-prometheus-operator-operator-psp
kubectl delete ClusterRole ack-prometheus-operator-prometheus
kubectl delete ClusterRole ack-prometheus-operator-prometheus-psp
删除ClusterRoleBinding。
kubectl delete ClusterRoleBinding ack-prometheus-operator-grafana-clusterrolebinding
kubectl delete ClusterRoleBinding ack-prometheus-operator-kube-state-metrics
kubectl delete ClusterRoleBinding psp-ack-prometheus-operator-kube-state-metrics
kubectl delete ClusterRoleBinding psp-ack-prometheus-operator-prometheus-node-exporter
kubectl delete ClusterRoleBinding ack-prometheus-operator-operator
kubectl delete ClusterRoleBinding ack-prometheus-operator-operator-psp
kubectl delete ClusterRoleBinding ack-prometheus-operator-prometheus
kubectl delete ClusterRoleBinding ack-prometheus-operator-prometheus-psp
删除CRD。
kubectl delete crd alertmanagerconfigs.monitoring.coreos.com
kubectl delete crd alertmanagers.monitoring.coreos.com
kubectl delete crd podmonitors.monitoring.coreos.com
kubectl delete crd probes.monitoring.coreos.com
kubectl delete crd prometheuses.monitoring.coreos.com
kubectl delete crd prometheusrules.monitoring.coreos.com
kubectl delete crd servicemonitors.monitoring.coreos.com
kubectl delete crd thanosrulers.monitoring.coreos.com