Quick BI provides drilling, filter interaction, and hyperlink features for multi-dimensional data analysis. This topic describes the usage scenarios and methods for drilling.
Scenarios
When you view company sales data, you can change the analysis granularity by drilling down. For example, you can drill down from a region to a province to view data by geographical dimension.
Limits
The following charts support the drilling feature:
Tables: cross tables, detail tables, multidimensional analysis tables, and heat maps.
Line/Area charts: line charts, area charts, stacked area charts, 100% stacked area charts, and combination charts.
Column/Bar charts: column charts, stacked column charts, 100% stacked column charts, circular bar charts, ranking boards, bar charts, stacked bar charts, 100% stacked bar charts, waterfall charts, bullet charts, and box plots.
Pie/Doughnut charts: pie charts, rose charts, radar charts, and treemap charts.
Bubble/Scatter charts: bubble charts and scatter charts.
Geo: colored maps, bubble maps, and symbol maps.
Other charts: word cloud charts.
Step 1: Edit the Dataset
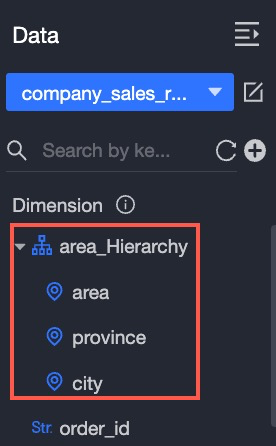
This example uses the area, province, and city fields. Ensure that these fields are converted to geographical information and added to the same hierarchy. Do the following:
Skip this step if the area, province, and city fields in the target dataset have already been converted to geographical information.
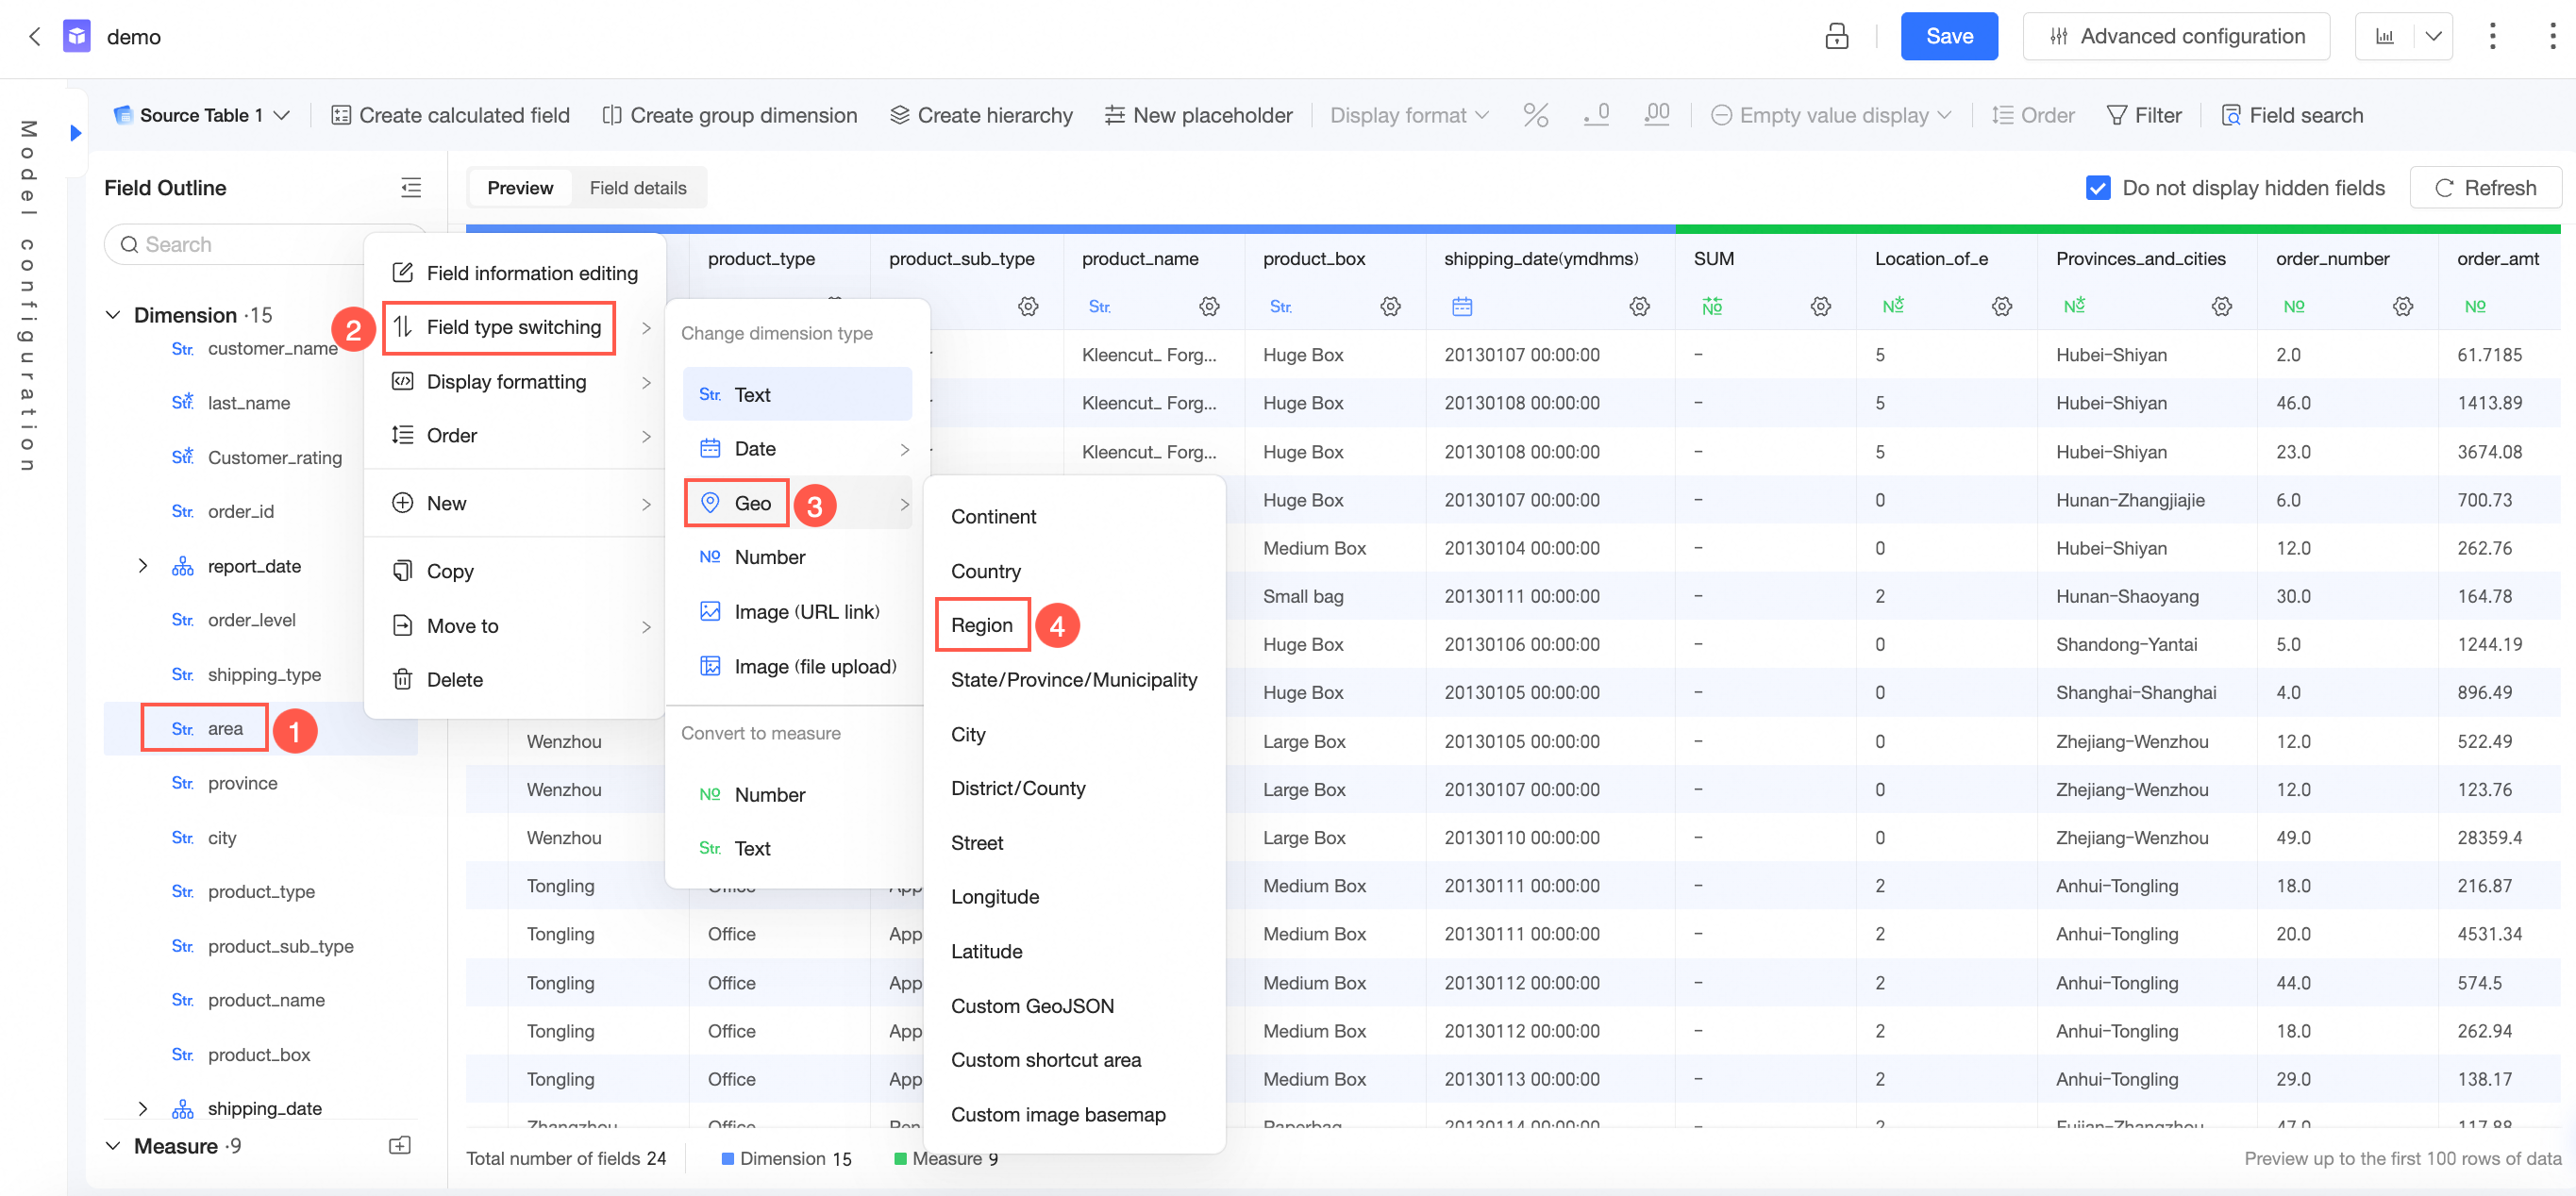
On the dataset editing page, in the field outline or data preview interface, hover over the target field, click the
 icon, and select Field Type Switch > Geo > Area.
This example uses the area field.
(Optional)
Create a hierarchy.
You can perform this operation if you have a hierarchical drilling structure.
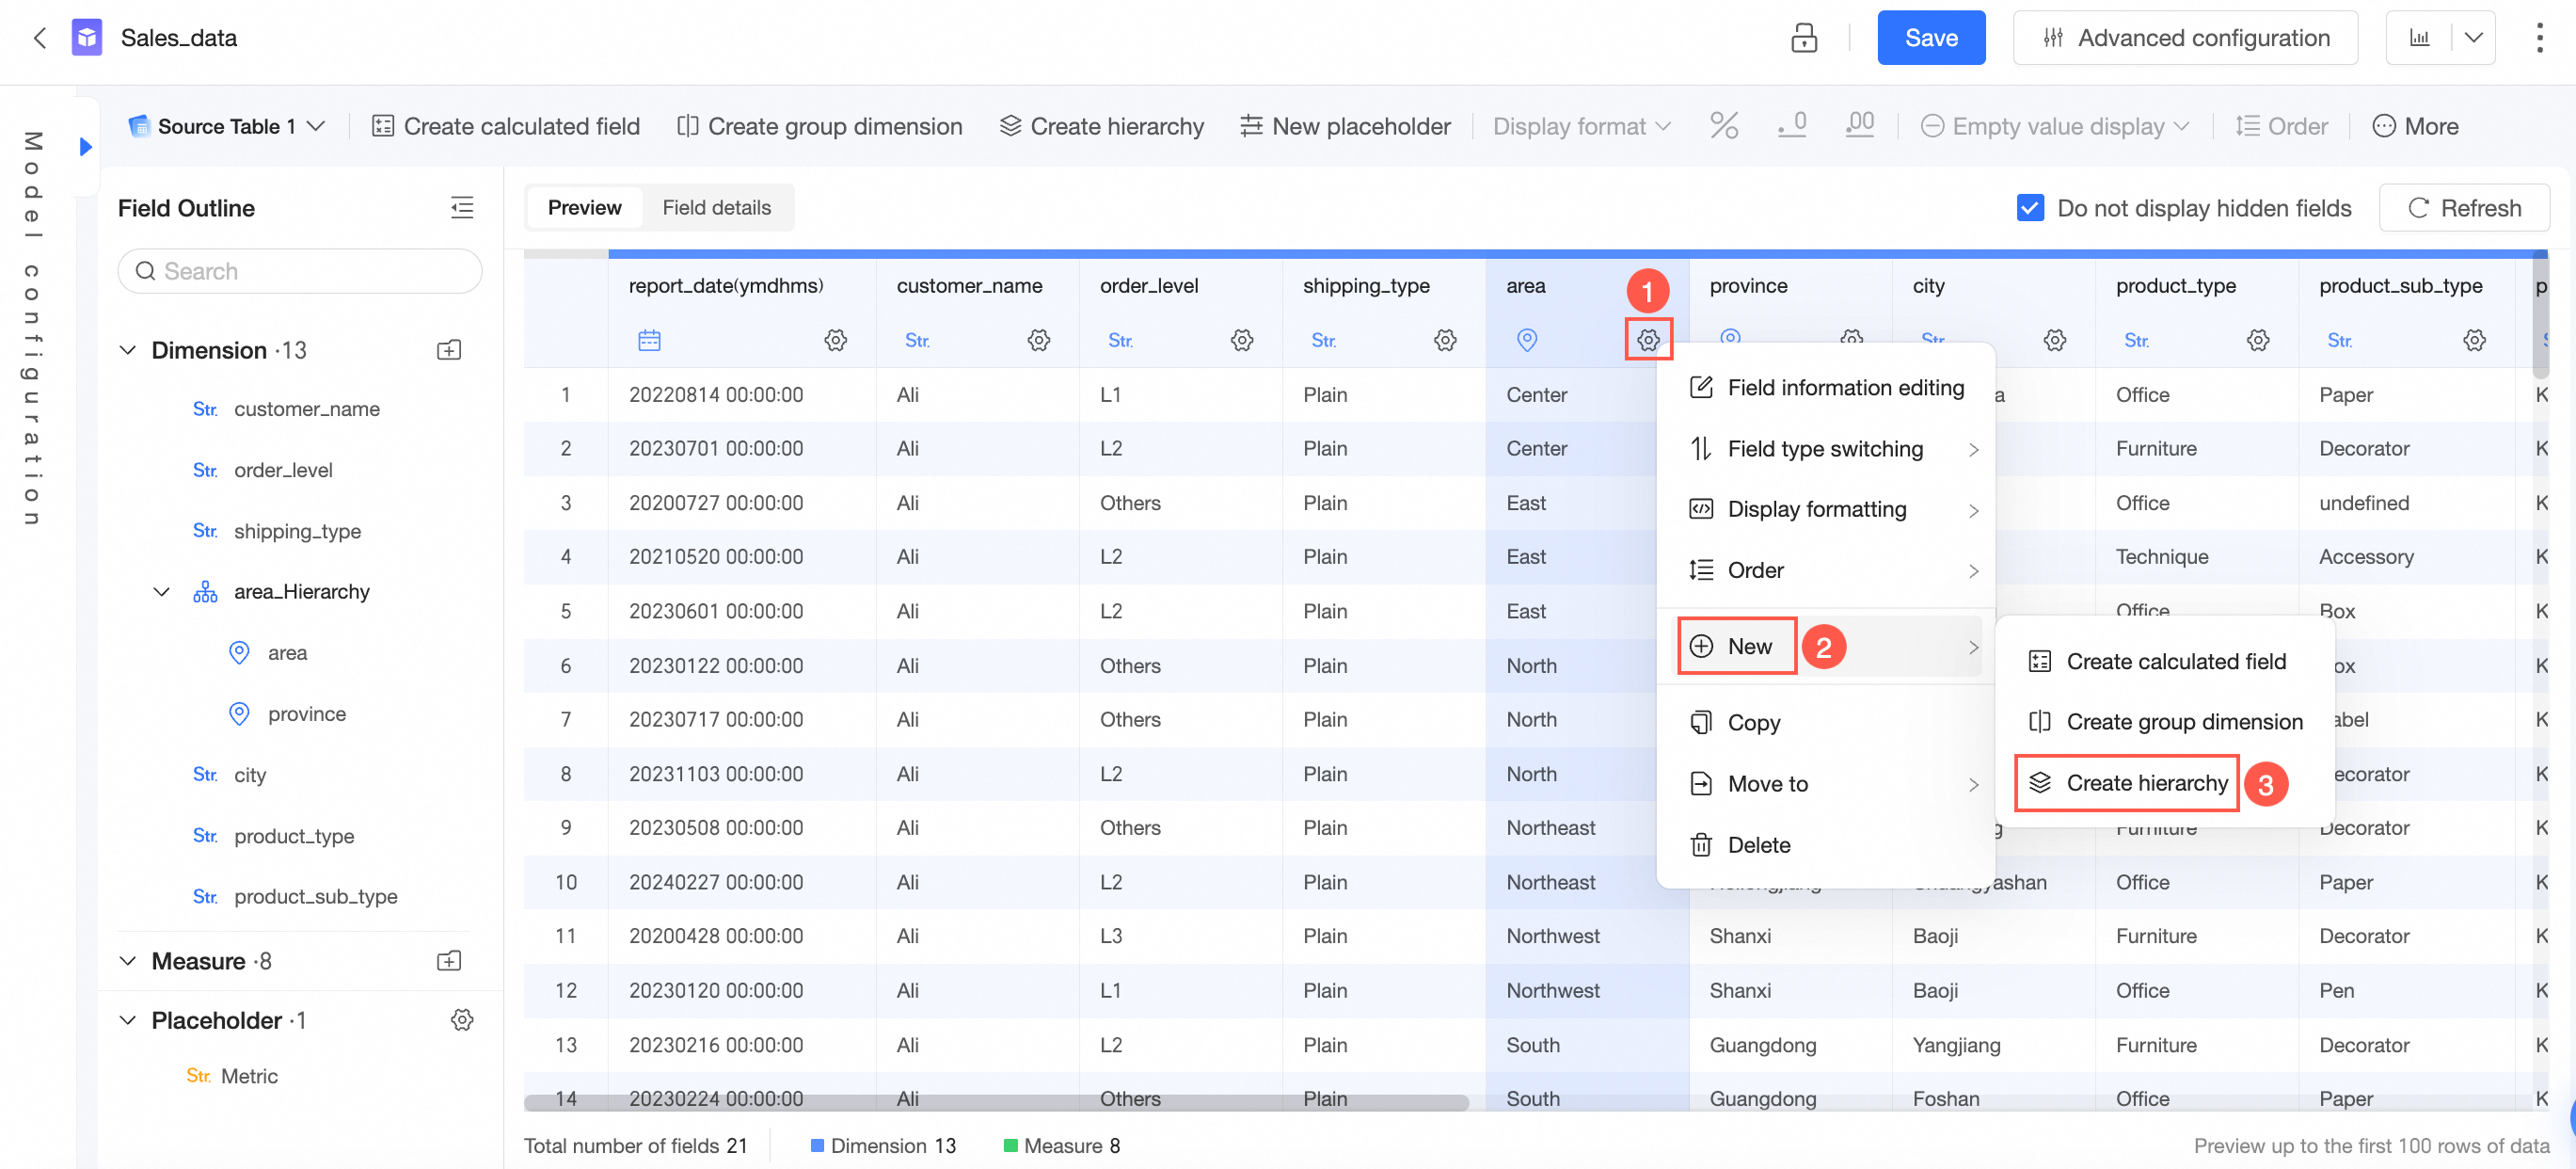
In the dimension list, locate the target geographical information field. As shown in the following figure, click Create Hierarchy.
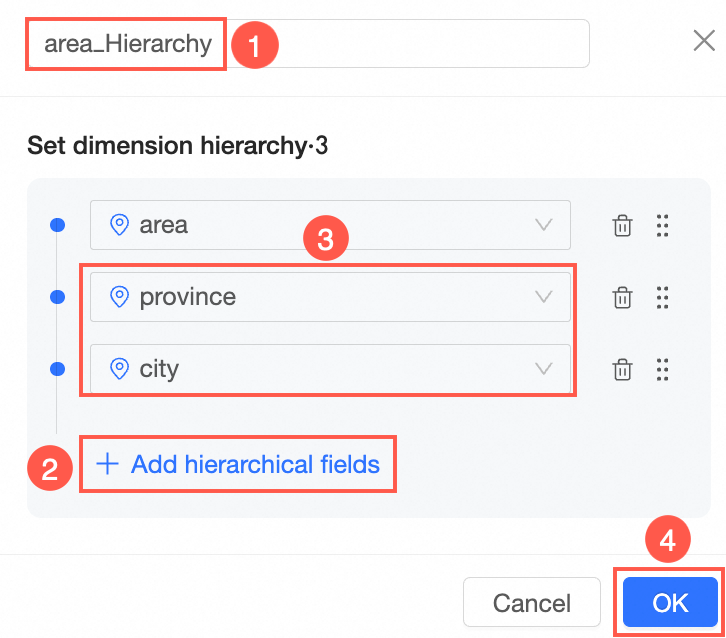
On the Create/Edit Hierarchy page, enter a name for the hierarchy, add the hierarchy fields, and then click OK.
 Alternatively, you can click the icon next to the target field, select Move To Area_hierarchy, and then move the other geographic information dimension fields into this hierarchy.
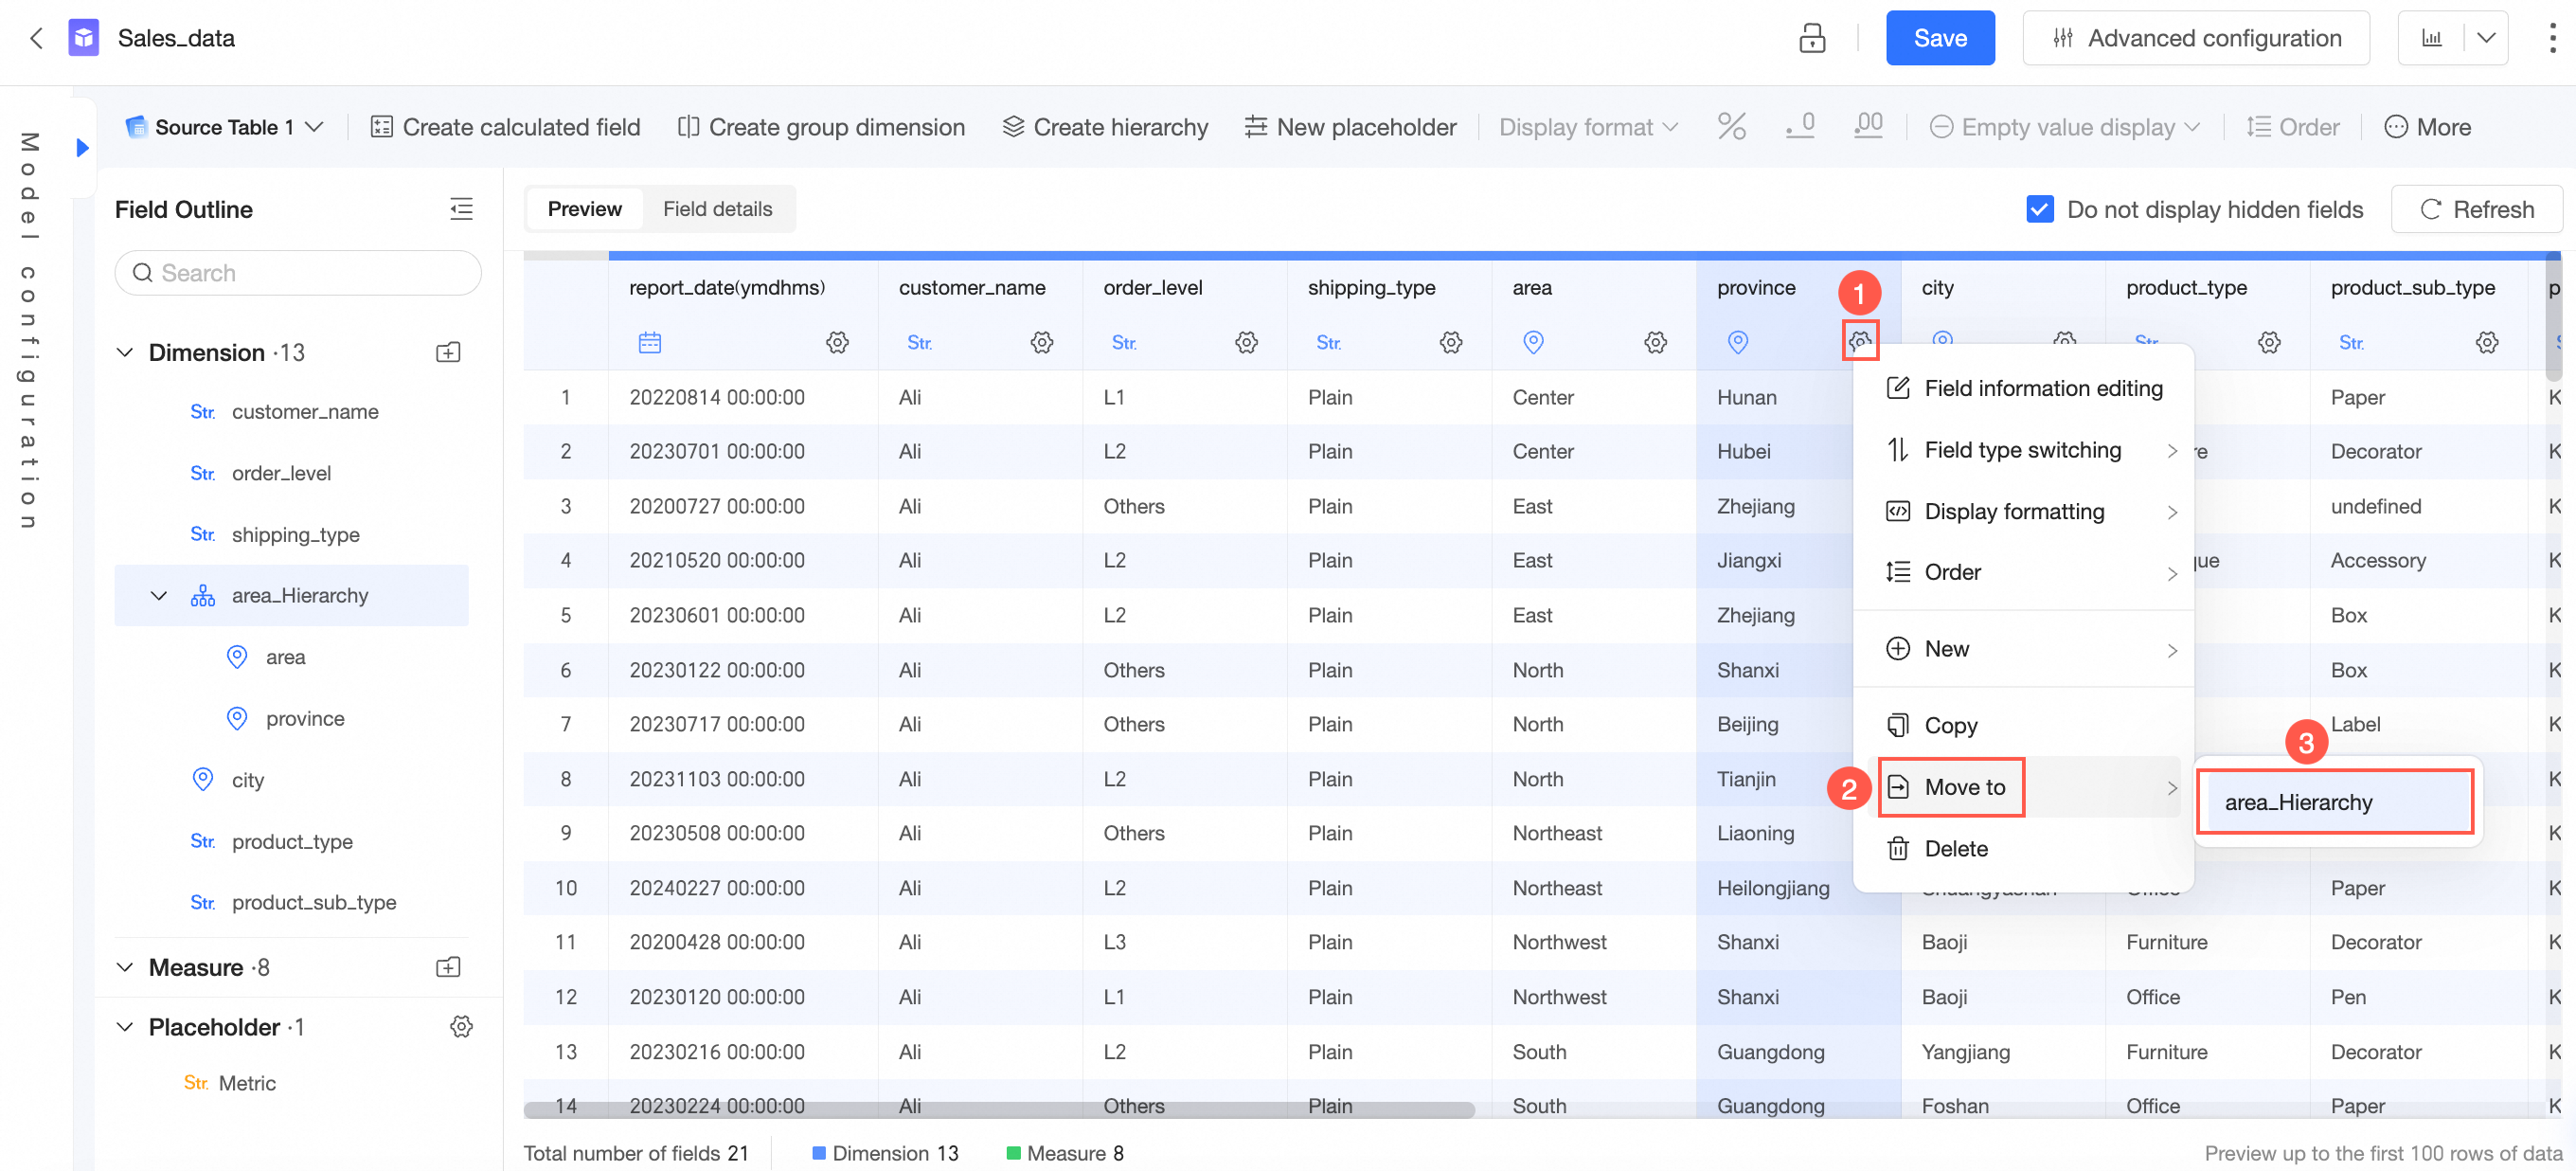
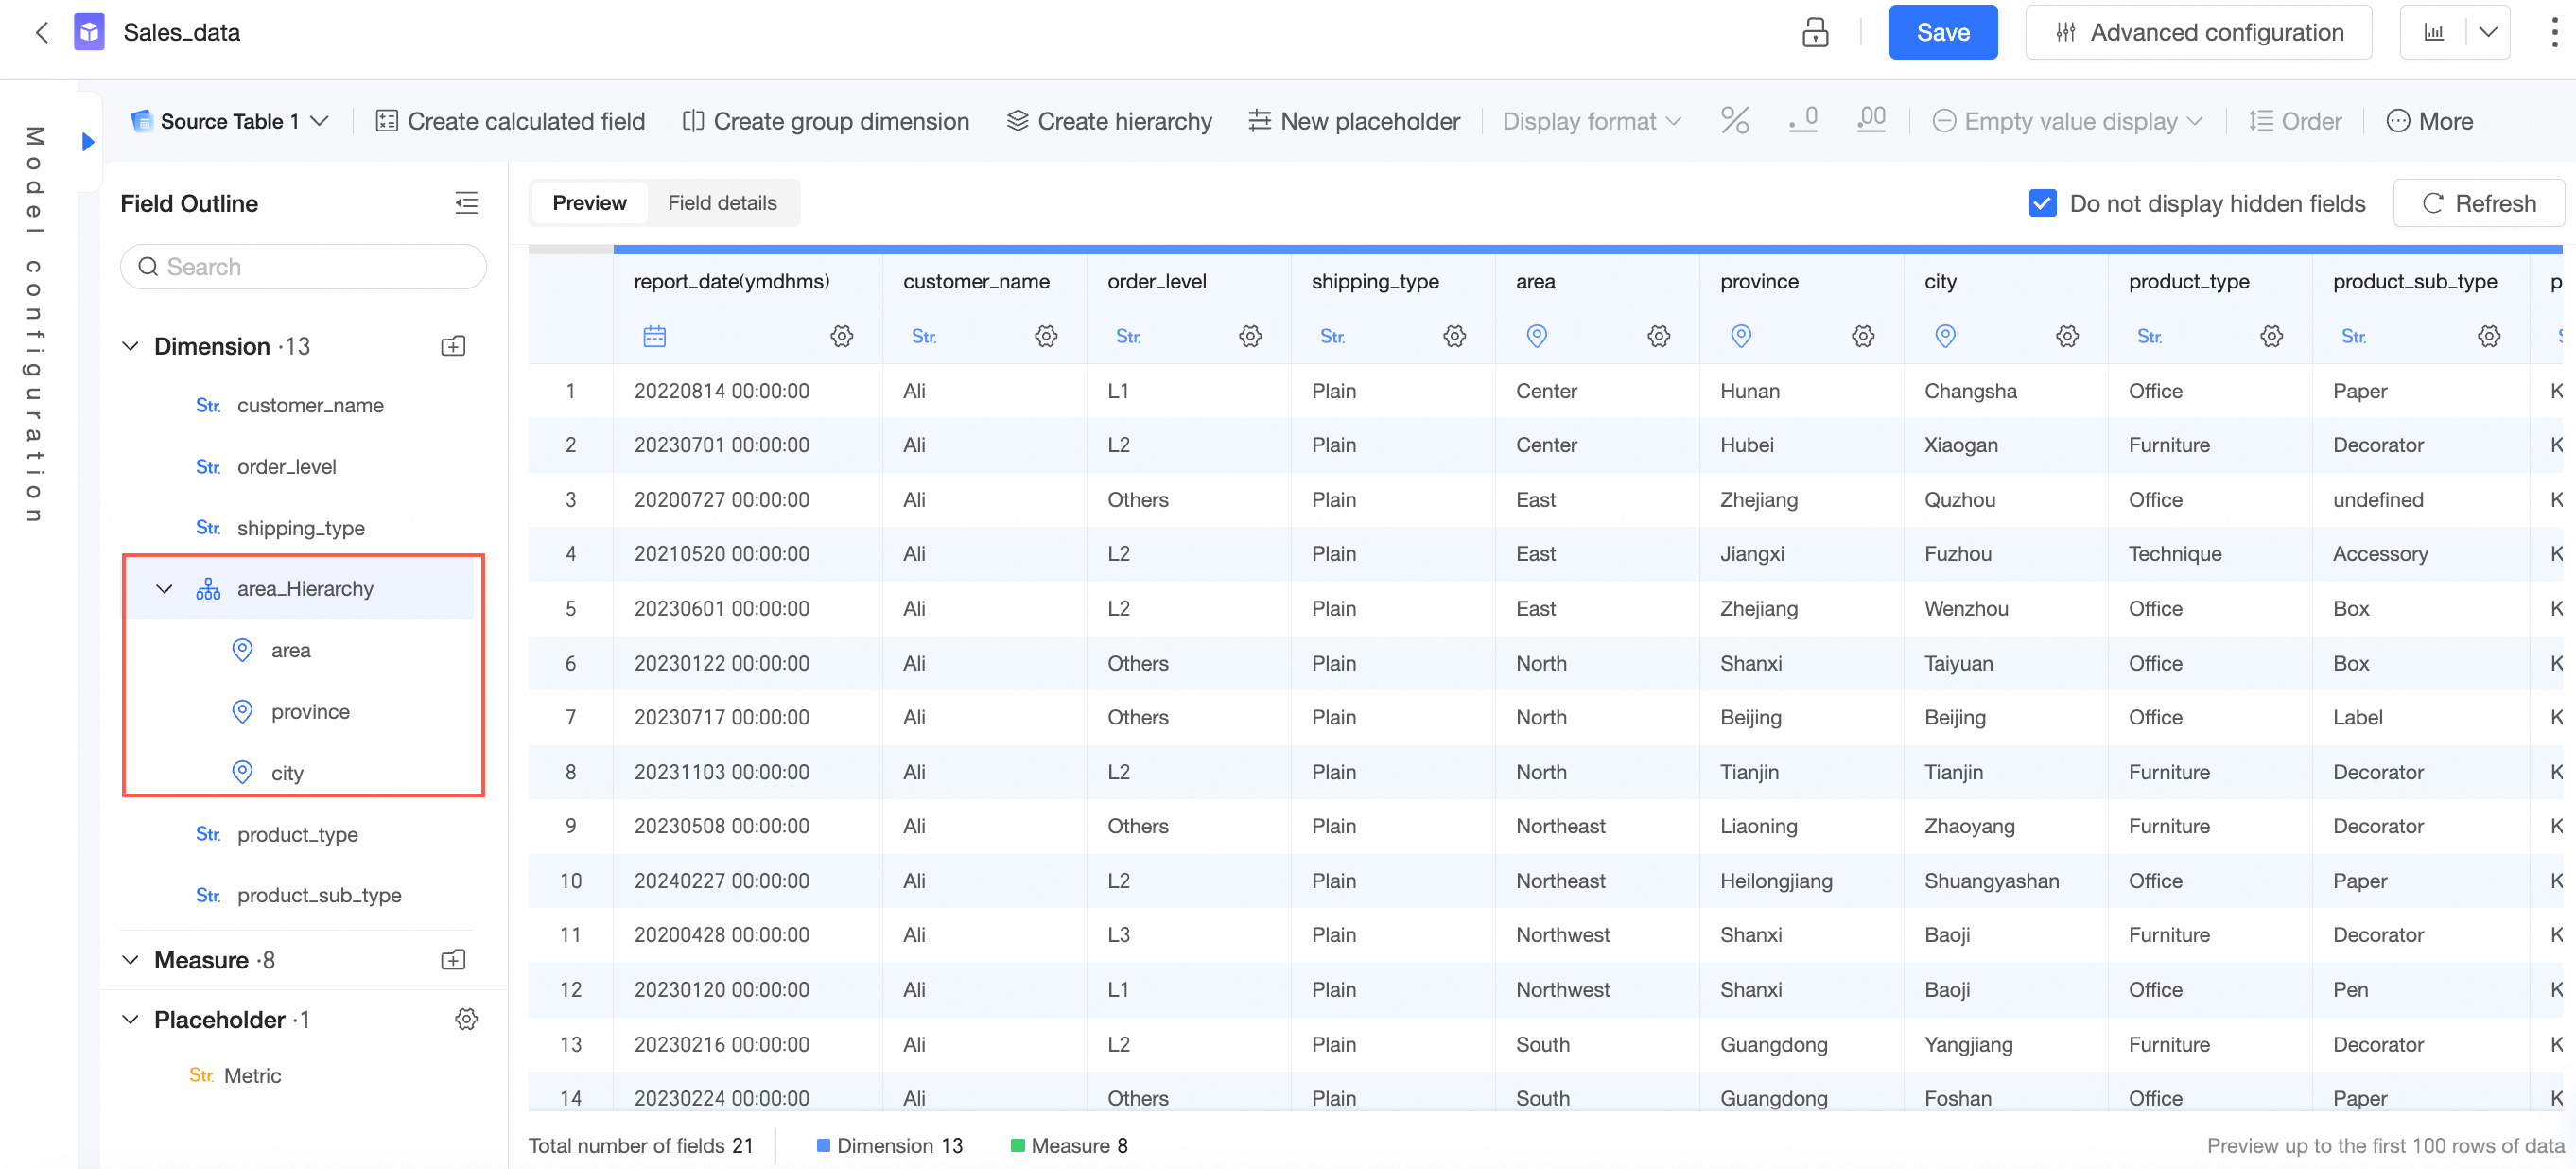
The system automatically displays the data in the table.
After you edit the dataset, you can click Save.
Step 2: Create a Dashboard
You can create two dashboards. This example first creates the Company Market Data dashboard.
Log on to the Quick BI console.
Go to the dashboard page.
As shown in the following figure, select Sales Data as the dashboard dataset and name the dashboard Company Market Data.
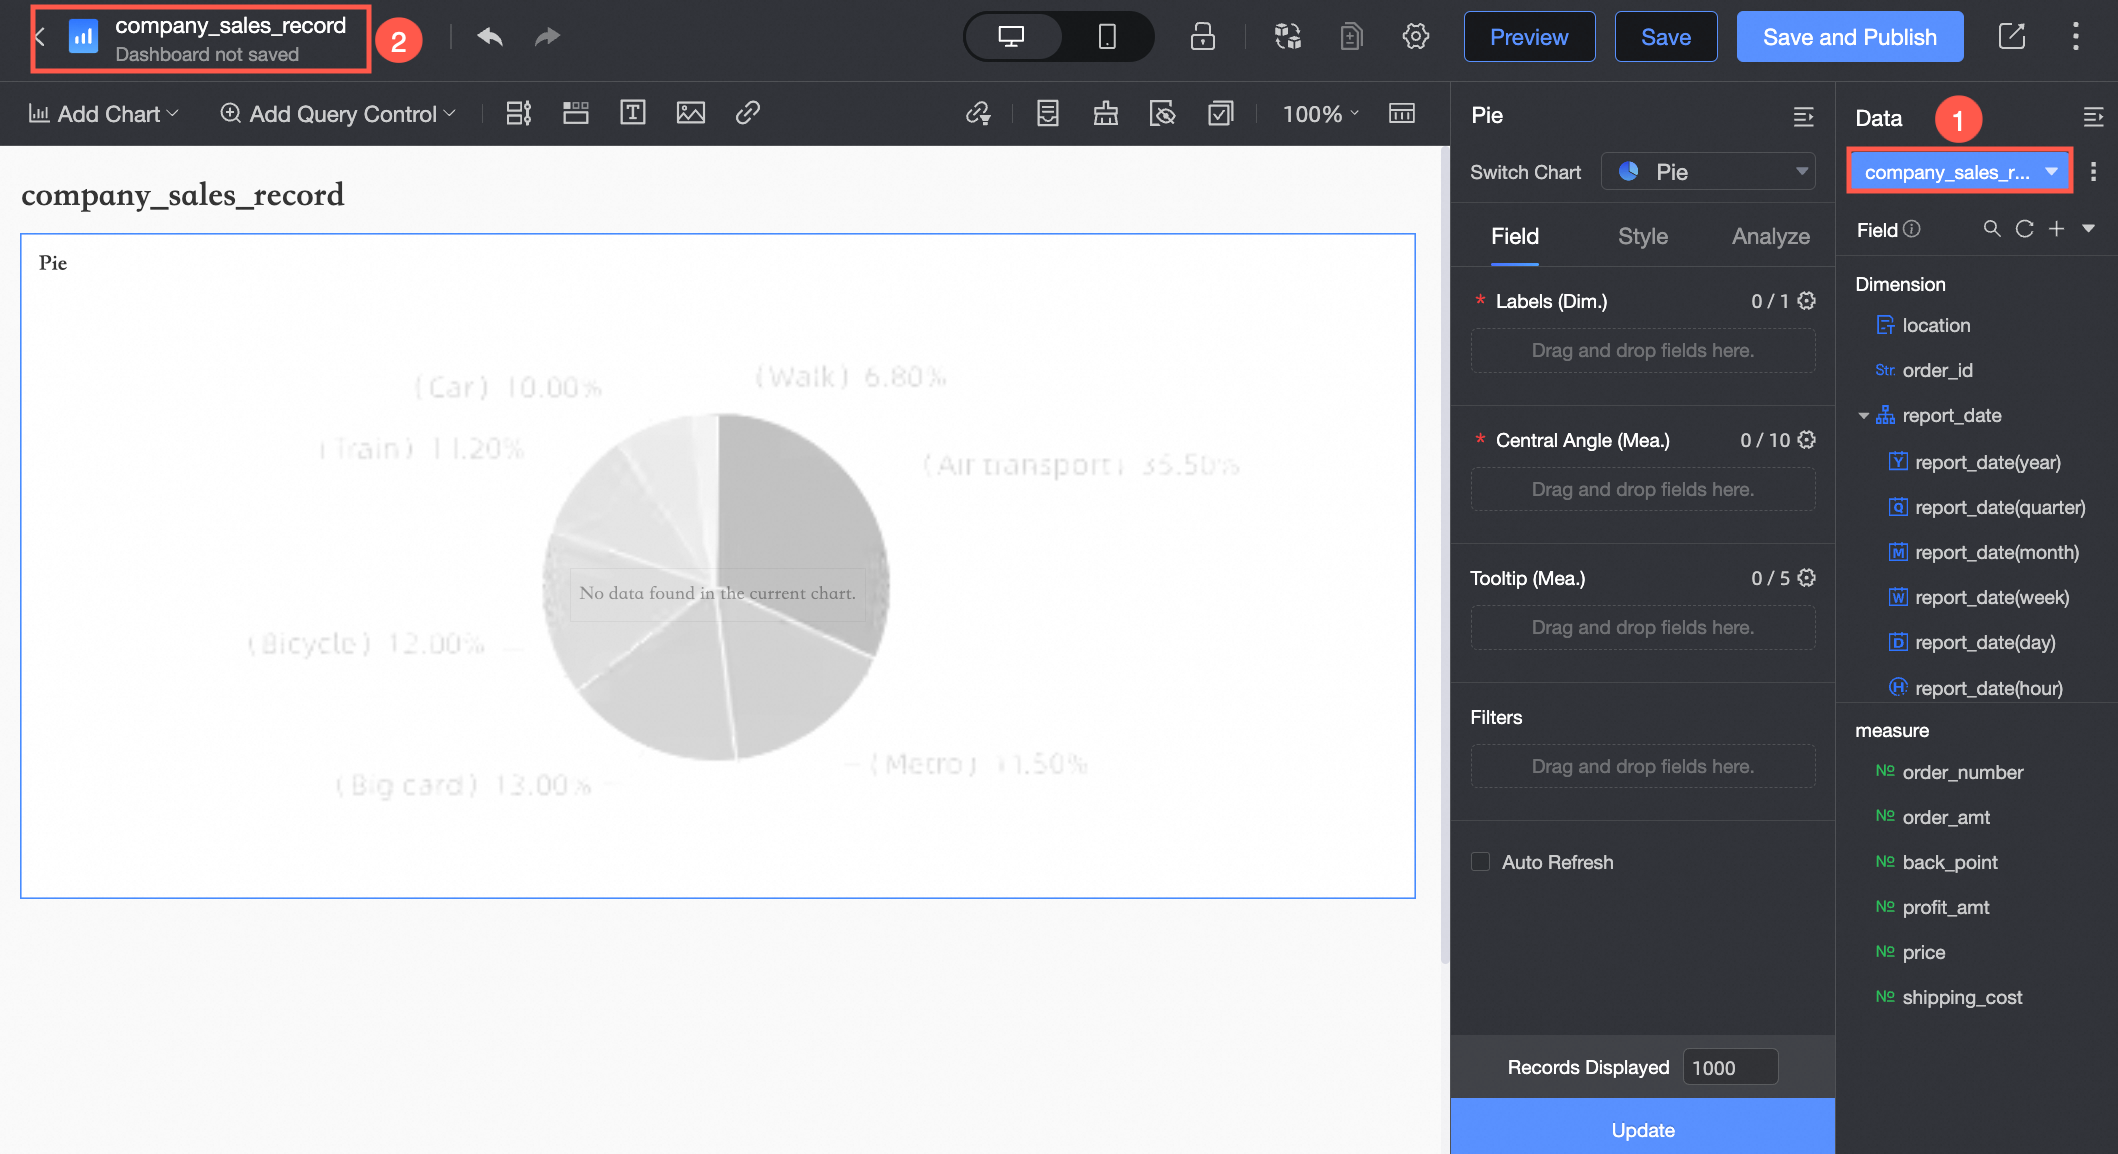
You can add a pie chart to the dashboard and name it Regional Order Quantity Proportion Analysis.
Step 3: Configure and Display Drilling
Configuration Steps
You can manually configure the drilling feature. This example uses a pie chart.
On the Fields tab of the pie chart, click the
 icon on the right side of the target dimension Area.
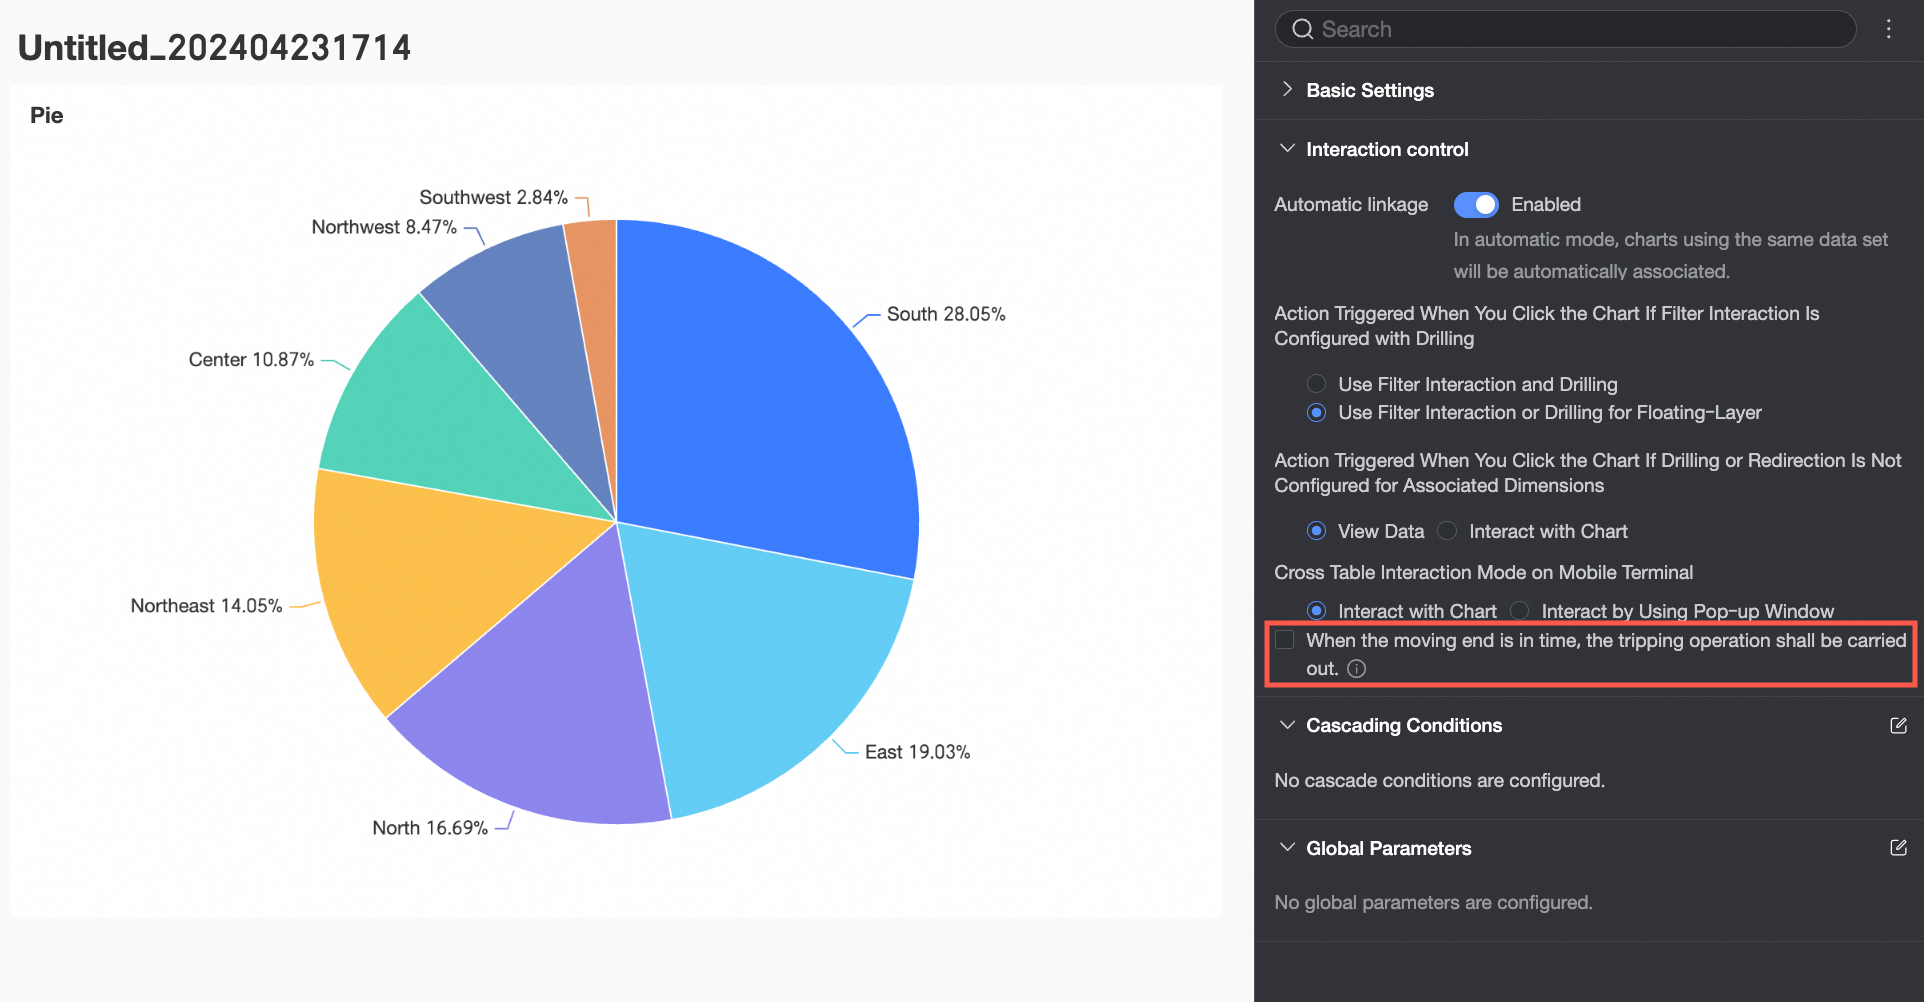
If the filter interaction feature is enabled for the pie chart, a pop-up window appears when you configure the drilling feature. This window lets you select how filter interaction and drilling take effect when you click. For more information, see Method 2: Configure from the Advanced Configuration entry point.
Configure the drilling hierarchy.
In this example, the drilling order is Area > Province > City.
You can also perform the following operations:
To add a drilling dimension, drag the desired dimension to the Drilling/Dimension area and adjust its order.
Change the drilling order: In the Drilling/Dimension area, select the target field and drag it to adjust its position.
Delete a drilling dimension: In the Drilling/Dimensions area, select the target field and click the
 icon.
icon.
NoteCross tables support up to three drilling items. Other charts support only one drilling item. You can set up to six drilling levels.
Click the Update button.
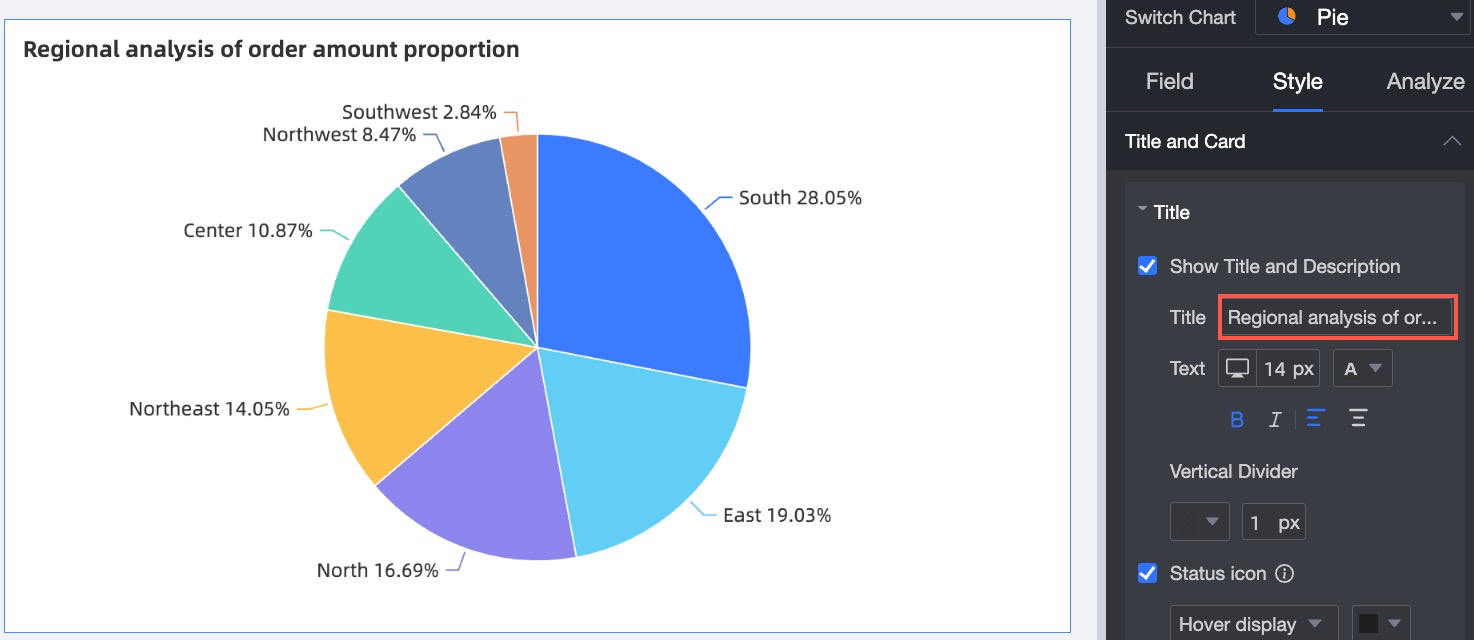
If the status icon is set to Always show, the
 icon appears on the right side of the chart title, as shown in the following figure. For more information about how to set the status icon, see Configure title.
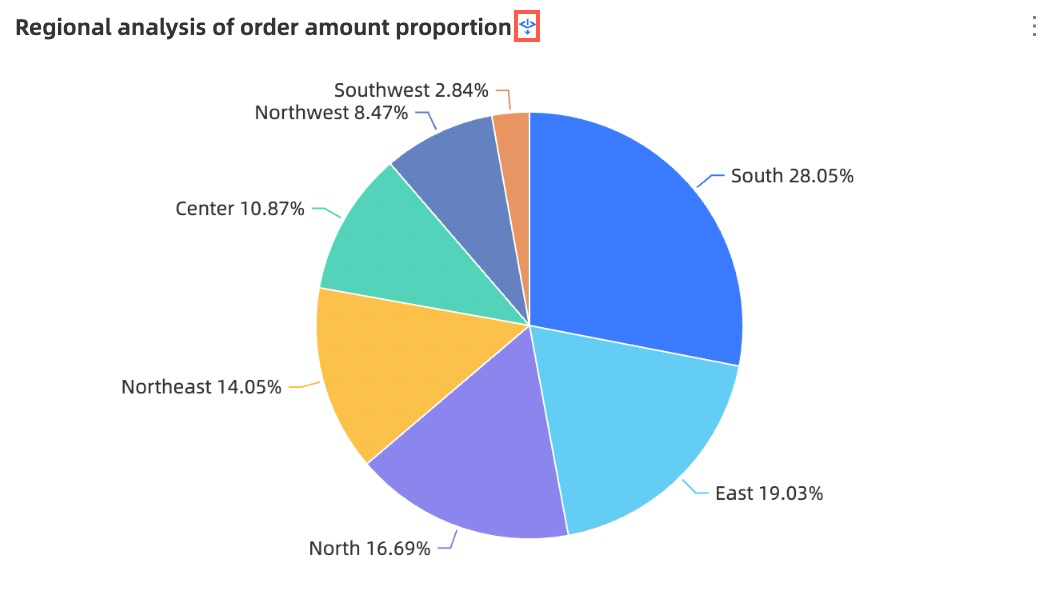
Display Results
PC
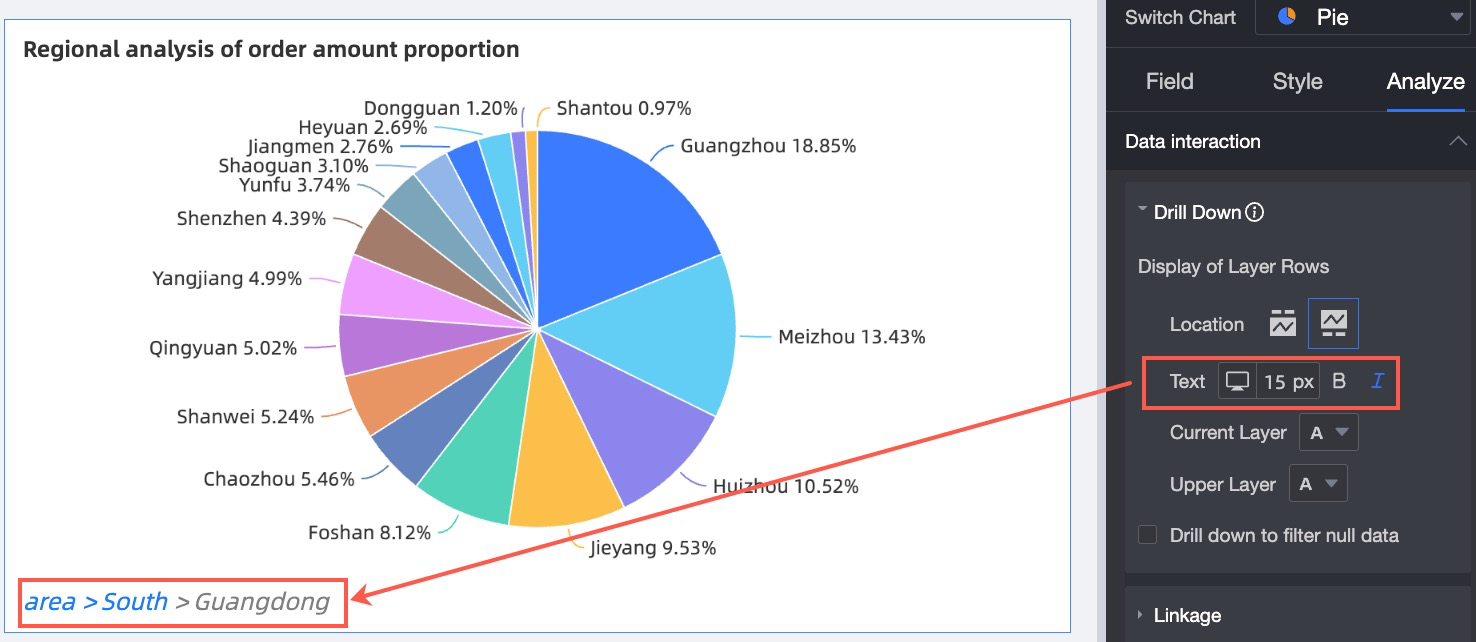
Click the South China region. The chart drills down to the Province Data Proportion for that region. Click the Guangdong province. The chart drills down to the City Data Proportion for that province.
 To roll up from the city data proportion to the province, click the Province label at the bottom-left of the chart. You can also click the region to roll up.
Mobile
Mobile
Select the South China region. In the interactive analysis action bar, click the Drill down button. The chart drills down to the Province Data Proportion for that region. Select the Guangdong province and click the Drill down button in the interactive analysis action bar. The chart drills down to the City Data Proportion for that province.
To roll up from the city data proportion to the province, click the Province label below the chart. You can also select the region and click the Roll up button in the interactive analysis action bar to roll up.
If the current chart supports the tooltip feature and the tooltip hover bubble is enabled, the drill-down entry appears in the tooltip hover bubble.
You can long press on a mobile device to perform drill-down operations.
In Page Settings > Advanced > Interaction Control, select Long press on mobile to drill down.
You can now long press to drill down on a mobile device.
You can long press the Chart area or Data label text area to drill down.
 Note
NoteOnly pie charts, doughnut charts, rose charts, and treemap charts support long pressing the Chart area to drill down.
Only pie charts, doughnut charts, and rose charts support long pressing the Data label text area to drill down.
Configure Drilling Hierarchy Row Display
Entry Point
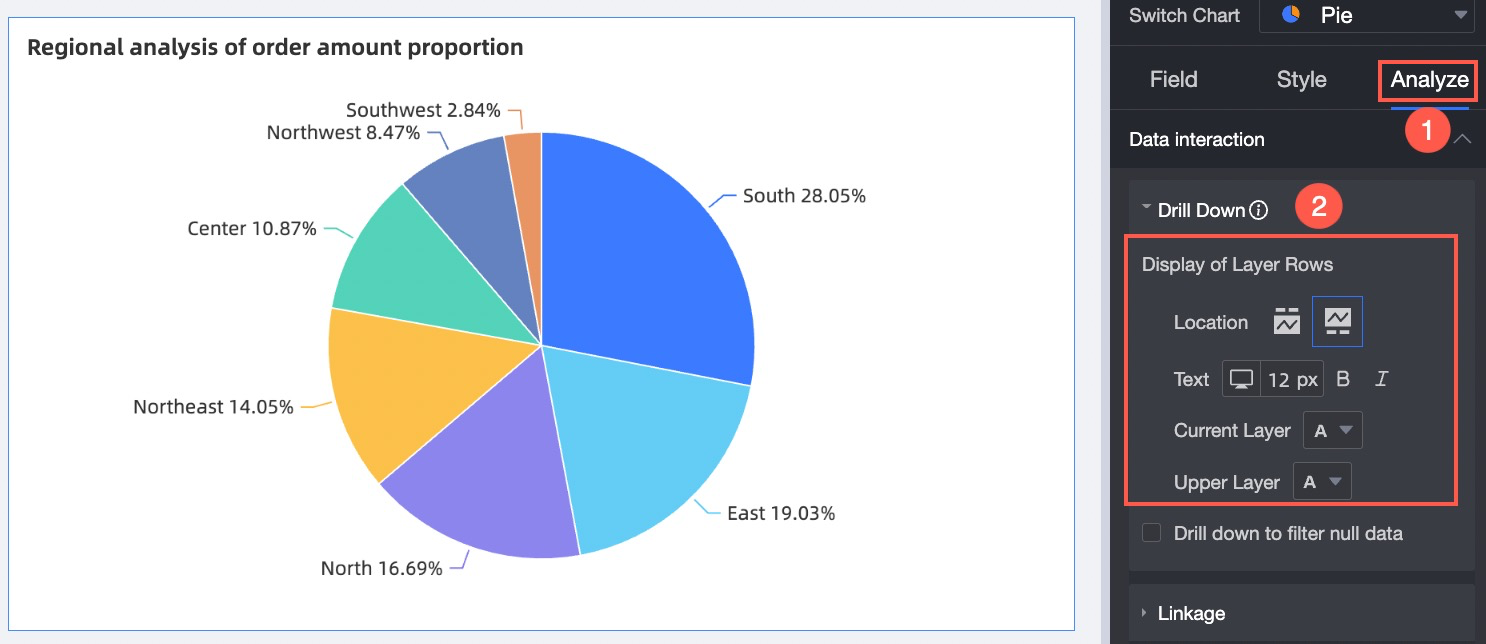
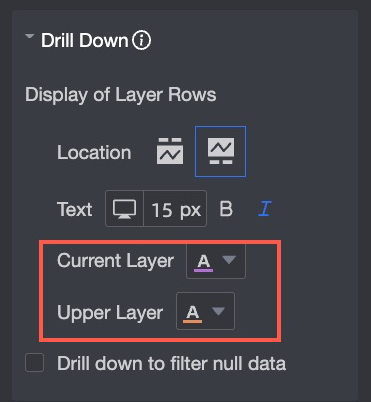
As shown in the following figure, on the (①) Analyze tab of the Regional Order Quantity Proportion Analysis pie chart, click Drilling in the Data Interaction area to expand the (②) Configuration items.
Configuration Item Descriptions
Configuration item | Description |
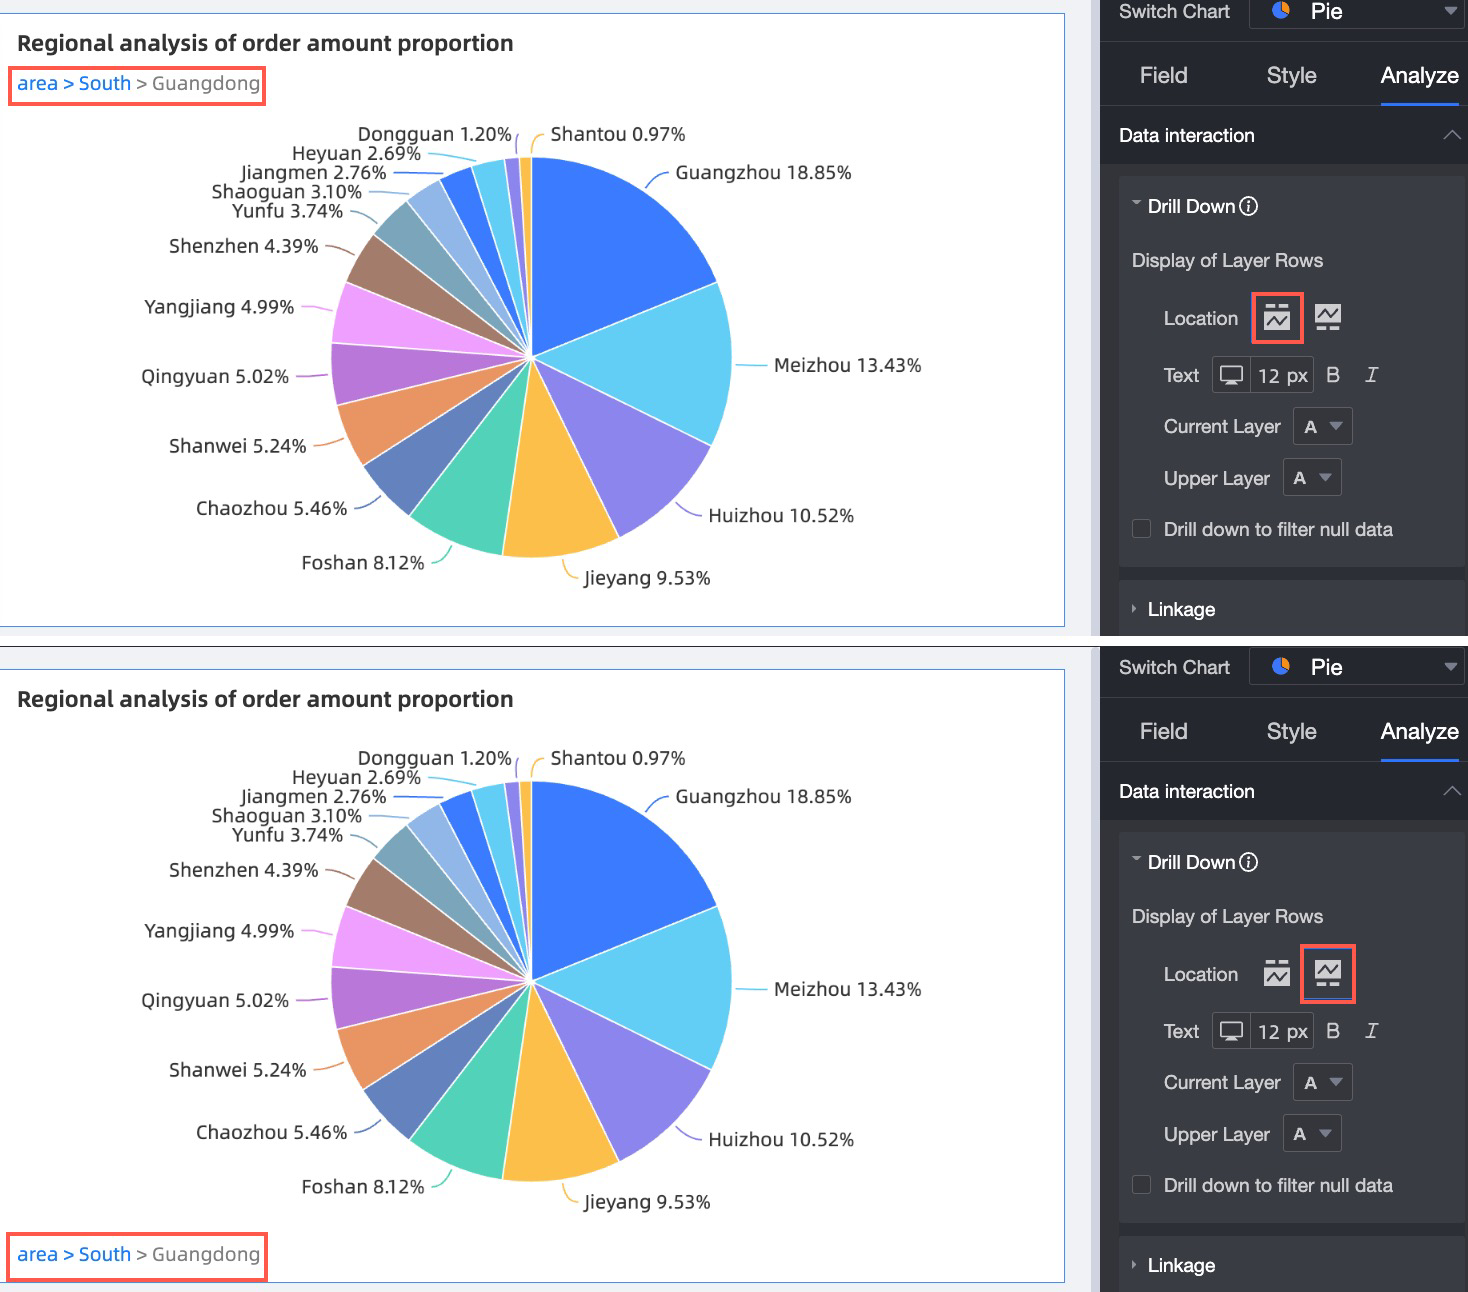
Position | Set the Position of the hierarchy row. Options include Above the chart and Below the chart.
|
Text | Set the Text style of the hierarchy row. Options include Size, Bold, and Italic.
|
Current level/Parent level color | Set the Font color for the current level and parent level.
|
Configure Drill-down Auxiliary Fields
Auxiliary fields are dynamically added after drill-down fields during a drill-down operation to provide supplemental information about primary fields.
Scenarios
When you configure drilling for organizational structure data, such as Headquarters (Level 1 Organization) > Region (Level 2 Organization) > Partition (Level 3 Organization), you can view the owner that corresponds to the Headquarters before you drill down. When you click to drill down from the headquarters, you can view the owner that corresponds to the Region. You can configure the auxiliary field of the drilling dimension to dynamically switch this information.
Only table-type charts support configuring the display of drill-down auxiliary fields.
Procedure
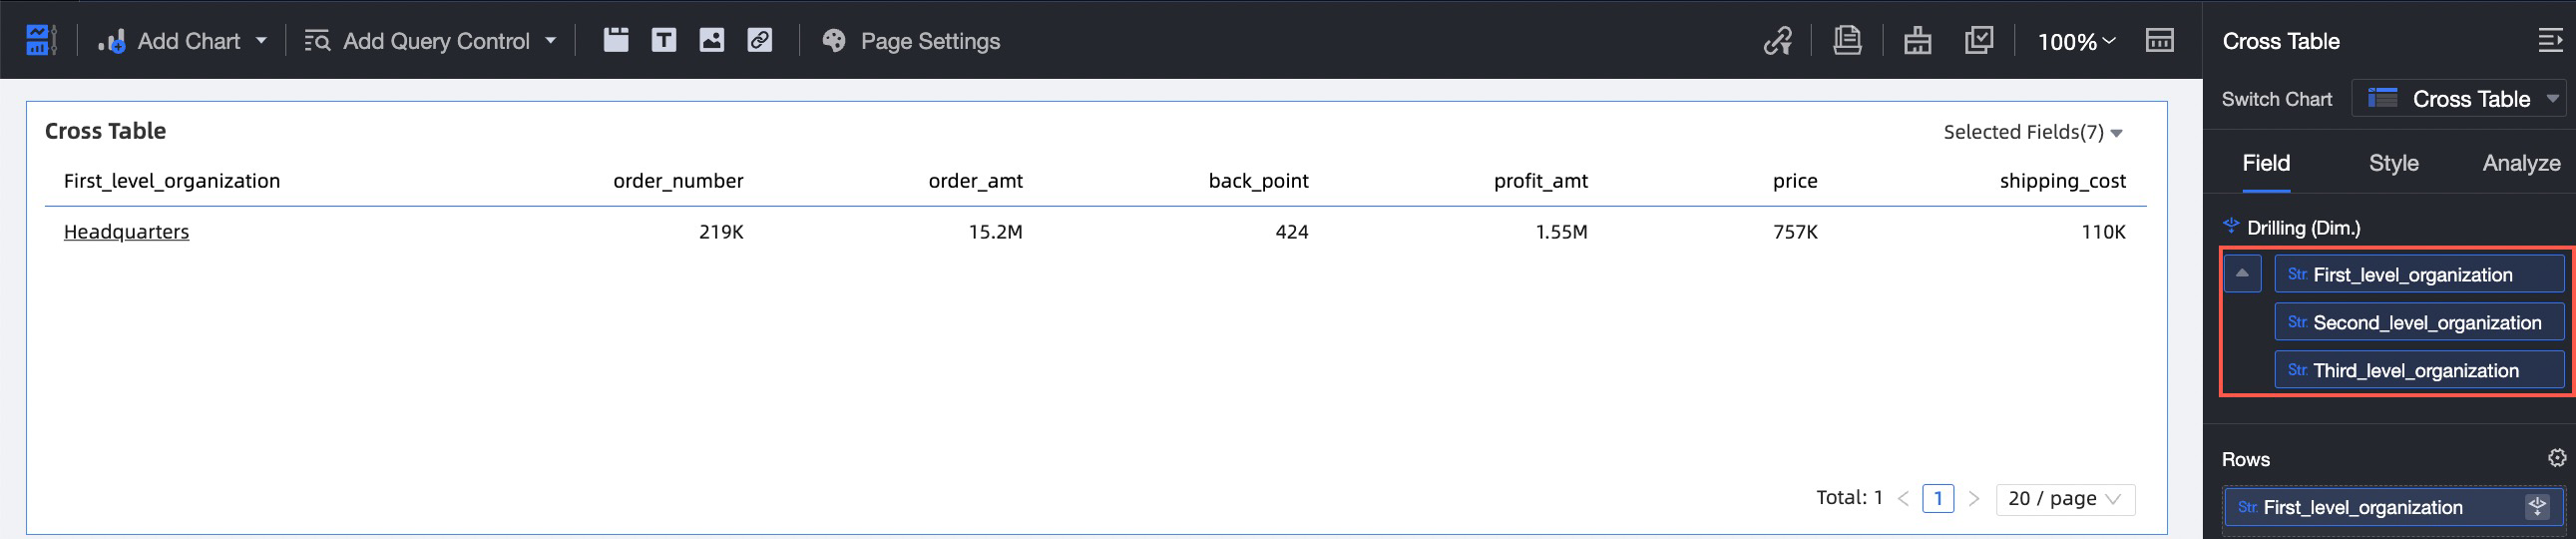
In the following cross table, the drilling feature is configured with the drilling sequence Level 1 Organization -> Level 2 Organization -> Level 3 Organization. For more information about the configuration procedure, see Step 3: Configure and Display Drilling.
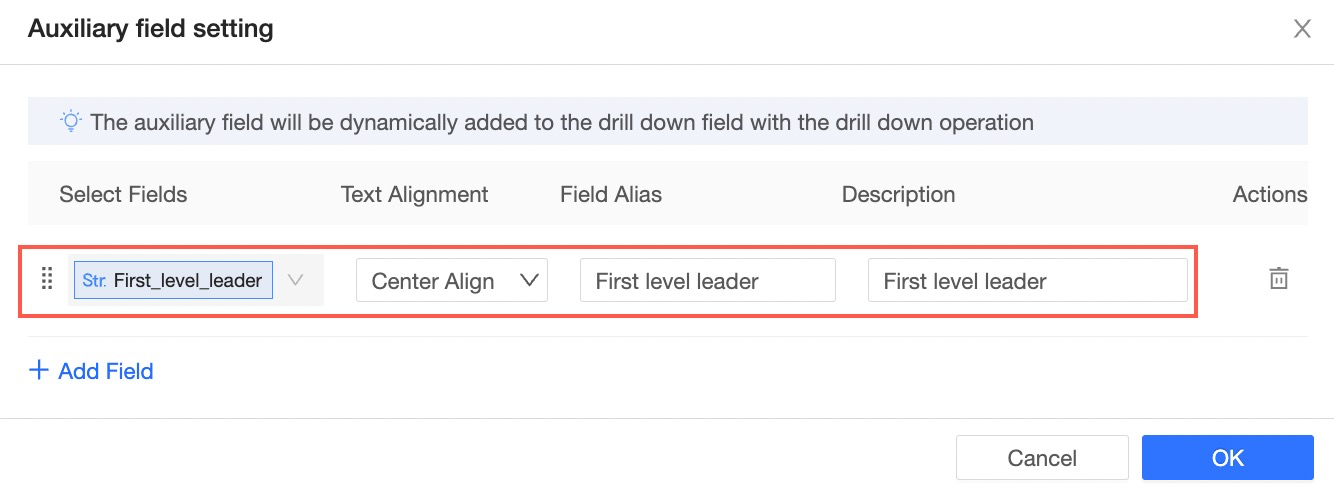
Hover over the dimension for which you want to set an auxiliary field, click the drop-down arrow, and select Auxiliary field from the menu. The configuration dialog box appears.
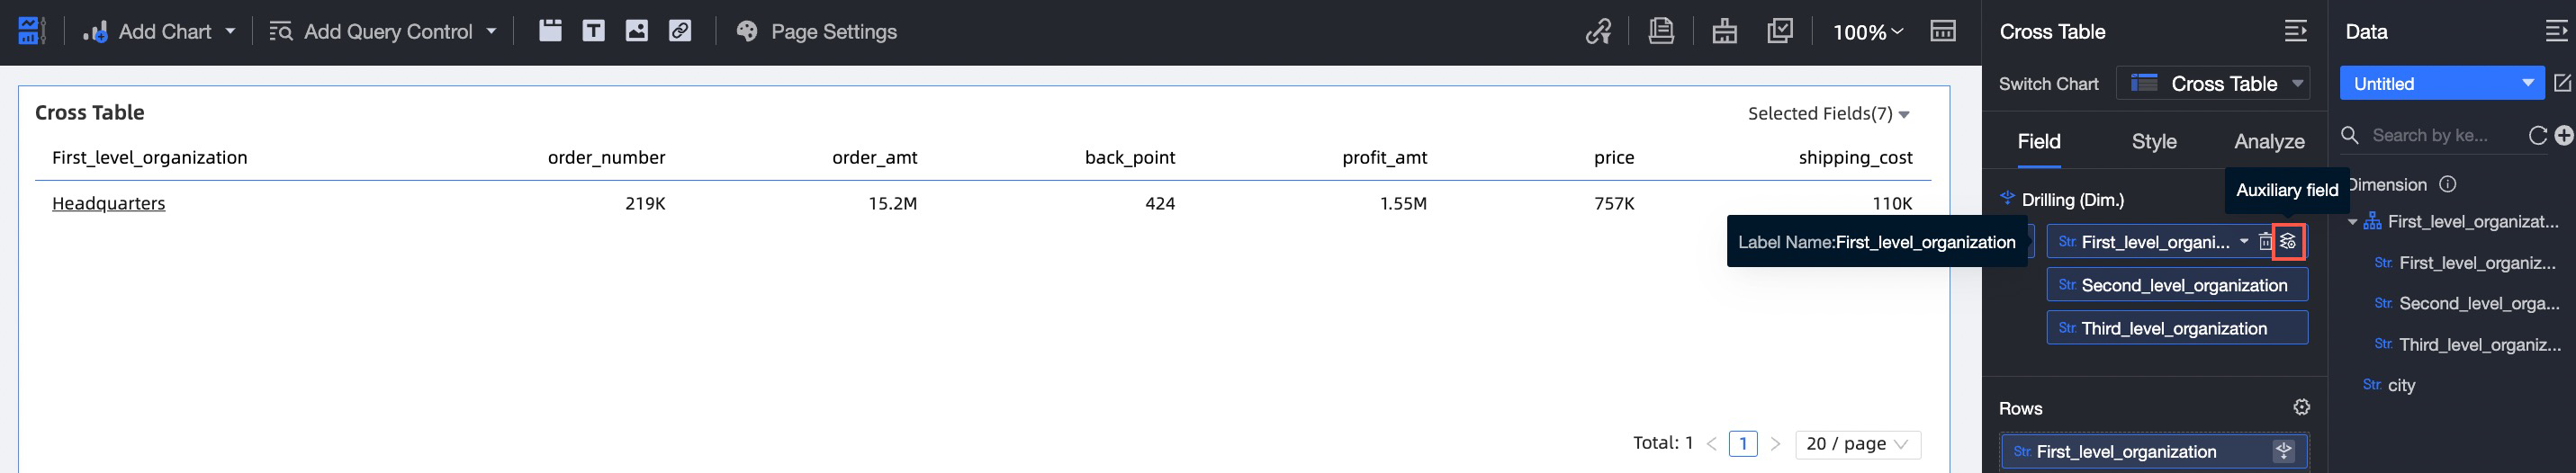
In the configuration dialog box, select the auxiliary field under the Level 1 Organization field. Add the Level 1 Owner field, set the alignment to Align center, and set the display name to Level 1 Owner.
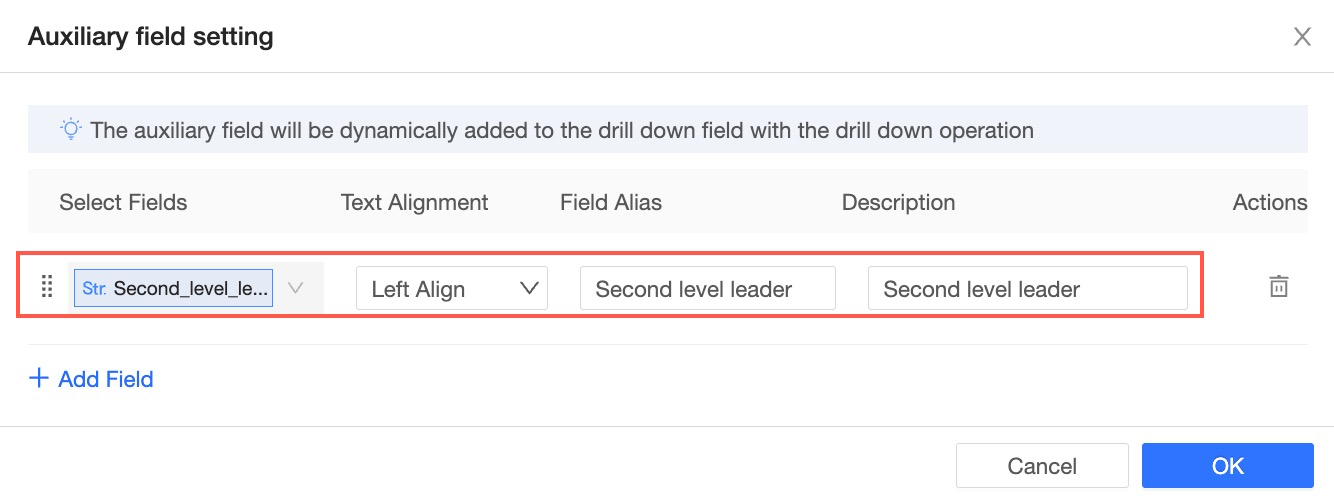
After you configure the auxiliary field for the Level 1 Organization field, configure the Level 2 Organization field. Add the Level 2 Owner field, set the alignment to Align left, and set the display name to Level 2 Owner.
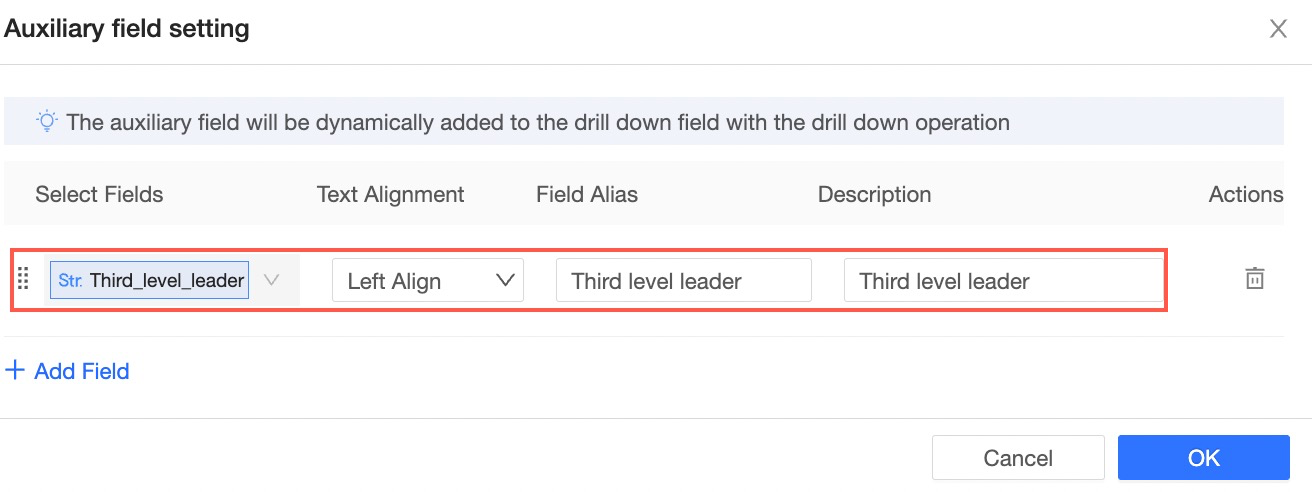
After you configure the auxiliary field for the Level 2 Organization field, configure the Level 3 Organization field. Add the Level 3 Owner field, set the alignment to Align left, and set the display name to Level 3 Owner.
Click Confirm to complete the configuration. The result is shown in the following figure. You can view the owner and other data for the Headquarters (Level 1 Organization). After you click the headquarters, you can see the owner and other data for the East China and South China regions. After you click the South China region, you can view the owner and other data for the Guangfo, Shenzhen, and Fujian partitions.
Related Operations
This document describes how to configure drilling for a single chart. If you want to perform a drill-down operation in one chart and have other associated charts automatically synchronize to the same analysis level, you can configure synchronized drilling. For more information, see Set up synchronized drilling.