After you add your website to Web Application Firewall (WAF), you can query urgent vulnerability notifications, service traffic, and threats to the website of the previous 30 days on the Overview page. This way, you can view and analyze the security status of your website.
Prerequisites
The domain names of your website are added to WAF. For more information, see Add a domain name to WAF.
Query data on the Overview page
You are directed to an interface when you log on to the WAF instance based on the region in which your WAF instance is deployed. If your WAF instance is deployed in the Chinese mainland, you are directed to the interface in the China (Hangzhou) region. If your WAF instance is deployed outside the Chinese mainland, you are directed to the interface in the Singapore region.
On the Overview page, you can view information about resources that are added to WAF, such as the number of requests and queries per second (QPS).
Log on to the WAF console. In the top navigation bar, select the resource group and the region in which the WAF instance is deployed. The region can be Chinese Mainland or Outside Chinese Mainland.
In the left-side navigation pane, click Overview.
In the upper part of the Overview page, specify a domain name and a time range to query data.
The following list describes the query settings:
Domain name: By default, All is selected. In this case, WAF displays the data for all domain names that are added to WAF. You can select a specific domain name.
Time range: By default, Today is selected. In this case, WAF displays the data of the current day. You can select an interval of 10 seconds, 30 seconds, 60 seconds, or 5 minutes. You can also select Yesterday, Today, 7 Days, or 30 Days to query the data that is generated during the specified time range.
The Overview page consists of the following four sections. You can click the link of each section to query the specific data and operations that are supported in the section.
Description of urgent vulnerabilities
The Urgent Vulnerability section displays the updated protection rules of WAF to help you handle the most recent security vulnerabilities that are disclosed on the Internet.
You can click a rule to open the Details panel. The panel displays the domain names that are affected by the vulnerability, the details of the vulnerability, and information about the protection rules.
Description of protection result statistics
The protection result statistics section displays the number of all received requests and the numbers of requests that trigger each of the following modules: Web Intrusion Prevention, HTTP Flood Protection, Scan Protection, Access Control, and Blocked Bot Attacks.
You can click the number below each module to go to the Security Report page. Then, you can view attack information. For more information, see View security reports.
You can click the ![]() icon below the protection result statistics section to view the detailed statistics. When you query the data of domain names, take note of the following items:
icon below the protection result statistics section to view the detailed statistics. When you query the data of domain names, take note of the following items:
If you query the data of all domain names, the top 5 domain names for each module are displayed.
If you query the data of a specific domain name, the trend of statistical data is displayed.
Description of request analysis charts
The request analysis charts include the request trend, client type distribution, and request analysis ranking charts.
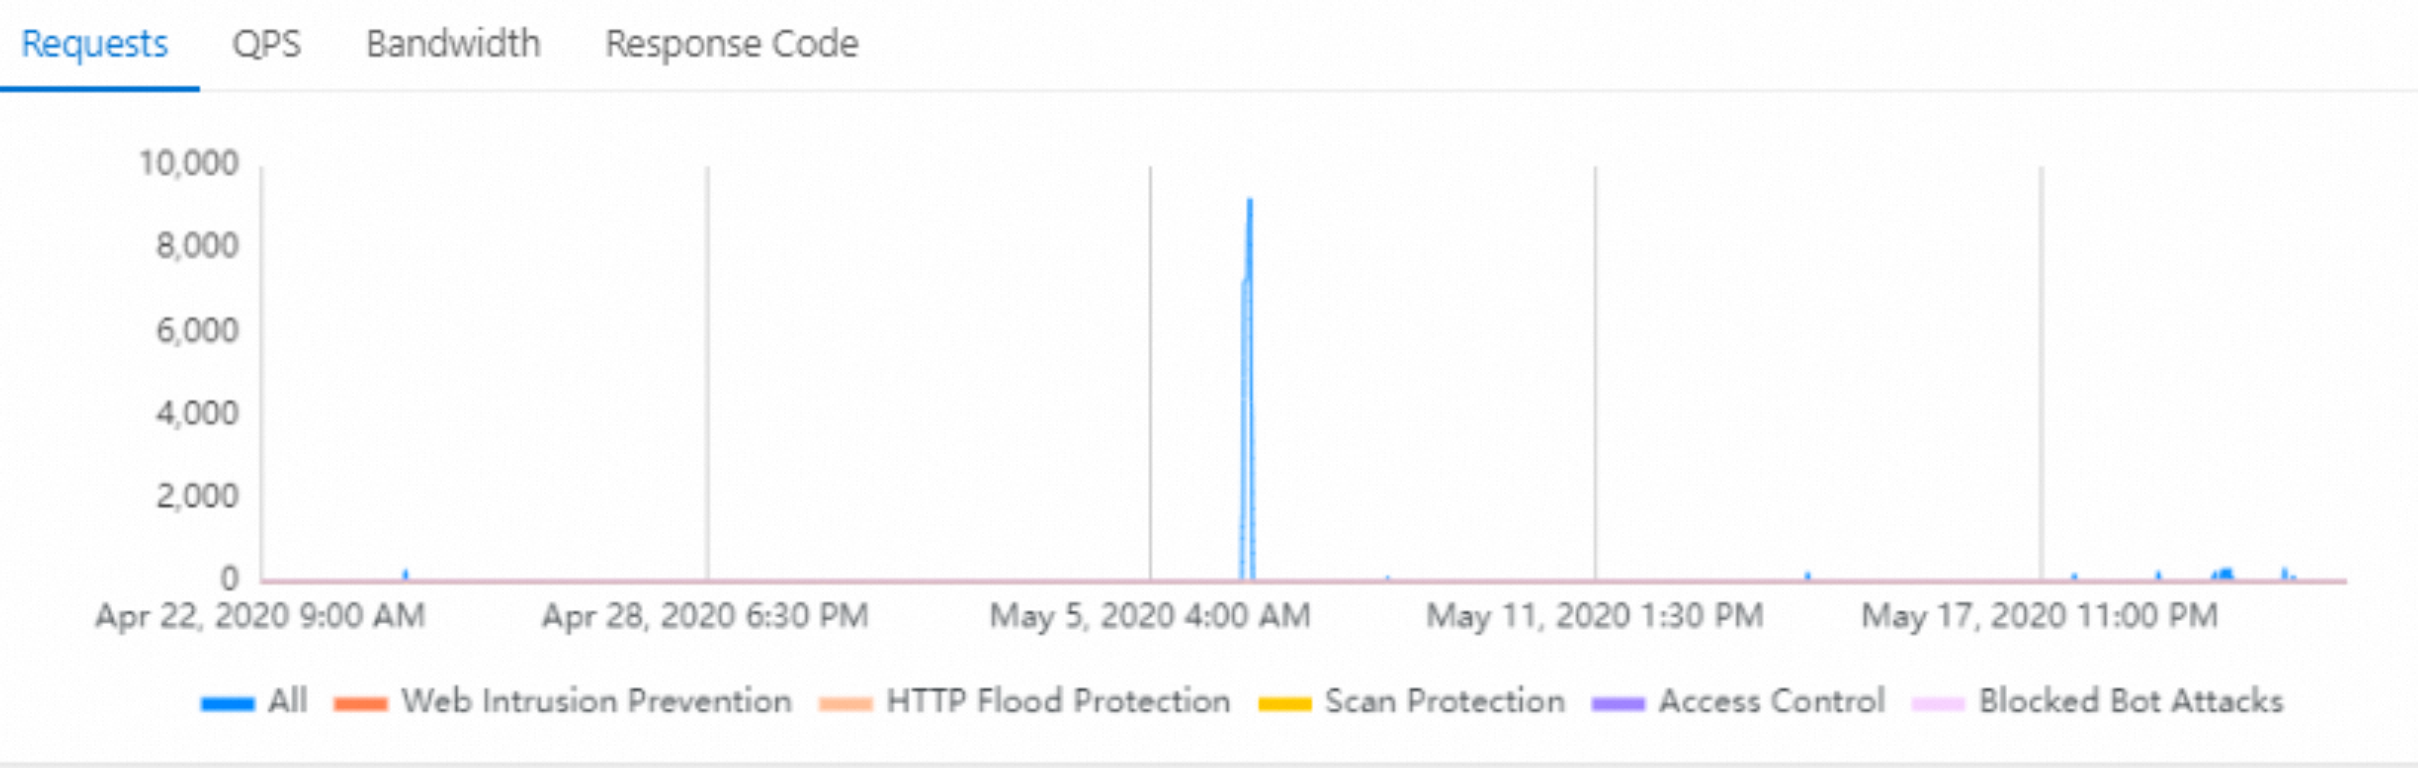
The request trend charts include the trend charts for Requests, QPS, Bandwidth, and Response Code.
 Note
NoteThe time of a trend chart can be accurate to the second. If you query data in real time, you can view the trend of request data at the second level.
To view a trend chart, you can click a tab in Section 1. To hide or display the trend for a specific module, you can click the legend of the module in Section 2 below the trend chart.
Trend description:
Requests: displays a trend chart for the total number of requests, the number of times that web intrusion protection is triggered, the number of times that HTTP flood protection is triggered, the number of times that scan protection is triggered, the number of times that access control is triggered, and the number of times that bot management is triggered.
QPS: displays a trend chart for the QPS of all requests, QPS for web intrusion prevention, QPS for HTTP flood protection, QPS for scan protection, QPS for access control, and QPS for blocked bot attacks. The QPS values that are displayed on this trend chart change over time.
In the upper-right corner of the trend chart, click Average or Peak to switch between the average and peak QPS.
Bandwidth: displays a trend chart for inbound and the outbound bandwidths.
Response Code: displays trend charts for the number of error codes that are returned to clients and the number of error codes that are returned to WAF. The error codes include 5XX, 405, 499, 302, and 444.
In the upper-right corner of the trend chart, click WAF to Client and Origin Server to WAF to switch between the two trend charts.
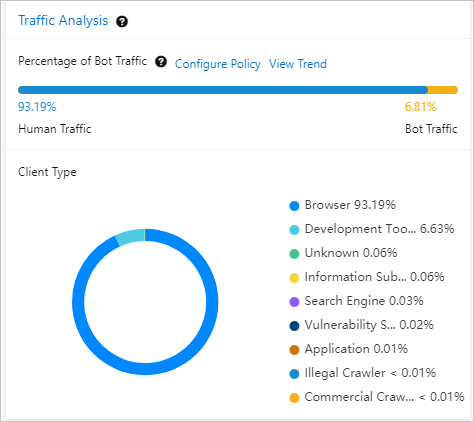
Traffic Analysis: includes the Percentage of Bot Traffic and Client Type Distribution sections.
When you enter a domain name, take note of the following items:
The Percentage of Bot Traffic section displays traffic that is destined for the domain name. Traffic from browsers and applications is identified as human traffic. Traffic from other types of clients is identified as bot traffic.
If the percentage of bot traffic is abnormally high, we recommend that you click Configure Policy. Then, you can use the Bot Management feature of WAF to prevent bot attacks. Click View Trend to go to the Security Report page. Then, click the Bot Management tab to view the protection effects. For more information about bot management, see Configure anti-crawler rules for websites.
The Client Type Distribution section displays the distribution of client types in a pie chart. Common client types include browsers, script tools, search engines, and scanners. To view the description of each client type, click the
 icon to the right of Traffic Analysis.
 To view the distribution of subtypes for a specific client type, click the client type in the pie chart. For example, you can click the browser type to view the distribution of different types of browsers.
The request analysis ranking charts include the charts for Top 10 Clients, URL Requests, and Top IP. You can click the following tabs to view each ranking data:
Top 10 Clients: displays the top 10 types of clients that initiate the most requests.
URL Requests: displays the top 10 URLs that receive the most requests.
Top IP: displays the top 10 source IP addresses of requests.
Description of threat event analysis
The Threat Event Analysis section displays the attack events on your website and the attacks that are blocked by WAF. This helps you understand and handle the threats to your website at the earliest opportunity.
You can click an event name to view the event details. Event details include threat intelligence and handling suggestions. You can also view the analysis result of the event in the Top 5 Attacks section. You can click the following tabs to view specific data:
Source IP Address: displays the top 5 source IP addresses of attacks.
Target: displays the top 5 URLs that receive the most attacks.
Attack Type: displays the top 5 attack types, such as SQL injections and cross-site scripting (XSS) attacks.
Attack Date: displays the top 5 dates when the most attacks are launched.
Attack Tool: displays the top 5 most frequently attack tools that are used, such as cURL and postman-runtime.
In the Event Details panel, you can click View Log to the right of an event name to go to the Log Service page. Then, you can query logs to analyze the event. For more information, see Query logs.