Monitoring rules are the core of Data Quality. You can configure monitoring rules to monitor data in MaxCompute, E-MapReduce (EMR), Hologres, AnalyticDB for PostgreSQL, and AnalyticDB for MySQL. This topic describes how to configure monitoring rules for MaxCompute.
Procedure
Step 1: Add a MaxCompute data source
Go to the Data Sources page.
Log on to the DataWorks console. In the top navigation bar, select the desired region. In the left-side navigation pane, choose . On the page that appears, select the desired workspace from the drop-down list and click Go to Management Center.
In the left-side navigation pane of the SettingCenter page, choose .
In the upper-left corner of the Data Sources page, click Add Data Source. In the Add Data Source dialog box, click MaxCompute. For more information, see Add a MaxCompute data source.
Click the
 icon in the upper-left corner and choose .
 In the left-side navigation pane of the DataStudio page, click Computing Resource. On the Computing Resource page, associate the MaxCompute Computing Resource with DataStudio.
NoteIn this example, the test data added to the test table is from a MaxCompute public dataset. In actual business scenarios, you must configure a monitor and monitoring rules for your business data.
Step 2: Go to the Table Quality Details page
Click the
icon in the upper-left corner and choose . In the left-side navigation pane, choose .
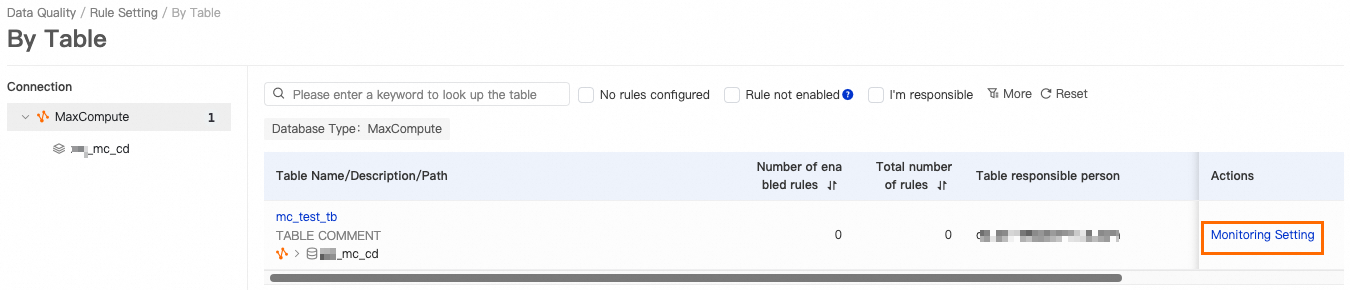
In the Connection section, select a database. On the right side of the Configure by Table page, find the table for which you want to configure monitoring rules and click the name of the table or click Configure Monitoring Rule in the Actions column. The Table Quality Details page appears.
NoteYou can search for a table by name. You can use the initial letters of a table name to perform a fuzzy match.
Step 3: Create a monitor
On the Rule Management tab of the Table Quality Details page, click the
 icon next to Monitor Perspective. The Create Monitor page appears.
 Configure the parameters for quality monitoring.
NoteYou can create a monitor based on the quality check requirements of your table. For information about how to create a monitor, see Configure a monitoring rule for a single table.
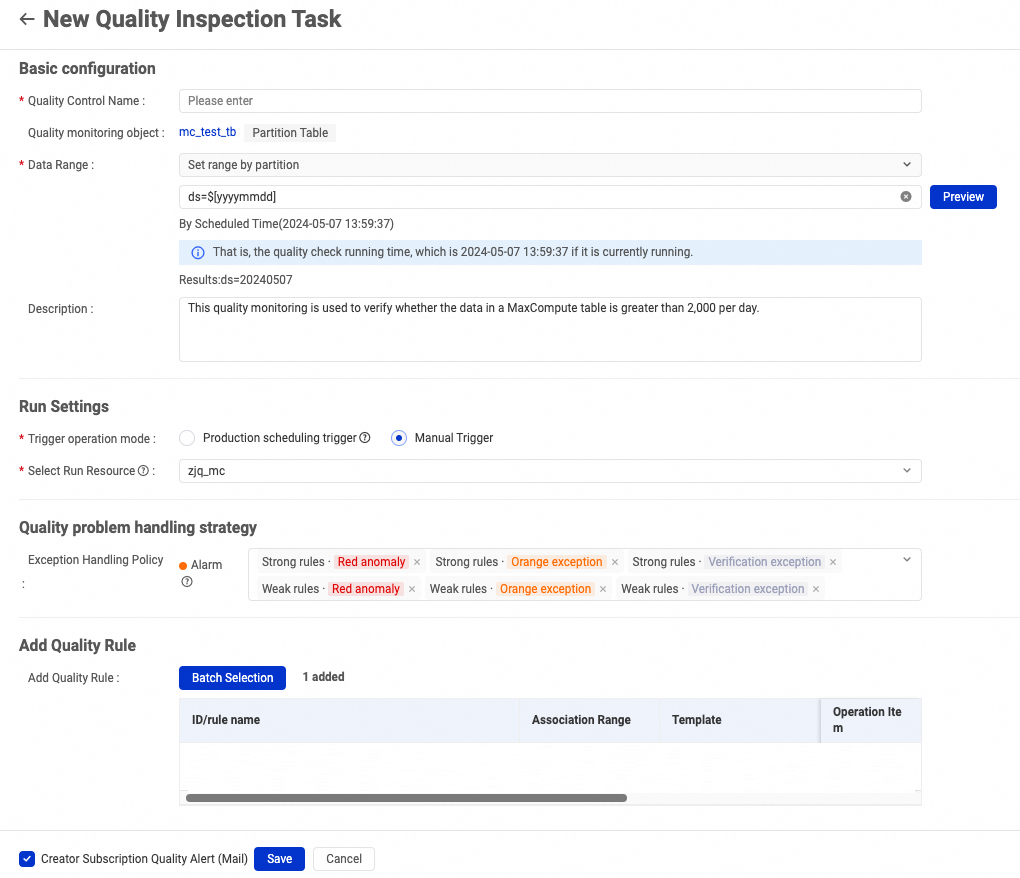
Click Save.
Step 4: Configure monitoring rules
On the Rule Management tab of the Table Quality Details page, click Create Rule.
Create a monitoring rule. In this example, a built-in template is used to create a monitoring rule.
NoteYou can create monitoring rules for your table based on your business requirements. For more information, see Configure a monitoring rule for a single table.
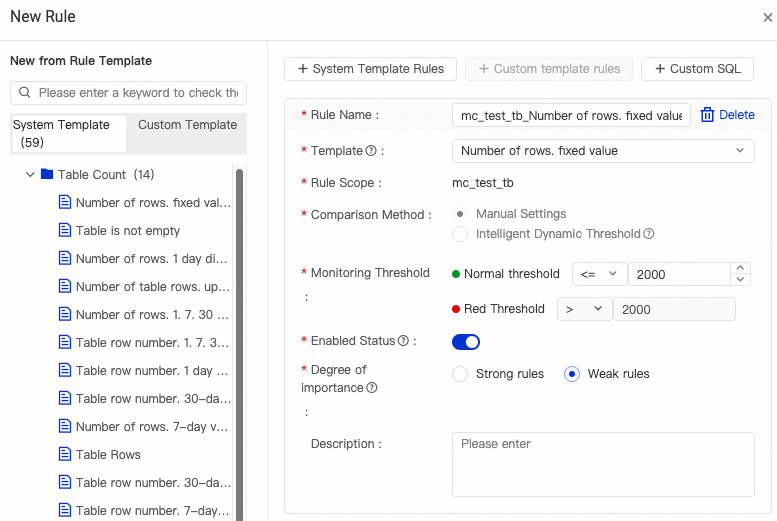
Add the monitoring rule to the monitor created in Step 3.
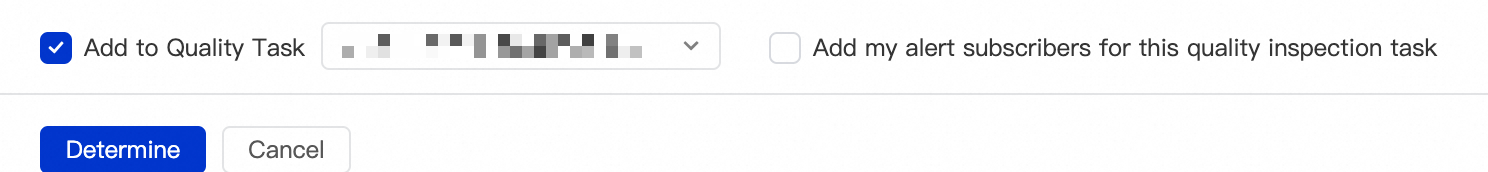
Click Determine.
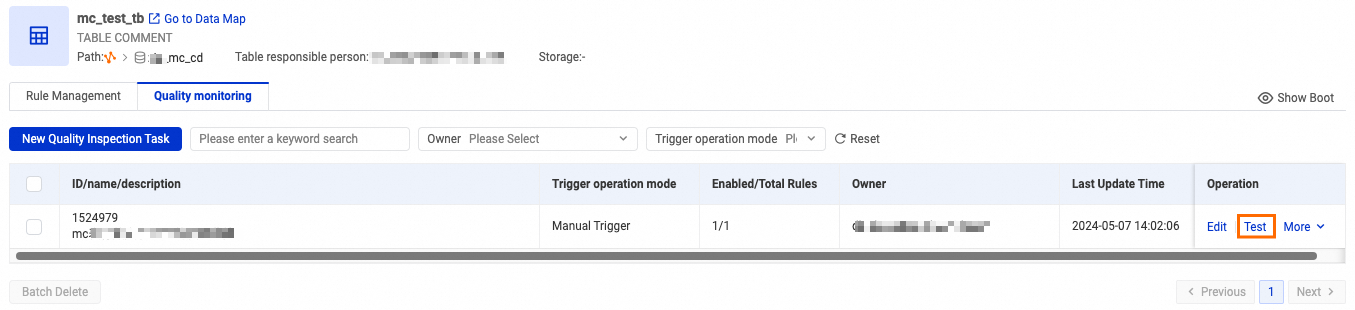
Step 5: Test the monitoring rule
On the Monitor tab of the Table Quality Details page, find the created monitor and click Test in the Actions column.
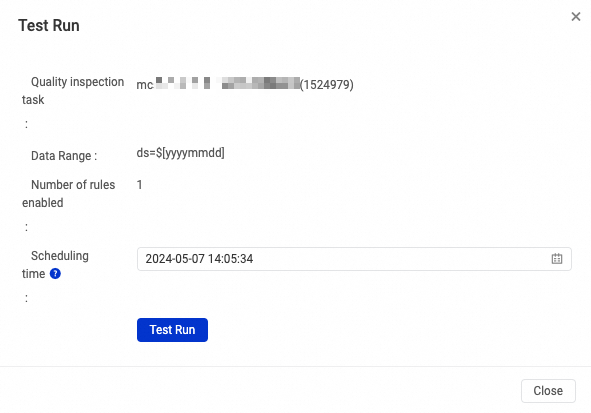
In the Test Run dialog box, check the values of the Data Range and Scheduling Time parameters and click Test Run.
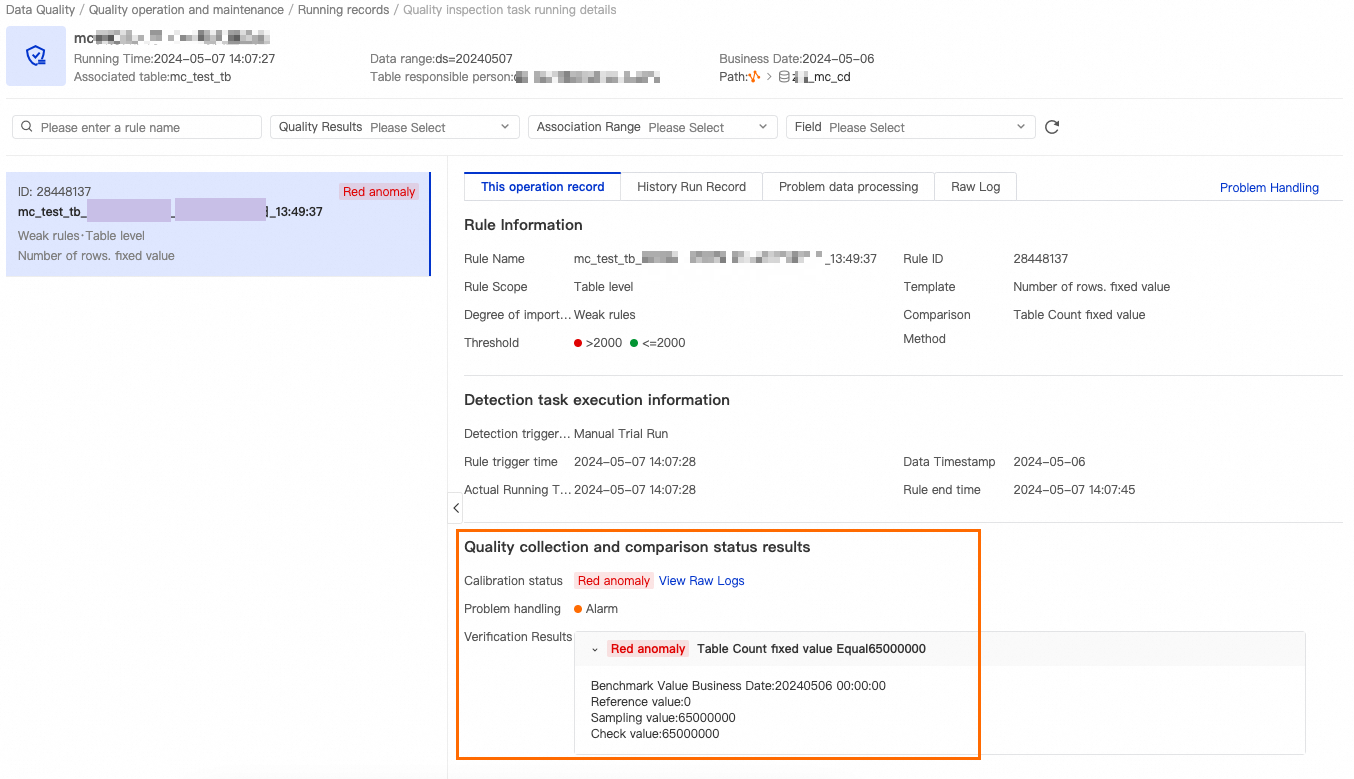
If Started is displayed, you can click View Details to view the results of the test run.
In this example, the number of rows in the MaxCompute test table is greater than 2,000. In this case, the quality check result hits the critical threshold.
After you make sure that the monitoring rule can be properly triggered, you can change the value of the Trigger Method parameter to Triggered by Node Scheduling in Production Environment for the monitor. After the scheduling node that you associated with the monitor finishes running in Operation Center, the monitoring rule is automatically triggered.
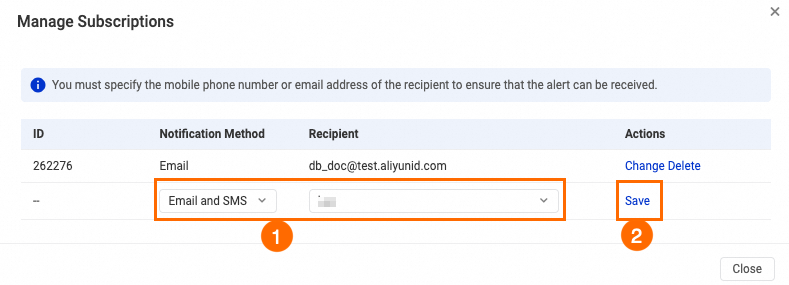
Step 6: Subscribe to the monitor
On the Monitor tab of the Table Quality Details page, find the created monitor and choose in the Actions column.
In the Alert Subscription dialog box, add a notification method and a recipient and click Save in the Actions column.
References
For information about how to configure a monitoring rule for a single table and how to configure a monitor, see Configure a monitoring rule for a single table.
For information about how to configure a monitoring rule for multiple tables at the same time and how to configure a monitor, see Configure a monitoring rule for multiple tables based on a template.
For information about how to view the details of a monitor, see View the details of a monitor.