This topic describes the diagnostic process, troubleshooting ideas, common inspection methods, and solutions for Nginx Ingress issues.
Contents
Category | Content |
Diagnostic process | |
Troubleshooting strategy | |
Common inspection methods | |
FAQ and solutions |
|
Background information
The Kubernetes community maintains the Nginx Ingress Controller. ACK optimizes the community version while maintaining full compatibility and supporting all community annotations.
For Nginx Ingress resources to work properly, you must deploy an Nginx Ingress Controller in the cluster to parse the Ingress forwarding rules. The Nginx Ingress Controller receives requests, matches them against the Ingress rules, and then forwards them to the corresponding backend Service pods for processing. In Kubernetes, the relationship among a Service, an Nginx Ingress, and the Nginx Ingress Controller is as follows:
A Service is an abstraction of backend services. One Service can represent multiple identical backend services.
An Nginx Ingress defines reverse proxy rules that specify which Service pods receive HTTP or HTTPS requests. For example, requests are routed to different Service pods based on the Host and URL path in each request.
The Nginx Ingress Controller is a component in the Kubernetes cluster that parses Nginx Ingress reverse proxy rules. When an Ingress is added, deleted, or modified, the Nginx Ingress Controller immediately updates its forwarding rules. When the controller receives a request, it forwards the request to the appropriate Service pod based on these rules.
The Nginx Ingress Controller retrieves Ingress resource changes from the API Server, dynamically generates configuration files required by the load balancer (such as nginx.conf), and reloads the load balancer (for example, by running nginx -s reload to reload Nginx) to apply new routing rules.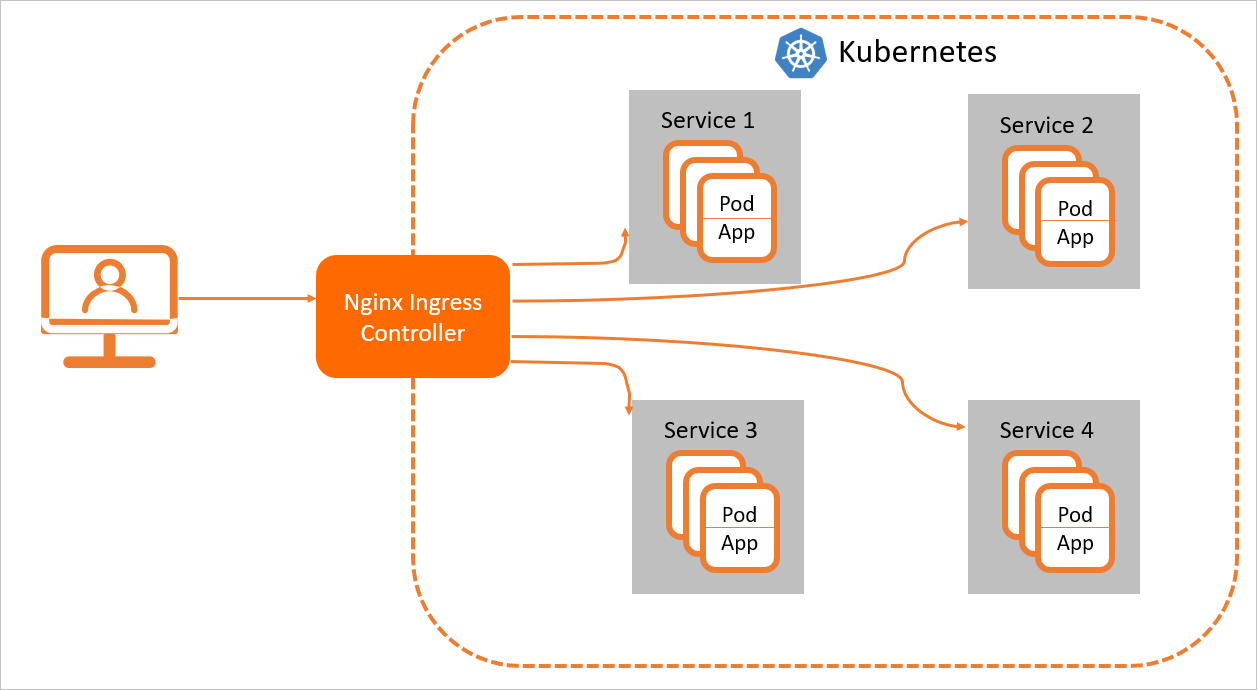
Diagnostic process
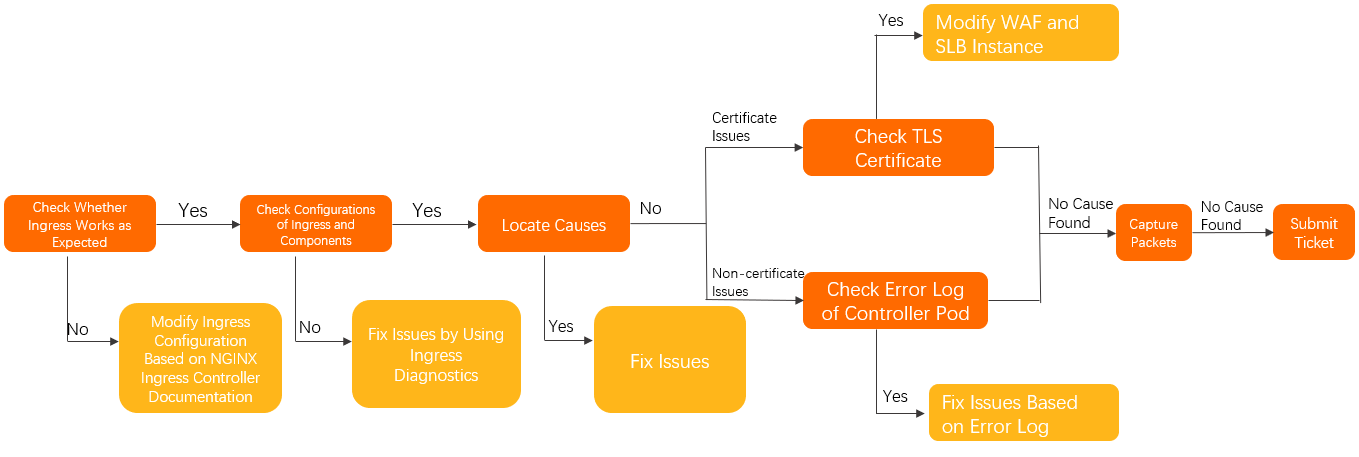
Follow these steps to check whether the issue is caused by the Ingress and to ensure that the Ingress Controller is configured correctly.
In the Controller pod, verify that access works as expected. For more information, see Manually access the Ingress and backend pods from the Controller pod.
Confirm that the Nginx Ingress Controller is used correctly. For more information, see the Nginx Ingress community documentation.
Use the Ingress diagnostics feature to check the Ingress and component configurations, and apply the recommended changes. For more information about the Ingress diagnostics feature, see Use the Ingress diagnostics feature.
Follow the Troubleshooting ideas to identify and resolve related issues.
If the issue persists, perform the following checks:
For HTTPS certificate issues:
Check whether WAF in transparent proxy mode is enabled for the domain name.
If it is enabled, confirm that no TLS certificate is configured for the WAF.
Otherwise, proceed to the next step.
Check whether the SLB instance uses a Layer 7 listener.
If it does, confirm that no TLS certificate is set for the Layer 7 listener of the SLB instance.
Otherwise, proceed to the next step.
For non-HTTPS certificate issues, check for error logs in the Controller pod. For more information, see Check for error logs in the Controller pod.
If the issue persists, capture packets in the Controller pod and the corresponding backend application pods to identify the problem. For more information, see Capture packets.
Troubleshooting ideas
Troubleshooting idea | Symptom | Link to solution |
Access failure | Cannot access the Ingress from a pod within the cluster | Cannot access the external address of a cluster LoadBalancer from within the cluster |
Cannot access the Ingress itself | ||
Cannot access TCP or UDP services | ||
HTTPS access issue | Certificate is not updated or the default certificate is returned | |
The | The SSL_ERROR_RX_RECORD_TOO_LONG error is reported for HTTPS access | |
Issue when adding an Ingress resource | The "failed calling webhook..." error is reported | The "failed calling webhook" error is reported when you create an Ingress resource |
An Ingress is added but does not take effect | ||
Unexpected access behavior | The client's source IP address cannot be obtained | Cannot preserve the originating IP address in an Ingress pod |
The source IP whitelist (whitelist-source-range) does not take effect or work as expected | ||
Cannot connect to a gRPC service exposed by an Ingress | ||
Phased release does not take effect | ||
Traffic is not distributed according to phased release rules or other traffic is affected | ||
The | ||
HTTP errors such as 502, 503, 413, and 499 occur | ||
Some resources fail to load when loading a page | A 404 error occurs when accessing resources after configuring | Some resources fail to load or a blank screen appears after rewriting to the root directory |
The |
Common inspection methods
Use the Ingress diagnostics feature
Log on to the ACK console. In the left navigation pane, click Clusters.
On the Clusters page, find the cluster you want and click its name. In the left navigation pane, choose .
On the Diagnostics page, click Ingress diagnosis.
In the Ingress diagnosis panel, click Diagnosis, then enter the URL of the Ingress that has an issue, such as https://www.example.com. Select I know and agree, then click Create diagnostics.
After the diagnosis is complete, resolve the issue based on the diagnostic results.
View access logs in the Controller pod using SLS
The access log format for the Ingress Controller is defined in the ConfigMap. The default ConfigMap is nginx-configuration in the kube-system namespace.
The default log format for the ACK Ingress Controller is:
$remote_addr - [$remote_addr] - $remote_user [$time_local]
    "$request" $status $body_bytes_sent "$http_referer" "$http_user_agent" $request_length
    $request_time [$proxy_upstream_name] $upstream_addr $upstream_response_length
$upstream_response_time $upstream_status $req_id $host [$proxy_alternative_upstream_name]If you change the log format, you must also change the log collection rules for SLS. Otherwise, log information cannot be correctly displayed in the SLS console. Modify the log format with caution.
The Ingress Controller logs in the SLS console are shown in the following figure. For more information, see Collect container logs from ACK clusters.
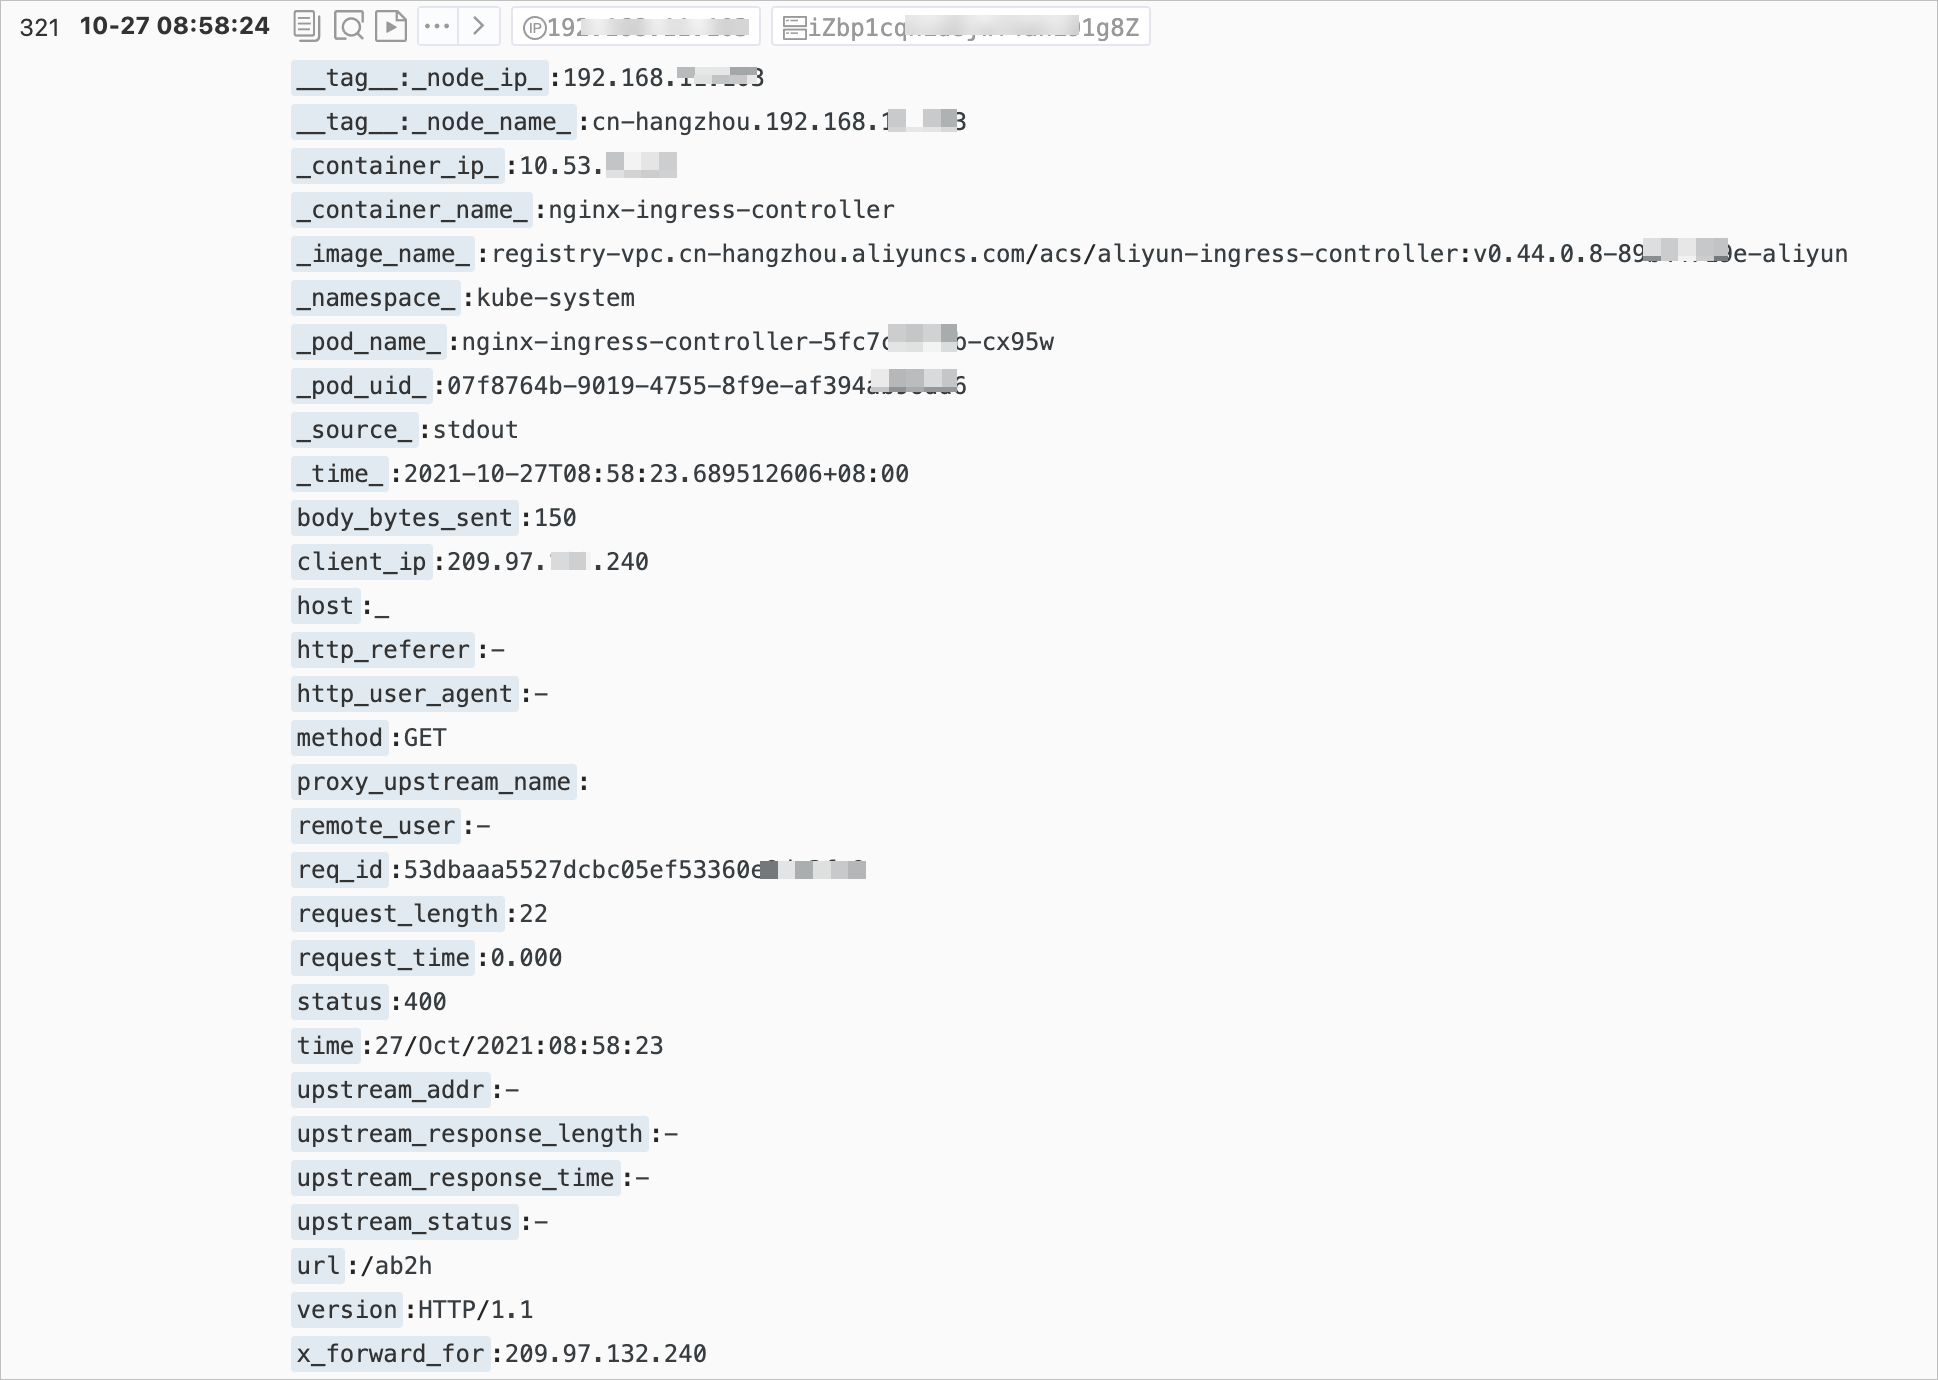
Some log fields in the SLS console have different names from the actual log fields. The following table describes the fields.
Field | Description |
| The real IP address of the client. |
| The request information, including the request method, URL, and HTTP version. |
| The total time for the request, from receiving the client request to sending the complete response. This value can be affected by factors such as client network conditions, and may not represent the actual processing speed of the request. |
| The address of the backend upstream. If the request does not reach the backend, this value is empty. If multiple upstreams are requested due to backend failures, this value is a comma-separated list. |
| The HTTP code returned by the backend upstream. If this value is a normal HTTP status code, it is returned by the backend upstream. If no backend is accessible, this value is 502. Multiple values are separated by commas (,). |
| The response time of the backend upstream, in seconds. |
| The name of the backend upstream. The naming convention is |
| The name of the backend alternative upstream. This value is not empty if the request is forwarded to an alternative upstream, such as a phased release service set using Canary. |
By default, you can also run the following command to view recent access logs directly in the container.
kubectl logs <controller pod name> -n <namespace> | lessExpected output:
42.11.**.** - [42.11.**.**]--[25/Nov/2021:11:40:30 +0800]"GET / HTTP/1.1" 200 615 "_" "curl/7.64.1" 76 0.001 [default-nginx-svc-80] 172.16.254.208:80 615 0.000 200 46b79dkahflhakjhdhfkah**** 47.11.**.**[]
42.11.**.** - [42.11.**.**]--[25/Nov/2021:11:40:31 +0800]"GET / HTTP/1.1" 200 615 "_" "curl/7.64.1" 76 0.001 [default-nginx-svc-80] 172.16.254.208:80 615 0.000 200 fadgrerthflhakjhdhfkah**** 47.11.**.**[]
Check for error logs in the Controller pod
You can use the logs in the Ingress Controller pod to narrow down the scope of the problem. Error logs in the Controller pod are categorized as follows:
Controller error logs: These logs are typically generated when the Ingress configuration is incorrect. Run the following command to filter for Controller error logs.
kubectl logs <controller pod name> -n <namespace> | grep -E ^[WE]NoteWhen the Ingress Controller starts, it generates several Warning-level errors. This is normal. For example, warning messages such as warnings about not specifying a kubeConfig or an Ingress class do not affect the normal operation of the Ingress Controller and can be ignored.
Nginx error logs: These logs are typically generated when an error occurs while processing a request. You can run the following command to filter for Nginx error logs.
kubectl logs <controller pod name> -n <namespace> | grep error
Manually access the Ingress and backend pods from the Controller pod
Run the following command to log on to the Controller pod.
kubectl exec <controller pod name> -n <namespace> -it -- bashTools such as curl and OpenSSL are pre-installed in the pod. You can use these tools to test connectivity and verify certificate configurations.
Run the following command to test whether the backend can be accessed through the Ingress.
# Replace your.domain.com with the actual domain name to be tested.
curl -H "Host: your.domain.com" http://127.0.**.**/ # for http
curl --resolve your.domain.com:443:127.0.0.1 https://127.0.0.1/ # for https
Run the following command to verify the certificate information.
openssl s_client -servername your.domain.com -connect 127.0.0.1:443Test whether you can access the backend pod.
NoteThe Ingress Controller does not access backend pods using the Service ClusterIP. Instead, it directly accesses the backend pod IP addresses.
Run the following command to obtain the backend pod IP address using kubectl.
kubectl get pod -n <namespace> <pod name> -o wideExpected output:
NAME                      READY    STATUS    RESTARTS   AGE    IP            NODE                        NOMINATED NODE    READINESS GATES
nginx-dp-7f5fcc7f-****    1/1      Running   0          23h    10.71.0.146   cn-beijing.192.168.**.**    <none>            <none>
From the expected output, the backend pod IP address is 10.71.0.146.
Run the following command to access the pod from the Controller pod to confirm that the connection from the Controller pod to the backend pod is working correctly.
curl http://<your pod ip>:<port>/path
Commands for troubleshooting Nginx Ingress
kubectl-plugin
The official Kubernetes Ingress controller was originally based on Nginx, but it switched to OpenResty in version 0.25.0. The controller listens for changes to Ingress resources on the API Server, automatically generates the corresponding Nginx configuration, and then reloads the configuration to apply the changes. For more information, see the official documentation.
As the number of Ingresses increases, all configurations are consolidated into a single Nginx.conf file. This makes the configuration file long and difficult to debug. Starting from version 0.14.0, the upstream part is dynamically generated using lua-resty-balancer, which further complicates debugging. To simplify the debugging of Ingress-nginx configurations, the community contributed a kubectl plug-in named ingress-nginx. For more information, see kubectl-plugin.
Run the following command to obtain information about the backend services that are known to the ingress-nginx controller.
kubectl ingress-nginx backends -n ingress-nginxdbg command
In addition to the kubectl-plugin, you can also use the
dbgcommand to view and diagnose related information.Run the following command to log on to the Nginx Ingress container.
kubectl exec -itn kube-system <nginx-ingress-pod-name> bashRun the
/dbgcommand. The following output is returned.nginx-ingress-controller-69f46d8b7-qmt25:/$ /dbg dbg is a tool for quickly inspecting the state of the nginx instance Usage: dbg [command] Available Commands: backends Inspect the dynamically-loaded backends information certs Inspect dynamic SSL certificates completion Generate the autocompletion script for the specified shell conf Dump the contents of /etc/nginx/nginx.conf general Output the general dynamic lua state help Help about any command Flags: -h, --help help for dbg --status-port int Port to use for the lua HTTP endpoint configuration. (default 10246) Use "dbg [command] --help" for more information about a command.
Check whether a certificate for a specific domain name exists.
/dbg certs get <hostname>View information about all current backend services.
/dbg backends all
Nginx Ingress status
Nginx includes a self-check module that outputs runtime statistics. In the Nginx Ingress container, you can run a curl command to access nginx_status on port 10246 to view Nginx request and connection statistics.
Run the following command to log on to the Nginx Ingress container.
kubectl exec -itn kube-system <nginx-ingress-pod-name> bashRun the following command to view the current request and connection statistics for Nginx.
nginx-ingress-controller-79c5b4d87f-xxx:/etc/nginx$ curl localhost:10246/nginx_status
Active connections: 12818
server accepts handled requests
 22717127 22717127 823821421
Reading: 0 Writing: 382 Waiting: 12483
Since the inception of Nginx, it has accepted 22,717,127 connections and handled 823,821,421 requests. This means that each connection has handled an average of approximately 36.2 requests.
Active connections: The total number of active connections on the Nginx server is 12,818.
Reading: The number of connections where Nginx is currently reading the request header is 0.
Writing: The number of connections where Nginx is currently sending a response is 382.
Waiting: The number of keep-alive connections is 12,483.
Capture packets
When you cannot locate the problem, capture packets for further diagnosis.
Based on the initial problem location, determine whether the network issue is in the Ingress pod or the application pod. If you do not have enough information, capture packets from both.
Log on to the node where the problematic application pod or Ingress pod is located.
On the ECS instance (not inside a container), run the following command to capture Ingress traffic information to a file.
tcpdump -i any host <application pod IP or Ingress pod IP> -C 20 -W 200 -w /tmp/ingress.pcapObserve the logs. When the expected error occurs, stop capturing packets.
Use the error messages in the application logs to locate the corresponding messages at the exact time of the error.
NoteUnder normal circumstances, packet capturing does not affect applications. It only slightly increases CPU load and disk writes.
The preceding command rotates the captured packets. It can write up to 200 .pcap files, each 20 MB in size.
Cannot access the external address of a cluster LoadBalancer from within the cluster
Symptom
In a cluster, some pods on certain nodes cannot access backend pods through the external address (SLB instance IP address) of the Nginx Ingress Controller, while others can.
Cause
This issue is caused by the externalTrafficPolicy configuration of the Controller's Service. This configuration determines how external traffic is handled. When set to local, only backend pods on the same node as the Controller's pod can receive requests. When set to cluster, access is successful. Requests from resources in the cluster that use the external LoadBalancer address to access the Service are also treated as external traffic.
Solution
(Recommended) Access the service within the Kubernetes cluster using its ClusterIP or the Ingress service name:
nginx-ingress-lb.kube-system.Run the
kubectl edit svc nginx-ingress-lb -n kube-systemcommand to modify the Ingress service. SetexternalTrafficPolicytoClusterin the LoadBalancer service. If the cluster's container network plugin is Flannel, the client's source IP address is lost. If you use Terway, the source IP address can be preserved.
Example:
apiVersion: v1
kind: Service
metadata:
  annotations:
    service.beta.kubernetes.io/backend-type: eni   # Direct ENI access.
  labels:
    app: nginx-ingress-lb
  name: nginx-ingress-lb
  namespace: kube-system
spec:
  externalTrafficPolicy: Cluster
For more information about Service annotations, see Configure a Classic Load Balancer (CLB) instance using annotations.
Cannot access the Ingress Controller itself
Symptom
For a Flannel cluster, when you access the Ingress from within its own pod using a domain name, SLB IP address, or ClusterIP, some or all requests fail.
Cause
The default configuration of Flannel does not allow loopback access.
Solution
(Recommended) If possible, recreate the cluster and use the Terway network plug-in. Migrate the existing cluster's applications to the Terway-mode cluster.
If you cannot recreate the cluster, you can resolve the issue by modifying the Flannel configuration to enable
hairpinMode. After modifying the configuration, recreate the Flannel pod for the changes to take effect.Run the following command to edit Flannel.
kubectl edit cm kube-flannel-cfg -n kube-systemIn the returned cni-conf.json, add
"hairpinMode": trueto thedelegatesection.Example:
cni-conf.json: |
    {
      "name": "cb0",
      "cniVersion":"0.3.1",
      "type": "flannel",
      "delegate": {
        "isDefaultGateway": true,
        "hairpinMode": true
      }
    }
Run the following command to delete and recreate Flannel.
kubectl delete pod -n kube-system -l app=flannel
A TLS certificate is added or modified in the cluster, but the default or old certificate is still used for access
Symptom
After you add or modify a Secret in the cluster and specify the secretName in the Ingress, accessing the Ingress still uses the default certificate (Kubernetes Ingress Controller Fake Certificate) or the old certificate.
Cause
The certificate is not returned by the Ingress Controller within the cluster.
The certificate is invalid and was not loaded correctly by the Controller.
The Ingress Controller returns the corresponding certificate based on Server Name Indication (SNI), but the SNI may not have been included during the TLS handshake.
Solution
Use one of the following methods to confirm whether the SNI field was included when establishing the TLS connection:
Use a newer version of a browser that supports SNI.
When using the
openssl s_clientcommand to test the certificate, include the-servernameparameter.When using the
curlcommand, add a hosts entry or use the--resolveparameter to map the domain name, instead of using the IP address and Host request header method.
Confirm that no TLS certificate is set for WAF, WAF in transparent proxy mode, or the SLB Layer 7 listener. The TLS certificate should be returned by the Ingress Controller within the cluster.
Perform an Ingress diagnosis in the ACK console to check for configuration errors and error logs. For more information, see Use the Ingress diagnostics feature.
Run the following command to manually view the Ingress pod error logs and apply fixes based on the logs.
kubectl logs <ingress pod name> -n <pod namespace> | grep -E ^[EW]
Cannot connect to a gRPC service exposed by an Ingress
Symptom
Cannot access a gRPC service behind an Ingress.
Cause
The annotation specifying the backend protocol type is not set in the Ingress resource.
The gRPC service can only be accessed through a TLS port.
Solution
Set the annotation in the corresponding Ingress resource:
nginx.ingress.kubernetes.io/backend-protocol:"GRPC".Confirm that the client is using the TLS port and encrypting the traffic when sending requests.
Cannot connect to a backend HTTPS service
Symptom
Cannot access a backend HTTPS service through an Ingress.
The response may be a 400 error with the message
The plain HTTP request was sent to HTTPS port.
Cause
The request from the Ingress Controller to the backend pod uses the default HTTP protocol.
Solution
Set the annotation in the Ingress resource: nginx.ingress.kubernetes.io/backend-protocol:"HTTPS".
Cannot preserve the originating IP address in an Ingress pod
Symptom
The client's real IP address cannot be preserved in the Ingress pod. It appears as the node IP address, an address in the 100.XX.XX.XX range, or another address.
Cause
externalTrafficPolicyin the Service used by the Ingress is set toCluster.A Layer 7 proxy is used on the SLB instance.
WAF in transparent proxy mode is used.
Solution
For cases where
externalTrafficPolicyis set toClusterand a Layer 4 SLB instance is used at the frontend.You can change
externalTrafficPolicytoLocal. However, this may cause attempts to access the Ingress using the SLB IP address from within the cluster to fail. For a solution, see Cannot access the external address of a cluster LoadBalancer from within the cluster.For cases where a Layer 7 proxy (Layer 7 SLB, WAF, or WAF in transparent proxy mode) is used, follow these steps:
Ensure that a Layer 7 proxy is used and the X-Forwarded-For request header is enabled.
In the Ingress Controller's ConfigMap (default is nginx-configuration in the kube-system namespace), add
enable-real-ip: "true".Observe the logs to verify if the source IP address can be obtained.
For long link paths with multiple forwards (for example, an additional reverse proxy service is configured in front of the Ingress Controller), you can observe the value of
remote_addrin the logs after enablingenable-real-ipto determine if the real IP address is passed to the Ingress container through the X-Forwarded-For request header. If not, ensure that the client's real IP address is carried using methods such as X-Forwarded-For before the request reaches the Ingress Controller.
Phased release rules do not take effect
Symptom
Phased release is set up in the cluster, but the phased release rules do not take effect.
Cause
There are two possible reasons:
When using
canary-*related annotations,nginx.ingress.kubernetes.io/canary: "true"is not set.When using
canary-*related annotations with Nginx Ingress Controller versions before 0.47.0, you must specify your application domain name in the Host field of the Ingress rule. It cannot be empty.
Solution
Based on the causes, modify
nginx.ingress.kubernetes.io/canary: "true"or the Host field in the Ingress rule. For more information, see Routing rules.If the preceding situations do not apply, see Traffic is not distributed based on phased release rules or other traffic is routed to the phased release service.
Traffic is not distributed based on phased release rules or other traffic is routed to the phased release service
Symptom
Phased release rules are set, but traffic is not distributed according to the rules, or traffic from other normal Ingresses is routed to the phased release service.
Cause
In the Nginx Ingress Controller, phased release rules are not applied to a single Ingress. Instead, they are applied to all Ingresses that use the same Service.
For more information about this issue, see Ingress with canary annotation will affect all ingresses with the same service.
Solution
For Ingresses that require phased release (including those using service-match and canary-* related annotations), create separate services (both a production and a phased release service) that point to the original pods. Then, enable phased release for that Ingress. For more information, see Implement phased releases and blue-green deployments using Nginx Ingress.
The "failed calling webhook" error is reported when you create an Ingress resource
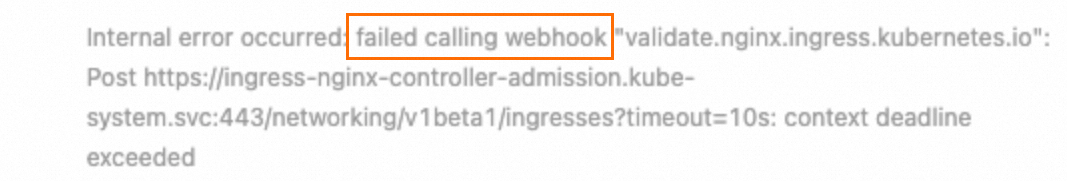
Symptom
When adding an Ingress resource, the message "Internal error occurred: failed calling webhook..." is displayed, as shown in the following figure.
Cause
When an Ingress resource is added, its validity must be verified by a service (by default, ingress-nginx-controller-admission). If there is a problem with the link (for example, the service is deleted or the Ingress controller is deleted), the verification fails, and the Ingress resource cannot be added.
Solution
Check the webhook link to ensure that all resources exist and are working correctly. The link is ValidatingWebhookConfiguration -> Service -> Pod.
Confirm that the admission feature of the Ingress Controller pod is enabled and that the pod can be accessed from the outside.
If the Ingress Controller has been deleted or the webhook feature is not needed, delete the ValidatingWebhookConfiguration resource.
The SSL_ERROR_RX_RECORD_TOO_LONG error is reported for HTTPS access
Symptom
When accessing via HTTPS, the error SSL_ERROR_RX_RECORD_TOO_LONG or routines:CONNECT_CR_SRVR_HELLO:wrong version number is reported.
Cause
An HTTPS request is accessing a non-HTTPS port, such as an HTTP port.
Common causes are as follows:
Port 443 of the SLB instance is bound to port 80 of the Ingress pod.
Port 443 of the Service corresponding to the Ingress Controller is mapped to port 80 of the Ingress pod.
Solution
Modify the SLB settings or Service settings as needed to ensure that HTTPS can access the correct port.
Common HTTP error codes appear
Symptom
The request returns a non-2xx or non-3xx status code, such as 502, 503, 413, or 499.
Cause and solution
Check the logs to determine if the error was returned by the Ingress Controller. For more information, see View access logs in the Controller pod using SLS. If so, refer to the following solutions:
413 Error
Cause: The size of the request data exceeds the configured limit.
Solution: Run
kubectl edit cm -n kube-system nginx-configurationto modify the Controller configuration. Adjust the values ofnginx.ingress.kubernetes.io/client-max-body-sizeandnginx.ingress.kubernetes.io/proxy-body-sizeas needed. The default value is20m.
499 Error
Cause: The client disconnected before the server could send a response. This is not necessarily an issue with the component or the backend application.
Solution:
A small number of 499 errors may be normal depending on the application and can be ignored.
If many 499 errors occur, check whether the backend application processing time and the frontend request timeout are as expected.
502 error
Cause: The Nginx Ingress is functioning correctly, but the Nginx Ingress pod cannot connect to the target backend pod.
Solution:
Persistent issues:
It may be due to incorrect configuration in the backend Service and pod. Check the port configuration of the backend Service and the application code in the container.
Intermittent issues
It may be due to high load on the Nginx Ingress Controller's pod. Assess the load by checking the number of requests and connections on the Controller's SLB instance, and add more resources to the Controller if necessary. For more information, see "Deploy a highly available Nginx Ingress Controller".
It may be because the backend pod actively closes the session. The Nginx Ingress Controller enables persistent connections by default. Ensure that the idle timeout for persistent connections on the backend is greater than the Controller's idle timeout (default: 900 seconds).
If none of these methods identify the problem, analyze the captured packets.
503 Error
Cause: The Ingress Controller cannot find an available backend pod to route the request to.
Solution:
Uncommon scenarios
See the solution for the 502 error.
Check the readiness status of the backend application and configure a reasonable health check.
If the error is persistent:
Check whether the backend Service is configured correctly and whether an Endpoint exists.
The net::ERR_HTTP2_SERVER_REFUSED_STREAM error occurs
Symptom
When accessing a webpage, some resources fail to load correctly, and the console shows a net::ERR_HTTP2_SERVER_REFUSED_STREAM or net::ERR_FAILED error.
Cause
The number of parallel resource requests is high, reaching the HTTP/2 maximum concurrent streams limit.
Solution
(Recommended) In the ConfigMap, increase the value of
http2-max-concurrent-streamsas needed. The default is 128. For more information, see http2-max-concurrent-streams.In the ConfigMap, disable HTTP/2 support by setting
use-http2tofalse. For more information, see use-http2.
The "The param of ServerGroupName is illegal" error occurs
Cause
The format for generating ServerGroupName is namespace+svcName+port. The server group name must be 2 to 128 characters in length, must start with a letter or a Chinese character, and can contain digits, periods (.), underscores (_), and hyphens (-).
Solution
Modify the name to comply with the server group naming requirements.
The "certificate signed by unknown authority" error is reported when you create an Ingress
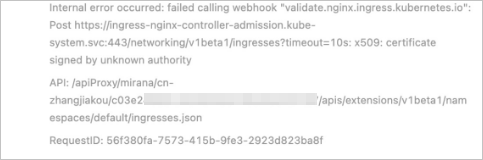
Cause
When you create an Ingress, the error shown in the preceding figure occurs. This is because multiple Ingress controllers are deployed, and they use the same resources (which may include Secrets, services, webhook configurations, and so on). This causes the SSL certificate used during webhook execution to be inconsistent with the backend service, resulting in an error.
Solution
Redeploy the two Ingress controllers and ensure that their resources do not overlap. For information about the resources included in an Ingress, see What updates are made to the system when I upgrade the Nginx Ingress Controller component in ACK component management?
An Ingress pod restarts because its health check fails
Symptom
The Controller pod fails its health check and restarts.
Cause
The Ingress pod or its node has a high load, causing the health check to fail.
The
tcp_tw_reuseortcp_timestampskernel parameter is set on the cluster node, which may cause the health check to fail.
Solution
Scale out the Ingress pod and observe if the issue persists. For more information, see Highly available deployment of Nginx Ingress Controller.
Disable
tcp_tw_reuseor set it to 2, and also disabletcp_timestamps. Then, observe if the issue persists.
Add TCP and UDP services
In the corresponding ConfigMap (by default, tcp-services and udp-services in the kube-system namespace), add the corresponding entry.
For example, to map port 8080 of example-go in the default namespace to port 9000, see the following example.
apiVersion: v1
kind: ConfigMap
metadata:
  name: tcp-services
  namespace: ingress-nginx
data:
  9000: "default/example-go:8080"  # Map port 8080 to port 9000.
In the Ingress deployment (by default, nginx-ingress-controller in the kube-system namespace), add the mapped port.
In the Service corresponding to the Ingress, add the mapped port.
For more information about adding TCP and UDP services, see Exposing TCP and UDP services.
Ingress rules do not take effect
Symptom
Ingress rules are added or modified but do not take effect.
Cause
An error in the Ingress configuration prevents new Ingress rules from being loaded correctly.
The Ingress resource is configured incorrectly and does not match the expected configuration.
There is a permission issue with the Ingress Controller, preventing it from monitoring Ingress resource changes correctly.
An old Ingress uses a
server-aliasconfiguration for a domain name that conflicts with the new Ingress, causing the rule to be ignored.
Solution
Use the Ingress diagnostics tool in the ACK console to diagnose the issue and follow the prompts. For more information, see Use the Ingress diagnostics feature.
Check for configuration errors or conflicts in the old Ingress:
For non-
rewrite-targetcases where a regular expression is used in the path, confirm that the annotationnginx.ingress.kubernetes.io/use-regex: "true"is configured.Check if the PathType matches the expectation. By default,
ImplementationSpecifichas the same effect asPrefix.
Confirm that the ClusterRole, ClusterRoleBinding, Role, RoleBinding, and ServiceAccount associated with the Ingress Controller all exist. The default name for these resources is ingress-nginx.
Log on to the Controller pod and view the added rules in the nginx.conf file.
Run the following command to manually view the container logs and identify the problem.
kubectl logs <ingress pod name> -n <pod namespace> | grep -E ^[EW]
Some resources fail to load or a blank screen appears after rewriting to the root directory
Symptom
After rewriting access using the Ingress rewrite-target annotation, some page resources fail to load, or a blank screen appears.
Cause
rewrite-targetmay not be configured with a regular expression.The resource request path in the application is hardcoded to the root directory.
Solution
Check if
rewrite-targetis used with a regular expression and a capturing group. For more information, see Rewrite.Check if the frontend request is accessing the correct path.
How to fix abnormal log parsing in SLS after an upgrade
Symptom
There are two main versions of the ingress-nginx-controller component: 0.20 and 0.30. After upgrading from version 0.20 to 0.30 through the Add-ons page in the console, the Ingress Dashboard may not correctly display the actual backend service access status when using the Ingress phased release or blue-green deployment features.
Cause
Because the default output formats of versions 0.20 and 0.30 are different, the Ingress Dashboard may not correctly display the actual backend service access status when using the Ingress phased release or blue-green deployment features.
Solution
Perform the following steps to fix the issue by updating the nginx-configuration configmap and k8s-nginx-ingress configurations.
Update the
nginx-configuration configmap.If you have not modified the
nginx-configuration configmap, save the following content asnginx-configuration.yamland then run thekubectl apply -f nginx-configuration.yamlcommand to deploy it.apiVersion: v1 kind: ConfigMap data: allow-backend-server-header: "true" enable-underscores-in-headers: "true" generate-request-id: "true" ignore-invalid-headers: "true" log-format-upstream: $remote_addr - [$remote_addr] - $remote_user [$time_local] "$request" $status $body_bytes_sent "$http_referer" "$http_user_agent" $request_length $request_time [$proxy_upstream_name] $upstream_addr $upstream_response_length $upstream_response_time $upstream_status $req_id $host [$proxy_alternative_upstream_name] max-worker-connections: "65536" proxy-body-size: 20m proxy-connect-timeout: "10" reuse-port: "true" server-tokens: "false" ssl-redirect: "false" upstream-keepalive-timeout: "900" worker-cpu-affinity: auto metadata: labels: app: ingress-nginx name: nginx-configuration namespace: kube-systemIf you have modified the
nginx-configuration configmap, run the following command to fix it to avoid overwriting your configuration:kubectl edit configmap nginx-configuration -n kube-system
At the end of the
log-format-upstreamfield, add[$proxy_alternative_upstream_name], then save and exit.Update the
k8s-nginx-ingressconfiguration.Save the following content as a
k8s-nginx-ingress.yamlfile, then run thekubectl apply -f k8s-nginx-ingress.yamlcommand to deploy it.
The "cannot list/get/update resource" error occurs
Symptom
You can find Controller error logs in the pod using the method described in Check for error logs in the Controller pod. The logs are similar to the following:
User "system:serviceaccount:kube-system:ingress-nginx" cannot list/get/update resource "xxx" in API group "xxx" at the cluster scope/ in the namespace "kube-system"Cause
The Nginx Ingress Controller lacks the necessary permissions to update the relevant resources.
Solution
Based on the log, determine whether the issue is caused by a ClusterRole or a Role.
If the log contains
at the cluster scope, the issue is with the ClusterRole (ingress-nginx).If the log contains
in the namespace "kube-system", the issue is with the Role (kube-system/ingress-nginx).
Confirm that the corresponding permissions and permission bindings are complete.
For a ClusterRole:
Ensure that the ClusterRole
ingress-nginxand ClusterRoleBindingingress-nginxexist. If not, create them, restore them, or uninstall and reinstall the component.Ensure that the ClusterRole
ingress-nginxincludes the permission corresponding to the log (in the example, the List permission for networking.k8s.io/ingresses). If the permission does not exist, manually add it to the ClusterRole.
For a Role:
Confirm that the Role
kube-system/ingress-nginxand RoleBindingkube-system/ingress-nginxexist. If not, you can create them, restore them, or uninstall and reinstall the component.Confirm that the Role
ingress-nginxincludes the permission corresponding to the log (in the example, the Update permission for the ConfigMapingress-controller-leader-nginx). If the permission does not exist, manually add it to the Role.
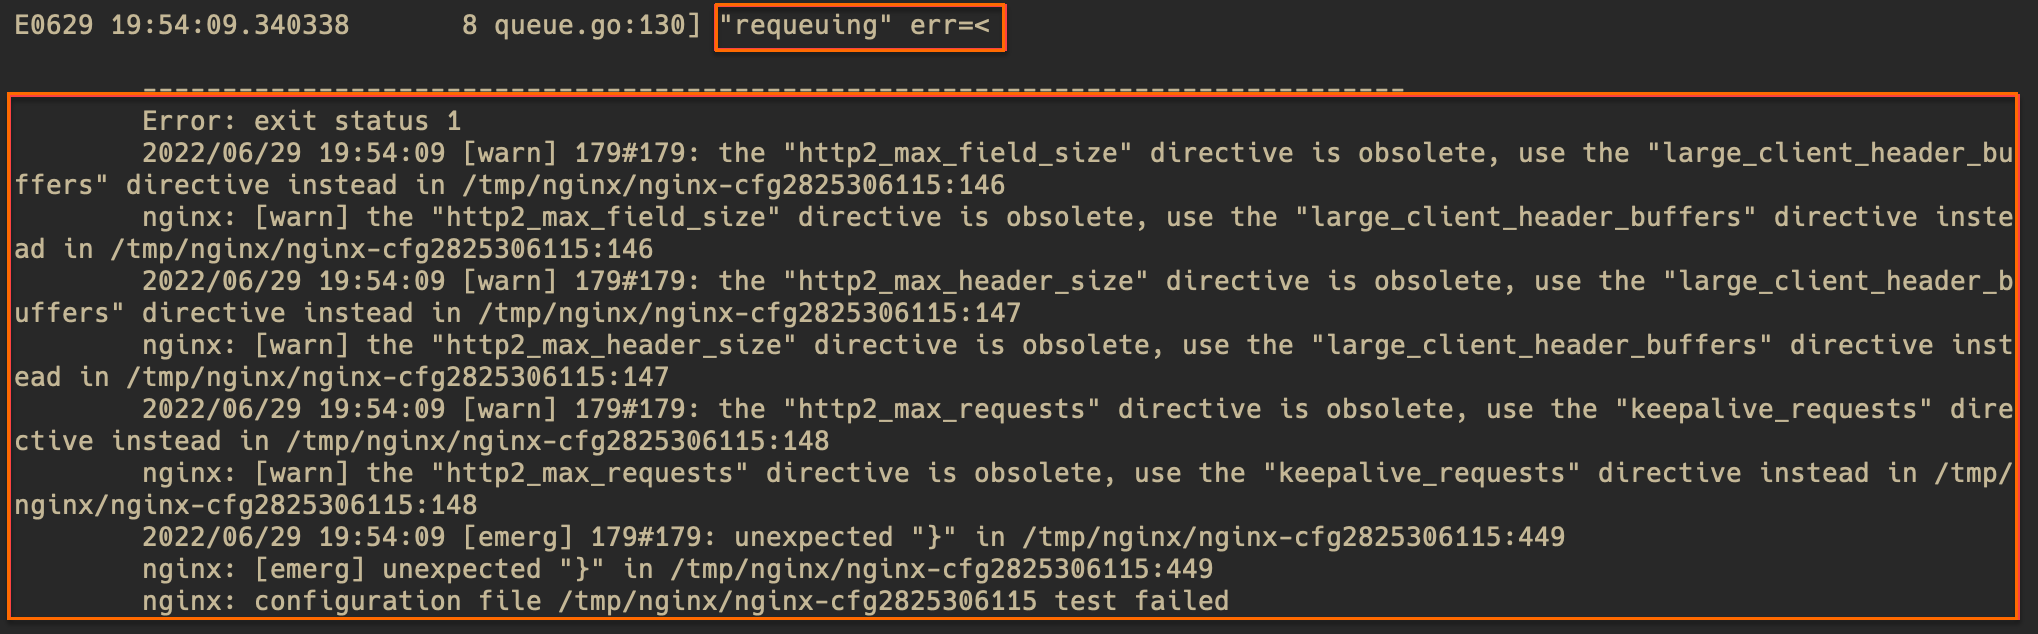
The "configuration file failed" error occurs
Symptom
You can find Controller error logs in the pod using the method described in Check for error logs in the Controller pod. The logs are similar to the following:
requeuing……nginx: configuration file xxx test failed (multiple lines)Cause
A configuration error caused the Nginx configuration reload to fail. This is usually caused by a syntax error in a snippet inserted into an Ingress rule or ConfigMap.
Solution
Check the error message in the logs (warning level messages can be ignored) to roughly locate the problem. If the error message is not clear, use the file line number from the error message to view the corresponding file in the pod. In the following example, the file is /tmp/nginx/nginx-cfg2825306115 and the line is 449.
Run the following command to check for errors in the configuration near the corresponding line.
# Run the command in the pod.
kubectl exec -n <namespace> <controller pod name> -it -- bash
# View the error file with line numbers and check for errors in the configuration near the corresponding line.
cat -n /tmp/nginx/nginx-cfg2825306115
Based on the error message and the configuration file, locate the cause of the error and fix it according to your actual configuration.
The "Unexpected error validating SSL certificate" error occurs
Symptom
You can find Controller error logs in the pod using the method described in Check for error logs in the Controller pod. The logs are similar to the following:
Unexpected error validating SSL certificate "xxx" for server "xxx"
Cause
The certificate is configured incorrectly. A common reason for this is that the domain name included in the certificate does not match the domain name configured in the Ingress. Some Warning-level logs, such as a certificate not having a SAN extension, do not affect the normal use of the certificate. Determine if there is a problem based on the actual situation.
Solution
Check the certificate issue in the cluster based on the error message.
Are the format and content of the certificate's cert and key correct?
Does the domain name included in the certificate match the domain name configured in the Ingress?
Has the certificate expired?
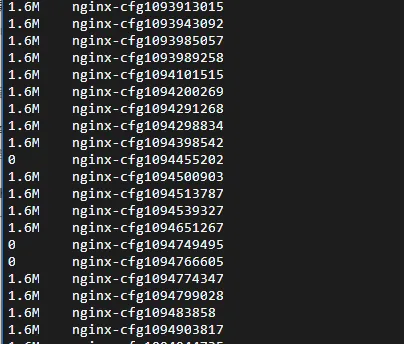
Many configuration files are not cleared from the Controller
Symptom
In earlier versions (before 1.10) of Nginx Ingress Controller, there is a known bug. Under normal circumstances, generated nginx-cfg files should be cleared promptly. However, if an Ingress configuration is incorrect and causes an error in the rendered nginx.conf file, these incorrect configuration files are not cleared as expected. This causes nginx-cfgxxx files to accumulate and consume a large amount of disk space.
Cause
The cause is a flaw in the cleanup logic. Although correctly generated configuration files are cleaned up properly, the cleanup mechanism does not work for invalid configuration files, causing them to remain in the system. For more information, see GitHub Issue #11568 in the community.
Solution
To resolve this issue, consider the following solutions.
Upgrade Nginx Ingress Controller: We recommend that you upgrade Nginx Ingress Controller to version 1.10 or later. For more information, see Upgrade the Nginx Ingress Controller component.
Manually clear old files: Periodically delete the uncleared
nginx-cfgxxxfiles. You can write a script to automate this process and reduce the manual workload.Check for configuration errors: Before applying a new Ingress configuration, carefully check its correctness to avoid generating invalid configuration files.
Troubleshoot the issue where a pod remains in the Pending state after a Controller upgrade
Symptom
When you upgrade the Nginx Ingress Controller, the pod may fail to be scheduled, causing it to remain in the Pending state for a long time.
Cause
When you upgrade the Nginx Ingress Controller, the new version of the pod may fail to be scheduled because of the default node affinity and pod anti-affinity rules. Ensure that there are sufficient available resources in the cluster.
You can use the following commands to view the specific cause:
kubectl -n kube-system describe pod <pending-pod-name>kubectl -n kube-system get eventsSolution
To resolve this issue, consider the following solutions.
Scale out cluster resources: Add new nodes to meet the affinity rule requirements. For more information, see Manually scale a node pool.
Adjust affinity: In resource-constrained situations, run the
kubectl edit deploy nginx-ingress-controller -n kube-systemcommand to relax the anti-affinity requirements, allowing pods to be scheduled on the same node. This method may reduce the high availability of the component.
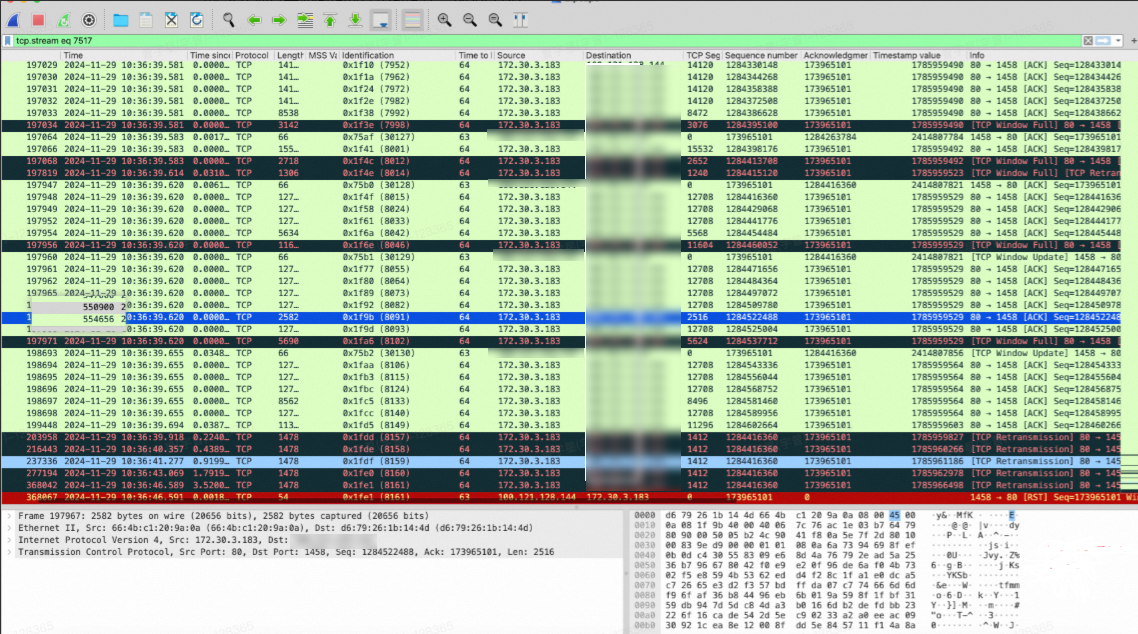
TCP session conflict occurs when multiple CLB instances are used for Nginx Ingress in a high-concurrency Flannel CNI and IPVS cluster
Symptom
In an ACK cluster that uses the Flannel CNI and IPVS network mode, if the Nginx Ingress Controller is bound to multiple Classic Load Balancer (CLB) instances, TCP stream confusion may occur in high-concurrency situations. Packet capture may reveal the following anomalies.
Packet retransmission
Abnormal TCP connection reset
Cause
In an ACK cluster configured with the Flannel network plug-in, the CLB instance forwards traffic to the NodePort of the node where the Nginx Ingress Controller is located. However, if multiple services use different NodePorts, IPVS session conflicts may occur in high-concurrency scenarios.
Solution
Single load balancer strategy: Create only one LoadBalancer Service for the Nginx Ingress Controller. Configure other CLB instances manually to bind to the node's NodePort to reduce the possibility of conflicts.
Avoid multiple NodePorts being active simultaneously: On the same node, try to avoid having multiple NodePorts active at the same time to reduce the risk of IPVS session conflicts.