This guide covers the key alert metrics, recommended configurations, and remediation steps for monitoring Realtime Compute for Apache Flink jobs in production. Use it to detect and respond to job failures, data delays, and resource bottlenecks before they affect your SLA.
Prerequisites
Before you begin, complete the setup described in Configure monitoring and alerting. Choose the monitoring tool that matches your workspace configuration.
Multi-metric alerting in ARMS (Application Real-Time Monitoring Service) requires custom PromQL. For simpler setup, use CloudMonitor instead.
Recommended alert rules
The following table summarizes the alerts covered in this guide. Configure them in priority order — P0 alerts indicate immediate job impact, while P2 alerts indicate emerging resource pressure.
<table> <thead> <tr> <td> <p><b>Scenario</b></p> </td> <td> <p><b>Metric or event</b></p> </td> <td> <p><b>Trigger condition</b></p> </td> <td> <p><b>Level</b></p> </td> <td> <p><b>Action</b></p> </td> </tr> </thead> <colgroup></colgroup> <colgroup></colgroup> <colgroup></colgroup> <colgroup></colgroup> <colgroup></colgroup> <tbody> <tr> <td> <p><a href="#e7130392f32oe">Job failure</a></p> </td> <td> <p>Job status event</p> </td> <td> <p>= FAILED (event alerting)</p> </td> <td> <p>P0</p> </td> <td> <p>1. Check whether the restart strategy is misconfigured. Use the default settings unless you have a specific reason to override them.</p> <p>2. Determine whether the failure is caused by the restart strategy or by an abnormal JobManager or TaskManager.</p> <p>3. Restore the job from the latest snapshot or successful checkpoint.</p> </td> </tr> <tr> <td> <p><a href="#0056509ea2937">Failover surge</a></p> </td> <td> <p>Overview/Number of error recoveries per minute for the job</p> </td> <td> <p>≥ 1 for 1 consecutive period</p> </td> <td> <p>P0</p> </td> <td> <p>1. Identify the root cause.</p> <ul> <li> <p>Analyze failover, JobManager, and TaskManager logs.</p> </li> <li> <p><b>Ignore</b>: Infrequent, auto-recoverable machine failures.</p> </li> <li> <p><b>Fix</b>: Code bugs, resource bottlenecks, or configuration errors.</p> </li> </ul> <p>2. Restore the job from the latest snapshot or successful checkpoint.</p> </td> </tr> <tr> <td> <p><a href="#5435fcd4abo9e">Consecutive checkpoint failures</a></p> </td> <td> <p>Number of successful checkpoints (5 min cumulative)</p> </td> <td> <p>≤ 0 for 1 consecutive period</p> </td> <td> <p>P0</p> </td> <td> <p>1. See <a href="https://www.alibabacloud.com/help/en/document_detail/414257.html#caf8e65a8awv1">System checkpoints</a> to identify the root cause.</p> <p>2. Act on the cause.</p> <ul> <li> <p>Configuration issue (such as timeout): Adjust the checkpoint settings.</p> </li> <li> <p>Resource pressure (such as backpressure): Use <a href="https://www.alibabacloud.com/help/en/document_detail/2536572.html">dynamic scaling</a> to add resources to the backpressured operator.</p> </li> </ul> <p>3. Dynamically update the configuration or restore the job from the latest successful checkpoint.</p> </td> </tr> <tr> <td> <p><a href="#c339292e4e6p7">High business latency (with incoming data)</a></p> </td> <td> <p>Overview/Business latency && Records in from source per second</p> </td> <td> <p>Maximum latency ≥ 180000</p> <p>Input records ≥ 0</p> <p>for 3 consecutive periods</p> </td> <td> <p>P1</p> </td> <td> <p>1. See <a href="https://www.alibabacloud.com/help/en/document_detail/2543043.html">Metric description</a> to investigate the cause.</p> <ul> <li> <p><b>Data plane</b>: Are event timestamps out of order?</p> </li> <li> <p><b>Traffic</b>: Is there an upstream surge or downstream backpressure?</p> </li> </ul> <p>2. Act on the cause.</p> <ul> <li> <p><b>Internal</b>: Adjust connector WITH parameters and scale out the bottleneck operator.</p> </li> <li> <p><b>External</b>: Optimize external service settings, such as adjusting throttling policies or increasing connection limits.</p> </li> </ul> </td> </tr> <tr> <td> <p><a href="#ff3815bfc11gq">Upstream data interruption</a></p> </td> <td> <p>Overview/Records in from source per second && Source Raw Data Timestamp</p> </td> <td> <p>Input records ≤ 0 (business-dependent)</p> <p>Maximum idle time ≥ 60000</p> <p>for 5 consecutive periods</p> </td> <td> <p>P1</p> </td> <td> <p>1. Check taskmanager.log, flame graphs, and upstream service metrics to confirm the cause: no upstream data, throttling, an error, or a stalled thread stack.</p> <p>2. Act on the cause.</p> <ul> <li> <p><b>Connector issue:</b> Adjust connector parameters such as timeout or concurrency, or add TaskManager resources.</p> </li> <li> <p><b>Upstream or downstream service issue:</b> Notify the upstream team to investigate.</p> </li> <li> <p><b>Flink internal bottleneck</b> (such as backpressure or a freeze): Resolve the root cause first, then restart the job from the latest checkpoint.</p> </li> </ul> </td> </tr> <tr> <td> <p><a href="#10fd3e302b76j">No downstream output</a></p> </td> <td> <p>Overview/Records out to sink per second</p> </td> <td> <p>≤ 0 for 5 consecutive periods</p> </td> <td> <p>P1</p> </td> <td> <p>1. Confirm whether data reaches the sink operator.</p> <ul> <li> <p><b>Business logic filtering</b>: Check logs or metrics to determine whether all input was filtered out.</p> </li> <li> <p><b>Late data discard</b>: Check watermark and window settings to determine whether data was discarded as late arrivals.</p> </li> </ul> <p>2. Confirm whether the sink can write to the external system.</p> <ul> <li> <p><b>Connection layer</b>: Is the connection pool full? Is network connectivity normal?</p> </li> <li> <p><b>Target system</b>: Does the downstream database or service have a locked table, insufficient disk space, write throttling, or other errors?</p> </li> </ul> <p>3. As a temporary measure, enable dual-write to a backup storage system.</p> </td> </tr> <tr> <td> <p><a href="#1e5b7fcf1cdsj">CPU bottleneck</a></p> </td> <td> <p>CPU/CPU utilization of a single TM</p> </td> <td> <p>≥ 85% for 10 consecutive periods</p> </td> <td> <p>P2</p> </td> <td> <p>1. Use flame graphs or the Flink UI to locate the hot-spot operator.</p> <ul> <li> <p><b>Business logic</b>: Check for complex calculations, JSON parsing, or inefficient user-defined functions (UDFs).</p> </li> <li> <p><b>Data skew</b>: Check whether a hot-spot key is overloading a single task with excessive data volume.</p> </li> <li> <p><b>Insufficient resources</b>: Determine whether the current degree of parallelism and TaskManager resources can handle the traffic, and whether there is severe backpressure.</p> </li> <li> <p><b>Frequent GC</b>: Check logs or JVM metrics to determine whether memory pressure is triggering frequent Full GCs.</p> </li> </ul> <p>2. Increase the degree of parallelism for the bottleneck operator, or allocate more CPU cores to the TaskManager.</p> </td> </tr> <tr> <td> <p><a href="#5d68057bafc8w">Memory bottleneck</a></p> </td> <td> <p>TM heap memory used</p> </td> <td> <p>≥ 90% for 10 consecutive periods</p> </td> <td> <p>P2</p> </td> <td> <p>1. Check GC logs to identify the problem type.</p> <ul> <li> <p><b>Memory leak</b>: Heap memory does not return to baseline after GC and the baseline keeps rising.</p> </li> <li> <p><b>Insufficient capacity</b>: Heap usage stays consistently high, triggering frequent Full GCs and degrading performance.</p> </li> <li> <p><b>Sudden OutOfMemoryError (OOM)</b>: Memory fills instantly when processing a specific record or batch.</p> </li> </ul> <p>2. Increase heap size or increase the degree of parallelism to reduce the data volume per slot.</p> </td> </tr> </tbody> </table>
Job availability
Job failure alert
Configure a P0 alert that fires immediately when a job transitions to the FAILED state, so you can restore service before the failure cascades.
Metric: Job status event = FAILED
Notification: Phone call, text message, email, and webhook (Critical)
When this alert fires:
-
Check whether the restart strategy is misconfigured. Use the default settings unless you have a specific reason to override them.
-
Determine whether the failure is caused by the restart strategy or by an abnormal JobManager or TaskManager.
-
Restore the job from the latest snapshot or successful checkpoint.
Configure in ARMS
-
Log in to the Realtime Compute for Apache Flink console. In the Actions column of your workspace, click Console.
-
On the Operation Center > Job O&M page, click the target job.
-
Click the Alert Configuration tab.

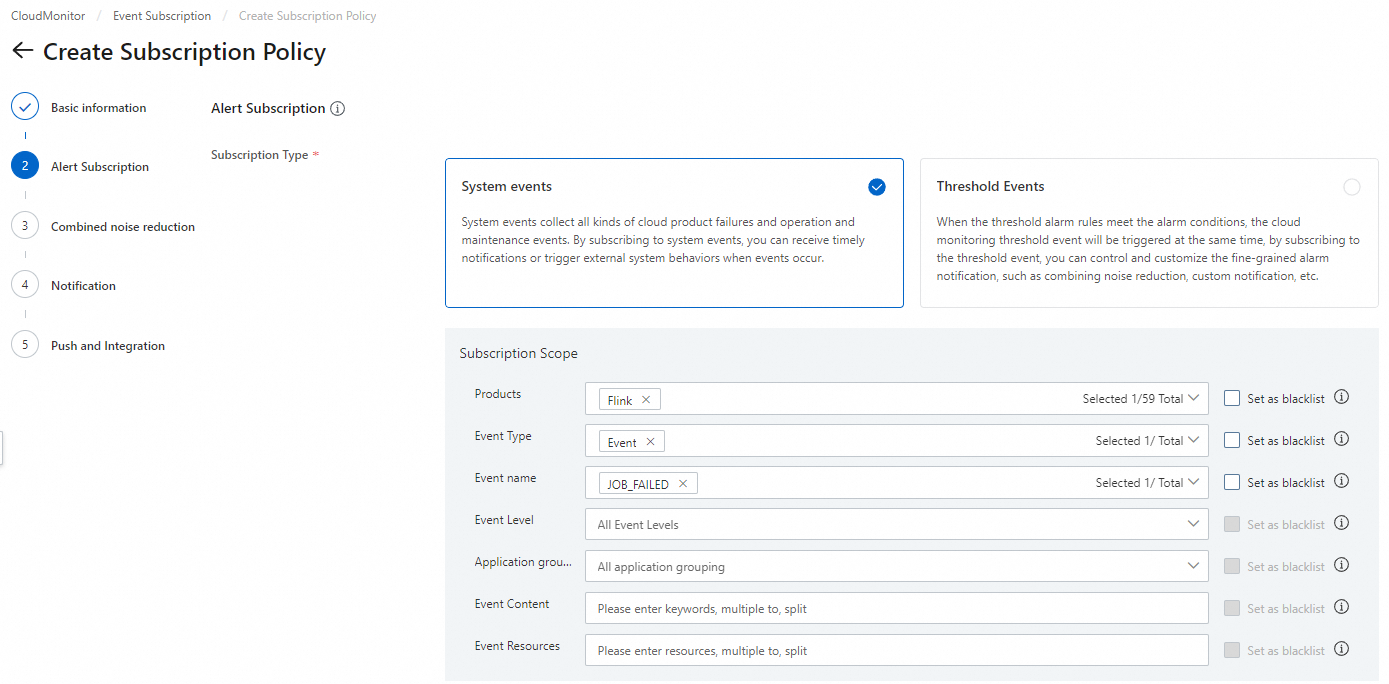
Configure in CloudMonitor
-
Log in to the CloudMonitor console.
-
In the left navigation pane, choose Event Center > Event Subscription.
-
On the Subscription Policy tab, click Create Subscription Policy.
-
Configure the parameters. For details, see Manage event subscriptions (Recommended).
Failover surge
Frequent restarts indicate an underlying problem — code bugs, resource bottlenecks, or configuration errors — that auto-recovery cannot fix. Configure this alert to catch surge patterns before they exhaust retry budgets.
Metric: Number of error recoveries per minute for the job
Recommended configuration:
-
Metric value ≥ 1
-
Period: 1 minute
-
Notification: Phone call, text message, email, and webhook (Critical)
When this alert fires:
-
Identify the root cause by analyzing failover, JobManager, and TaskManager logs.
-
Ignore: Infrequent, auto-recoverable machine failures.
-
Fix: Code bugs, resource bottlenecks, or configuration errors.
-
-
Restore the job from the latest snapshot or successful checkpoint.
Consecutive checkpoint failures
When no checkpoint succeeds within 5 minutes, the job has no recent recovery point.
Metric: Number of completed checkpoints per minute
Recommended configuration:
-
Metric value ≤ 0
-
Period: 5 minutes
-
Notification: Phone call, text message, email, and webhook (Critical)
When this alert fires:
-
See System checkpoints to identify the root cause.
-
Act on the cause:
-
Configuration issue (such as timeout): Adjust the checkpoint settings.
-
Backpressure: Use dynamic scaling to add resources to the backpressured operator.
-
-
Update the configuration dynamically or restore the job from the latest successful checkpoint.
Data timeliness
Ensure SLA for latency
Alert when the job is receiving data but processing lags behind by more than 5 minutes. Adjust the threshold and alert level to match your SLA.
Metrics: Business latency, Records in from source per second
Recommended configuration:
-
Business latencyMaximum ≥ 300000 -
Records in from source per secondMetric value > 0 -
Period: 5 minutes
When this alert fires:
-
See Metric description to investigate the cause.
-
Data plane: Are event timestamps out of order?
-
Traffic: Is there an upstream surge or downstream backpressure?
-
-
Act on the cause:
-
Internal: Adjust connector WITH parameters and scale out the bottleneck operator.
-
External: Optimize external service settings, such as adjusting throttling policies or increasing connection limits.
-
Upstream data interruption
Alert when there is inbound data and the service latency exceeds 5 minutes. You can adjust the threshold and alert level as needed.
Metrics: Records in from source per second, Age of unprocessed data at the source
Recommended configuration:
-
Records in from source per secondMetric value ≤ 0 -
Age of unprocessed data at the sourceMaximum > 60000 -
Period: 5 minutes
When this alert fires:
-
Check taskmanager.log, flame graphs, and upstream service metrics to confirm the cause: no upstream data, throttling, an error, or a stalled thread stack.
-
Act on the cause:
-
Connector issue: Adjust connector parameters such as timeout or concurrency, or add TaskManager resources.
-
Upstream or downstream service issue: Notify the upstream team to investigate.
-
Flink internal bottleneck (such as backpressure or a freeze): Resolve the root cause first, then restart the job from the latest checkpoint.
-
No downstream output
Alert when the sink stops emitting data for more than 5 minutes. This can indicate a business logic issue, a late-data configuration problem, or a failure in the downstream system.
Metric: Records out to sink per second
Recommended configuration:
-
Metric value ≤ 0
-
Period: 5 minutes
When this alert fires:
-
Confirm whether data reaches the sink operator:
-
Business logic filtering: Check logs or metrics to determine whether all input was filtered out for not meeting conditions.
-
Late data discard: Check watermark and window settings to determine whether data was discarded as late arrivals.
-
-
Confirm whether the sink can write to the external system:
-
Connection layer: Is the connection pool full? Is network connectivity normal?
-
Target system: Does the downstream database or service have a locked table, insufficient disk space, write throttling, or other errors?
-
-
As a temporary measure, enable dual-write to a backup storage system.
Resource performance bottlenecks
CPU bottleneck
Alert when a single TaskManager's CPU stays above 85% for 10 consecutive minutes.
Metric: CPU utilization of a single TM
Recommended configuration:
-
Maximum ≥ 85
-
Period: 10 minutes
When this alert fires:
-
Use flame graphs or the Flink UI to locate the hot-spot operator.
-
Business logic: Check for complex calculations, JSON parsing, or inefficient UDFs.
-
Data skew: Check whether a hot-spot key is overloading a single task with excessive data volume.
-
Insufficient resources: Determine whether the current degree of parallelism and TaskManager resources can handle the traffic, and whether there is severe backpressure.
-
Frequent GC: Check logs or JVM metrics to determine whether memory pressure is triggering frequent Full GCs that consume CPU.
-
-
Increase the degree of parallelism for the bottleneck operator, or allocate more CPU cores to the TaskManager.
Memory bottleneck
Alert when a TaskManager's heap memory exceeds 90% of capacity for 10 consecutive minutes. Derive the absolute threshold from the actual heap size shown on the Job O&M > Job Log page. For example, if the usage reads 194 MB / 413 MB, set the threshold to 372 MB (90% of 413 MB).
Metric: TM heap memory usage
Recommended configuration:
-
Maximum ≥ Threshold (90% of total heap)
-
Period: 10 minutes

When this alert fires:
-
Check GC logs to identify the problem type:
-
Memory leak: Heap does not return to baseline after GC and the baseline keeps rising.
-
Insufficient capacity: Heap usage stays consistently high, triggering frequent Full GCs and degrading performance.
-
Sudden OutOfMemoryError (OOM): Memory fills instantly when processing a specific record or batch.
-
-
Increase heap size or increase the degree of parallelism to reduce data volume per slot.