You can use the ACS cost insights feature to view cost visualization dashboards for clusters, namespaces, and applications.
The cost insights feature for ACS is currently in preview. To try this feature, submit a ticket.
Prerequisites
The cost insights feature is enabled. For more information, see Enable the cost insights feature.
Notes
After you enable the cost insights feature, the bill data is automatically displayed at 08:00 the next day. You can select a time range from the drop-down list in the upper-right corner to view the cluster cost data for different time periods.
Access the feature
Log on to the ACS console. In the left-side navigation pane, click Clusters.
On the Clusters page, click the name of the cluster. In the left-side navigation pane, choose .
On the Cost Insights page, click different tabs to view the cost visualization dashboards.
Cluster cost analysis
Filtering dimensions

Feature | Number | Description |
Cluster cost analysis options | ① | Cluster cost analysis metrics options.
For more information, see Bill details. Note The costs of applications in the cluster can be analyzed by namespace or pod. The application cost is calculated based on the bill amount of the resources. |
Time | ② | The time range of the dashboard. The default value is the last 7 days. You can specify a time range to view the changes in costs and resources within the specified time period. |
Cluster cost overview
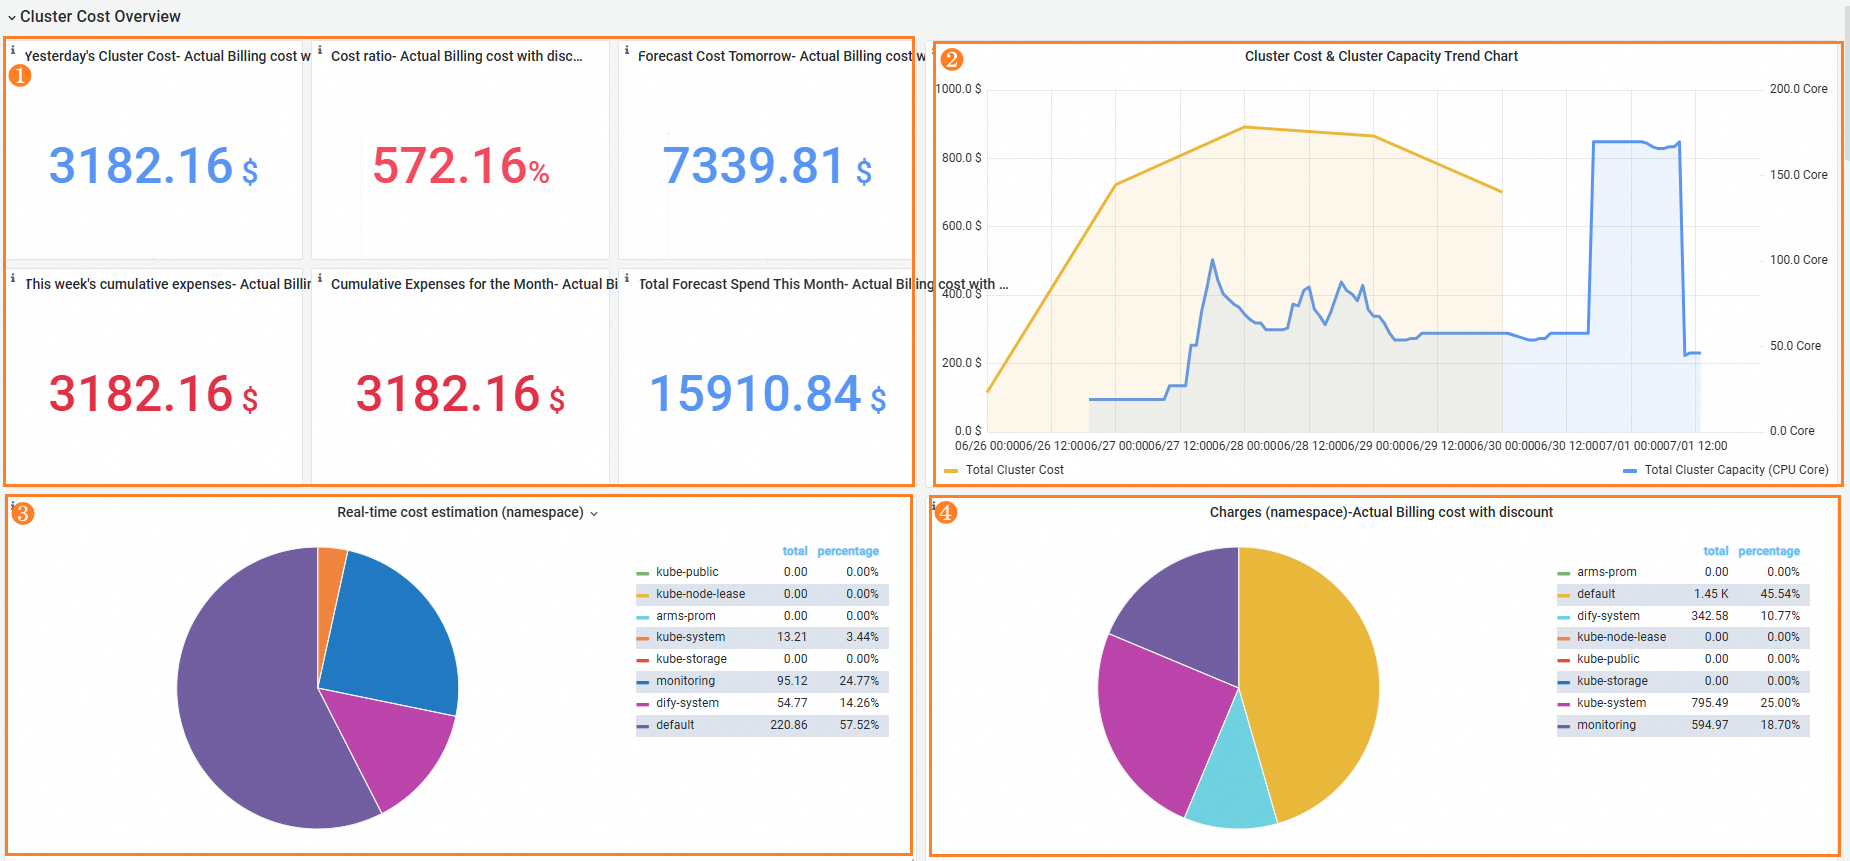
Feature | Number | Description |
The cost of the previous day, the cumulative cost of the week, and the cumulative cost of the month. | ① | The cost of the previous day, the day-on-day ratio, the cumulative cost of the week, and the cumulative cost of the month are all calculated based on the bill amount of the cloud resources in the cluster. The weekly cumulative cost is calculated based on the bill amount of every calendar week and the monthly cumulative cost is calculated based on the bill amount of every calendar month. Bills are generated one day after the transaction date. Therefore, the cumulative cost of the week is zero on Monday of each week and the cumulative cost of the month is zero on the first day of each month. The day-over-day growth rate compares the cluster cost of the previous day and the cluster cost of the day before the previous day. Green indicates a decrease and red indicates an increase. |
Brief information about the cluster cost and resource waste. | ② | The charts display changes in the cluster cost and cluster capacity. The yellow curve indicates the cluster cost and the blue curve indicates the actual cluster capacity. In common cases, the two curves may be correlated with each other. If the two curves represent different trends, it indicates changes in the average cost of individual CPU cores. In this case, you can check whether resources of higher prices are consumed. |
Display the real-time estimated costs of namespaces and allocated cost of each namespace | ③④ | Area 3 displays the real-time estimated costs of namespaces in the cluster. The cost of a namespace is the sum of the estimated costs of all pods in the namespace. Area 4 displays the allocated cost of each namespace, which is the allocation of the actual cluster cost based on the estimated cost ratio of the namespace. Note
User discounts, vouchers, and various delayed billing policies may cause inconsistencies between the namespace cost and the actual cluster bill. You can allocate costs by multiplying the cost ratio of a namespace by the total cluster cost. |
Stability and efficiency analysis
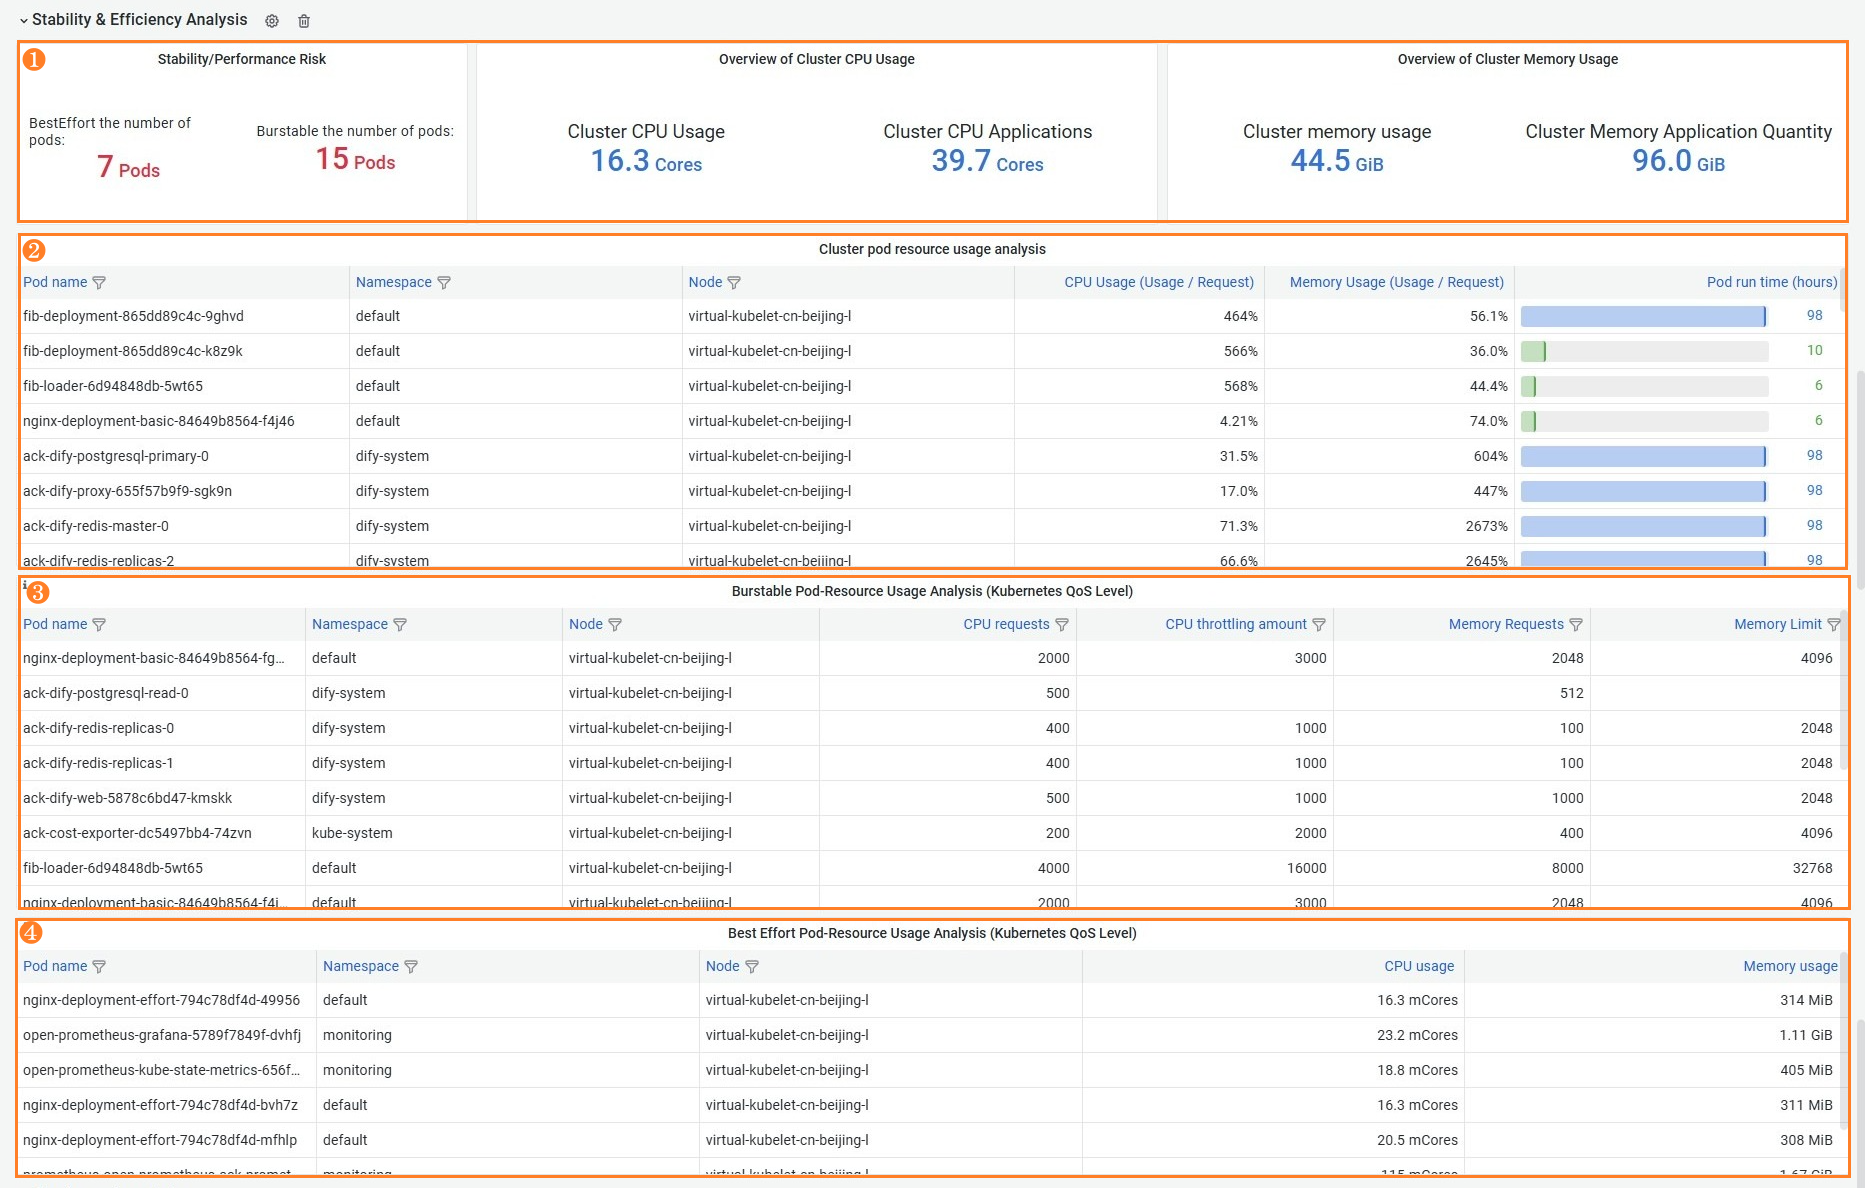
Feature | Number | Description |
Display the total resource usage of the cluster | ① | The number of pods of each Quality of Service (QoS) class and the total resource usage in the cluster. |
Display the pod resource usage in the cluster | ② | The basic information and resource utilization (Usage/Request) of all pods in the cluster. You can filter and sort the information. You can use this feature to view workloads with the highest or lowest resource usage in the cluster in batches. |
Display the resource configurations of burstable pods in a cluster | ③ | The resource configurations of pods with the QoS class of Burstable. You can filter and sort the information. You can use this feature to view the requests and limits of CPU and memory resources for each Burstable pod. This helps you understand the cluster resources consumed by pods and identify potential resource bottlenecks. |
Display the resource usage of BestEffort pods in a cluster | ④ | The resource configurations of pods with the QoS class of BestEffort. These pods generally have higher stability risks. You can filter and sort the list to check whether there are unexpected BestEffort pods to avoid risks. |
The computing power quality definition of ACS is different from the native Kubernetes QoS class definition. The dashboard displays the native Kubernetes QoS classes to help you determine the resource configurations of the cluster.
Cluster cost analysis
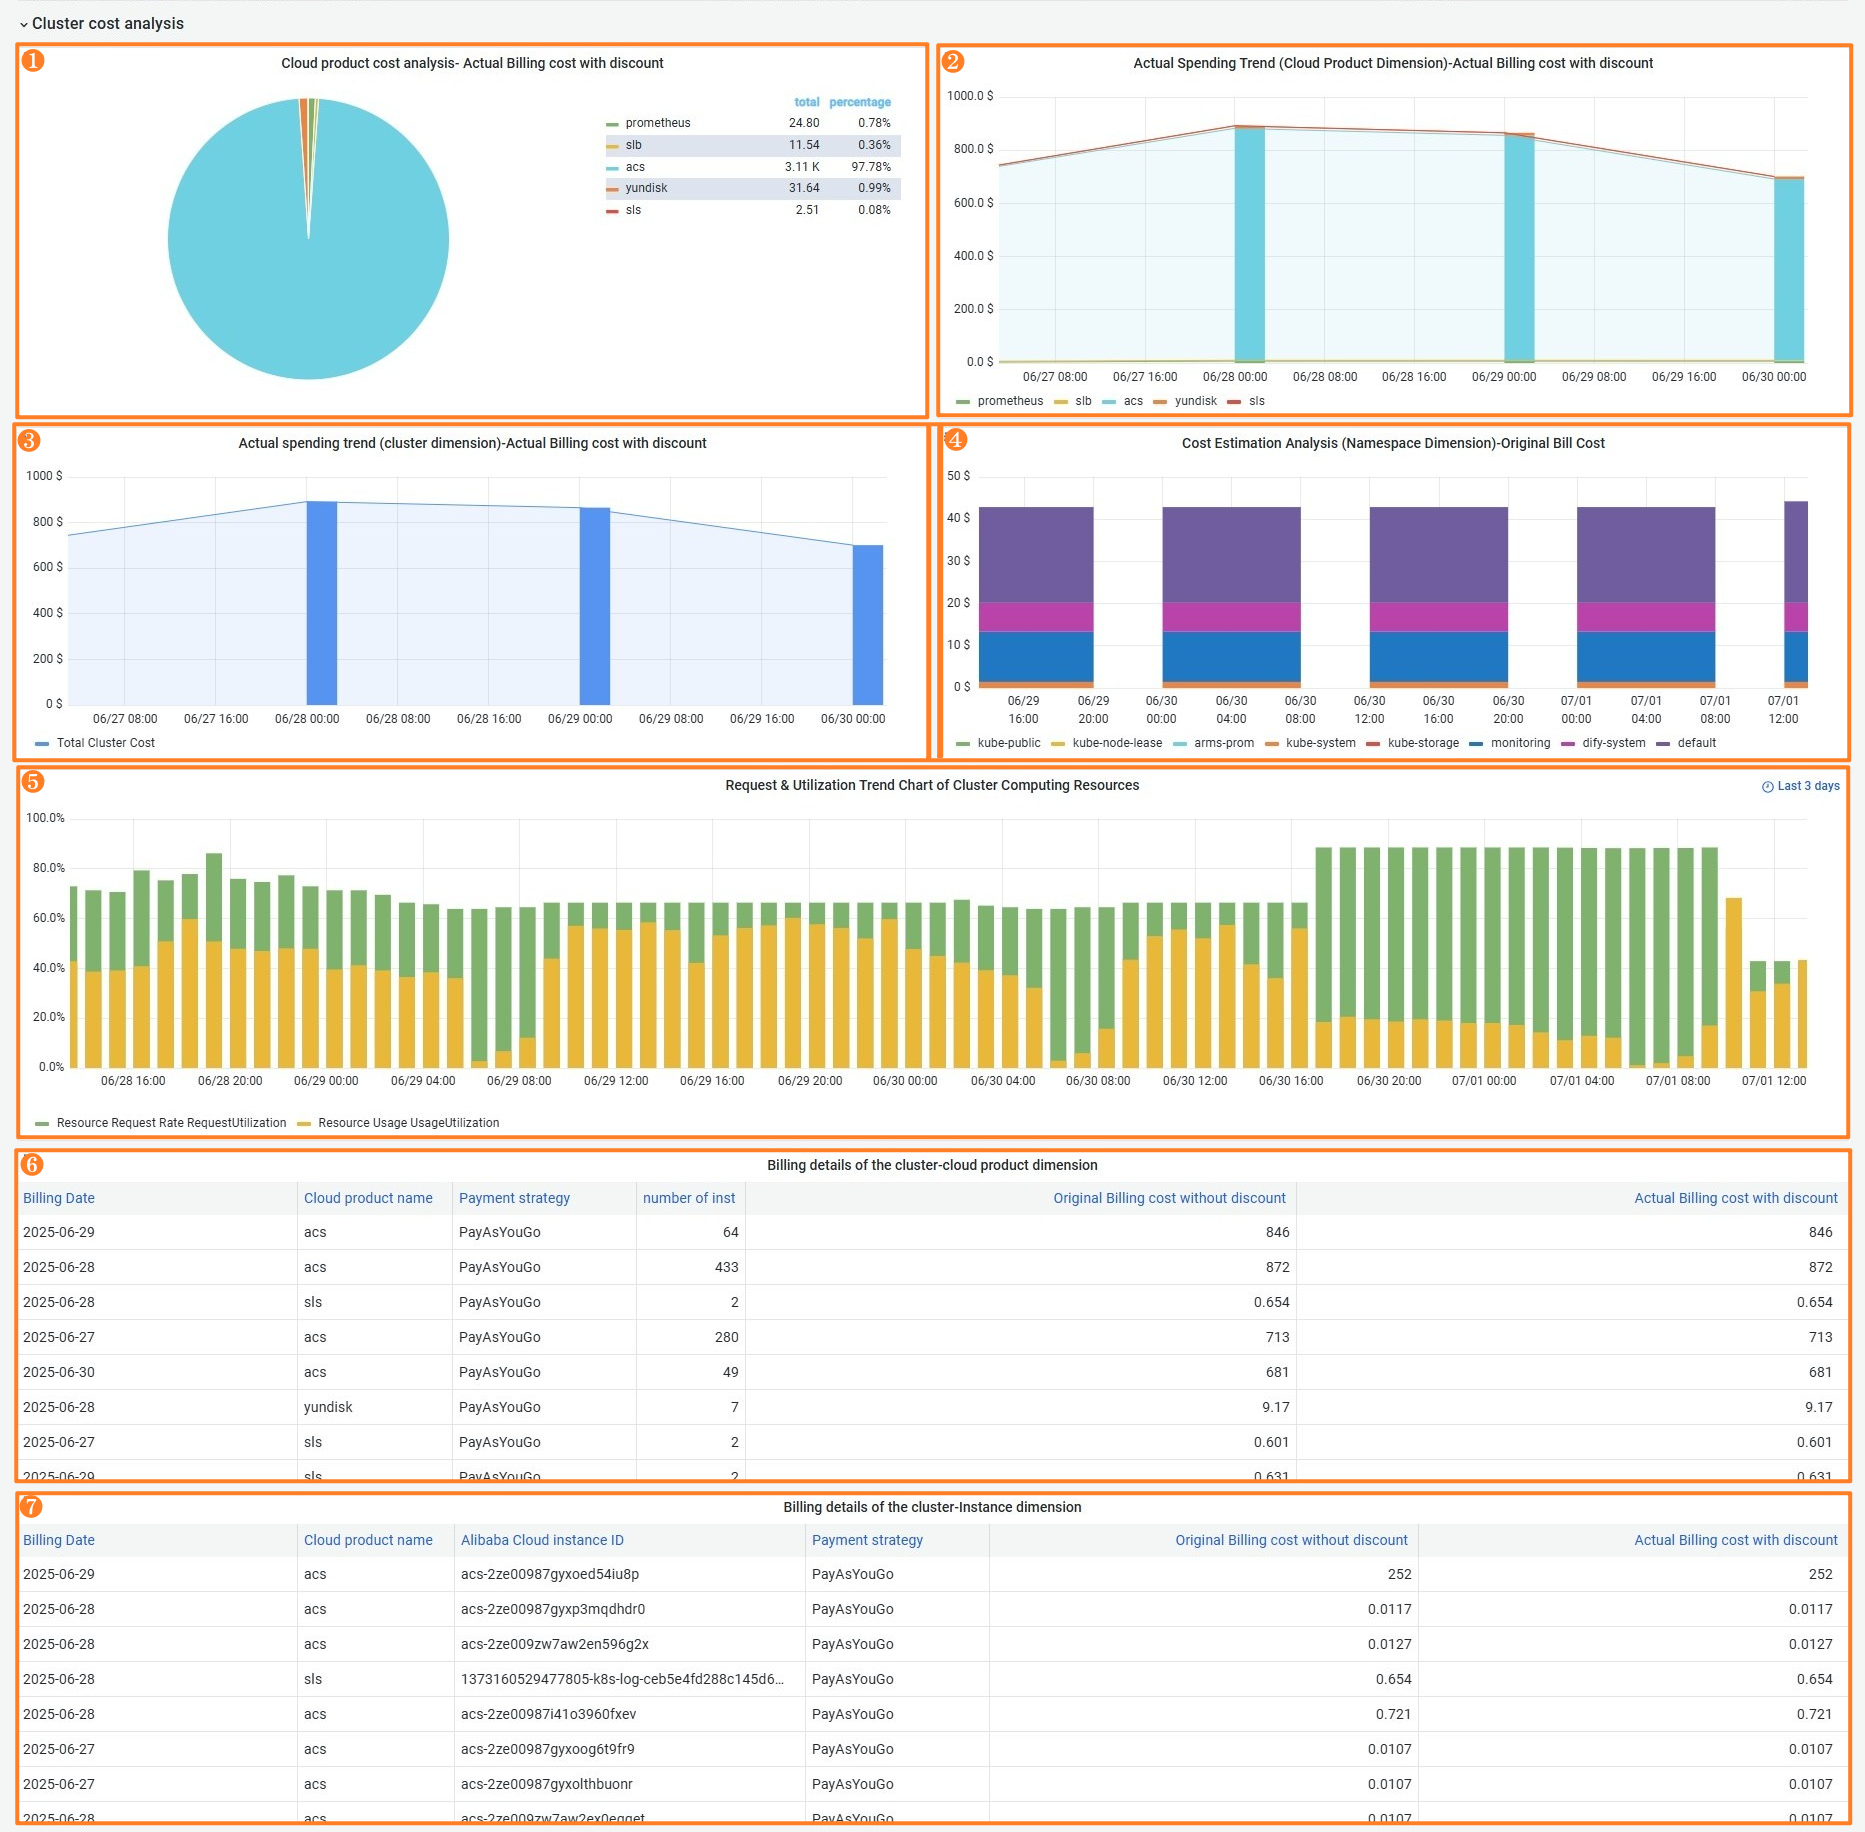
Feature | Number | Description |
Display changes in the cloud resource cost and the cost ratios of different cloud resources | ①② | Area 1 displays the cost ratios of different cloud resources in the cluster. Area 2 displays changes in the costs of different cloud resources in the cluster. A cluster may contain multiple types of cloud resources. Different cloud resources have different usage methods and billing models, which may lead to differences in costs. You can view the consumption of different cloud resources based on cost trends and combinations to make cost decisions. |
Display changes in the total cluster cost | ③ | Display daily changes in the total cluster cost. |
Display the trends in real-time estimated costs of namespaces | ④ | The namespace cost is the aggregation of the original costs of all ACS pods in the namespace. User discounts, vouchers, and various delayed billing policies may cause inconsistencies between the namespace cost and the actual cluster bill. You can allocate costs by multiplying the cost ratio of a namespace by the total cluster cost. |
Display changes in the resource request and resource utilization of the cluster | ⑤ | Scenarios:
Trend graph description:
Analysis procedure:
|
Cluster billing details | ⑥⑦ | A list of daily bills displayed by cloud resource or instance. |
Namespace cost analysis
The namespace dashboard lets you filter and display resource and cost information of each namespace. Namespaces are used to manage resources that belong to different departments or teams.
Filtering dimensions

Feature | Number | Description |
Namespace | ① | Select a namespace to analyze. The default value is ALL, which indicates that all namespaces in the cluster are selected. |
Namespace cost analysis options | ② | Cluster cost analysis metrics options.
For more information, see Bill details. |
Time | ③ | Select a time range for the dashboard. The default value is the last 7 days. You can view the changes in costs and resources within different time periods. |
Billing overview
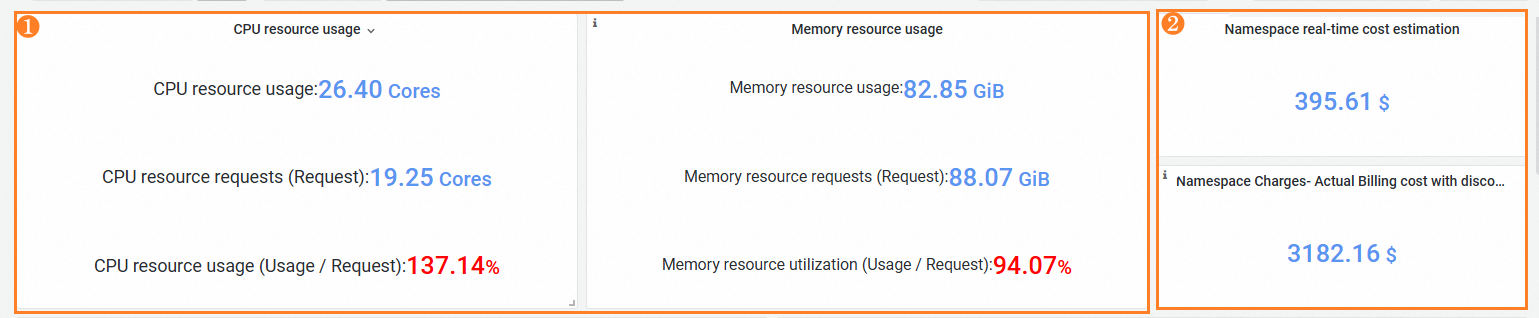
Feature | Number | Description |
Statistics, estimated costs, and allocated costs of resources in namespaces | ① | You can identify resource waste in the namespace based on the CPU and memory metrics. Metrics:
|
② | Section (2) displays the cost statistics of the applications in the namespace.
|
Cost details and trends
Feature | Number | Description |
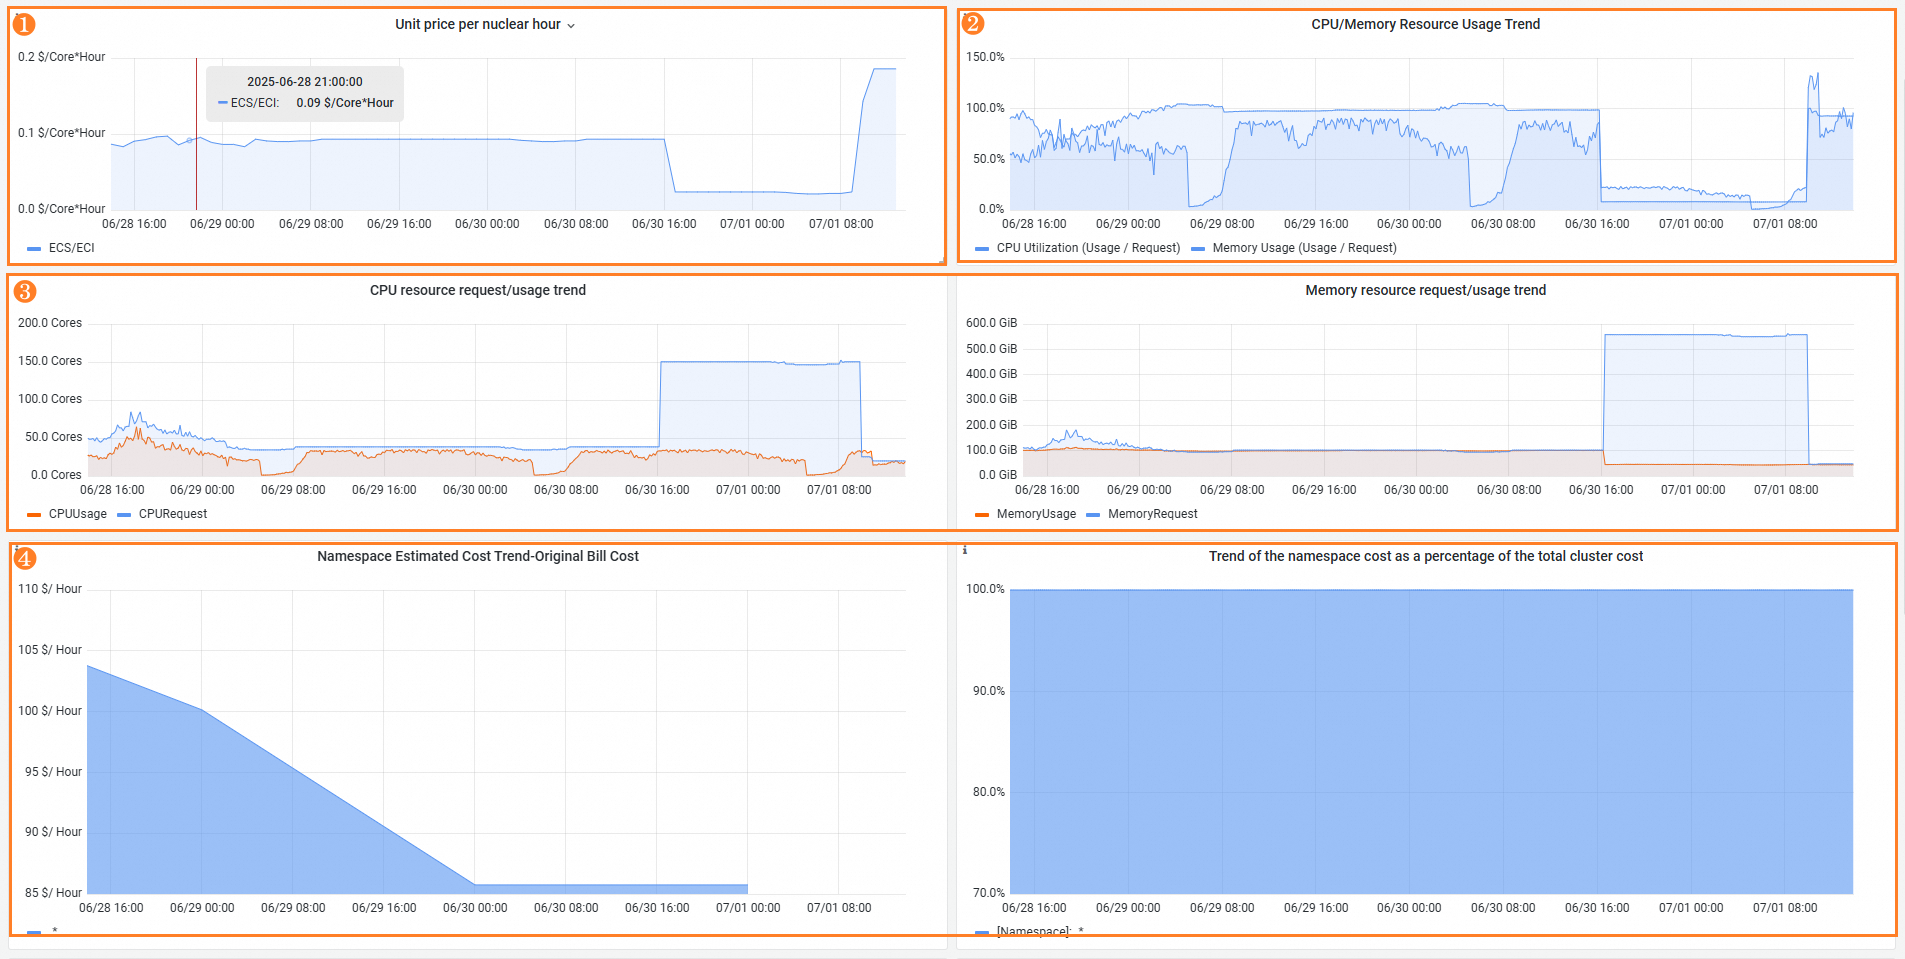
Unit price of core hours | ① | Display changes in the unit price of pod CPU core hours. |
Changes in CPU and memory utilization | ② | Display changes in the CPU and memory utilization of the namespace. |
Changes in the resource request and usage | ③ | Display changes in resource allocation and resource usage. The blue curve indicates changes in allocated resources and the red curve indicates changes in resources in use. When a pod is scheduled, resources are pre-allocated to the pod. However, the actual resources consumed by container processes are usually different from the pre-allocated resources. The two curves can help you optimize resource allocation and avoid resource waste. |
Changes in costs of applications in the namespace | ④ | Display changes in the costs of applications in the namespace. The total cost is the bill amount of the namespace within the specified time range. The ratio of the namespace cost to the cluster cost. |
Feature | Number | Description |
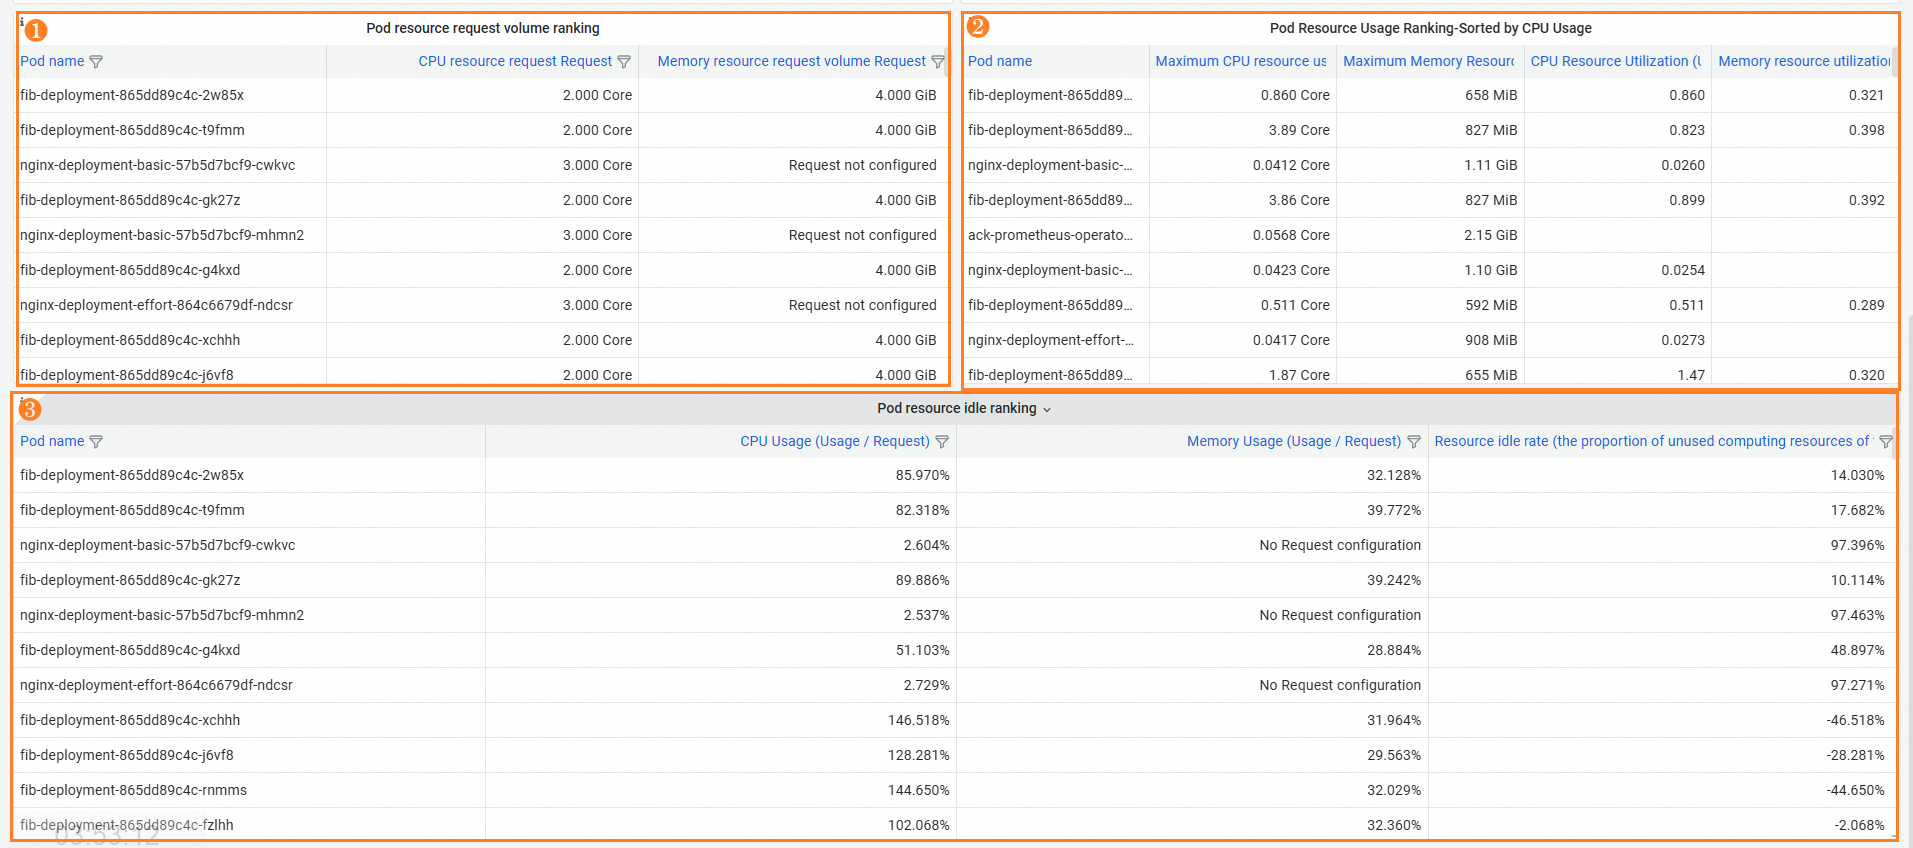
Pod ranking by resource requests | ① | Sort pods based on resource requests to help you identify the application that requests the most resources and optimize resource allocation. |
Pod ranking by resource utilization | ② | View replicas of pod applications with low resource utilization to identify idle applications. |
Pod ranking by idle resources | ③ | The idle resource ratio of a pod is the ratio of resources that are not used by the pod to the total resources allocated to the pod. The value helps you identify resource waste in the pod. By analyzing the pods with the most resource waste in a namespace, you can identify the main applications that cause resource waste in the namespace. Then, you can analyze the causes of resource waste and design targeted resource optimization strategies. |
Application cost analysis
The application dashboard lets you use label wildcards to filter applications and view the cost and resource usage of the desired applications. Application cost analysis focuses on scenario-specific cost optimization. Application cost analysis applies to scenarios such as big data computing, AI computing, and elastic scaling.
Label wildcards allow you to monitor not only the cost and resource usage of a single application but also the cost and resource usage of multiple related applications. For example, in a big data workflow scenario, you can add consistent labels to all applications in the workflow to analyze the cost of the entire workflow business.
Filtering dimensions

Feature | Number | Description |
Namespace | ① | Select a namespace to analyze its cost. The default setting is All, which means that all namespaces in the cluster are selected. |
Workload filtering | ② | Filter workloads based on type and name. The default value is All, which means that all workloads are selected. |
Filter applications by label | ③ | Enter a pod label. You can use If the label key contains |
Time | ④ | Select a time range for the dashboard. The default value is the last hour. You can view the changes in costs and resources within different time periods. |
Billing overview
Feature | Number | Description |
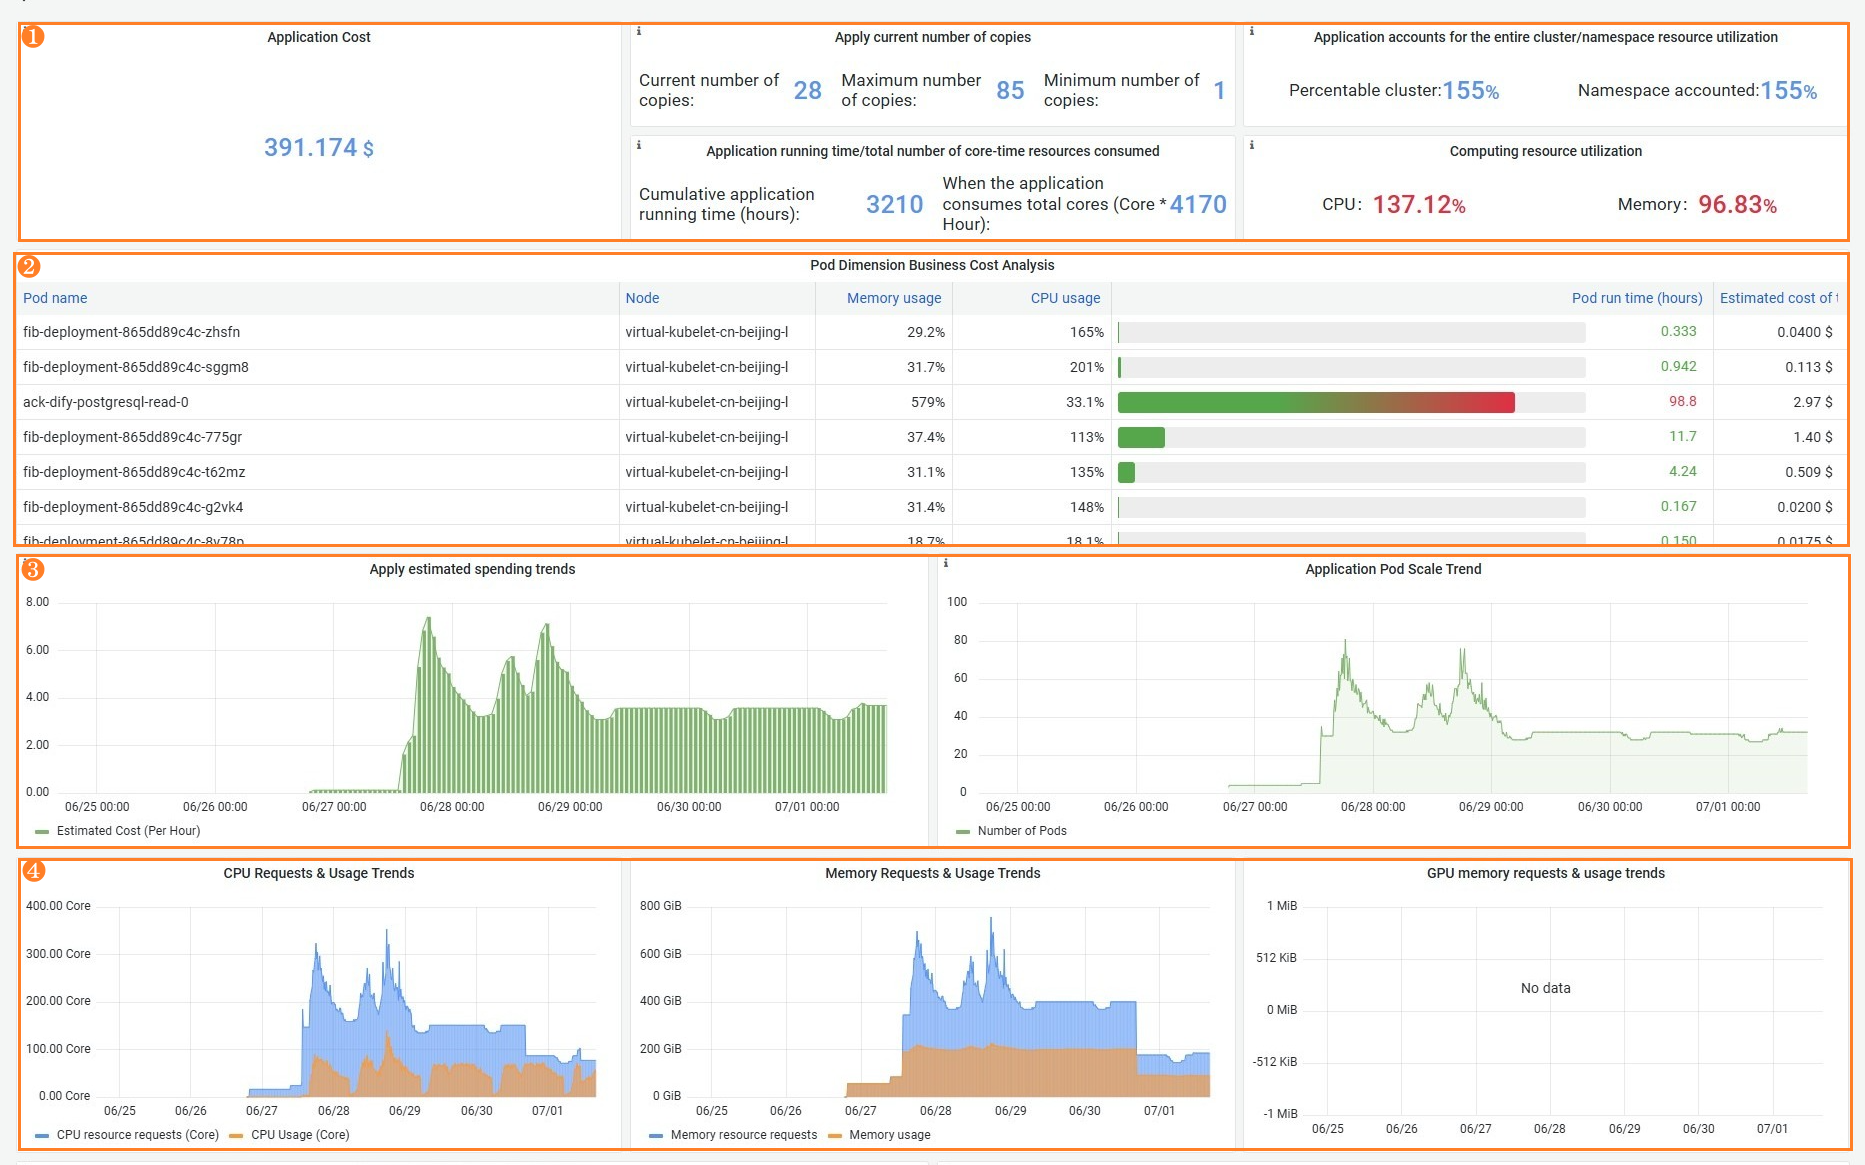
Application costs and computing resource utilization | ① | Display the cost of an application in real time and analyze the resource utilization of the application.
|
Pod cost analysis | ② | The resource status and real-time estimated costs of pods in the application. |
Changes in estimated application costs and number of pods | ③ |
|
Changes in CPU, memory, and GPU requests and usage | ④ | CPU, memory, and GPU requests and charts:
Analysis procedure:
|
Billing policy and pod usage
Feature | Number | Description |
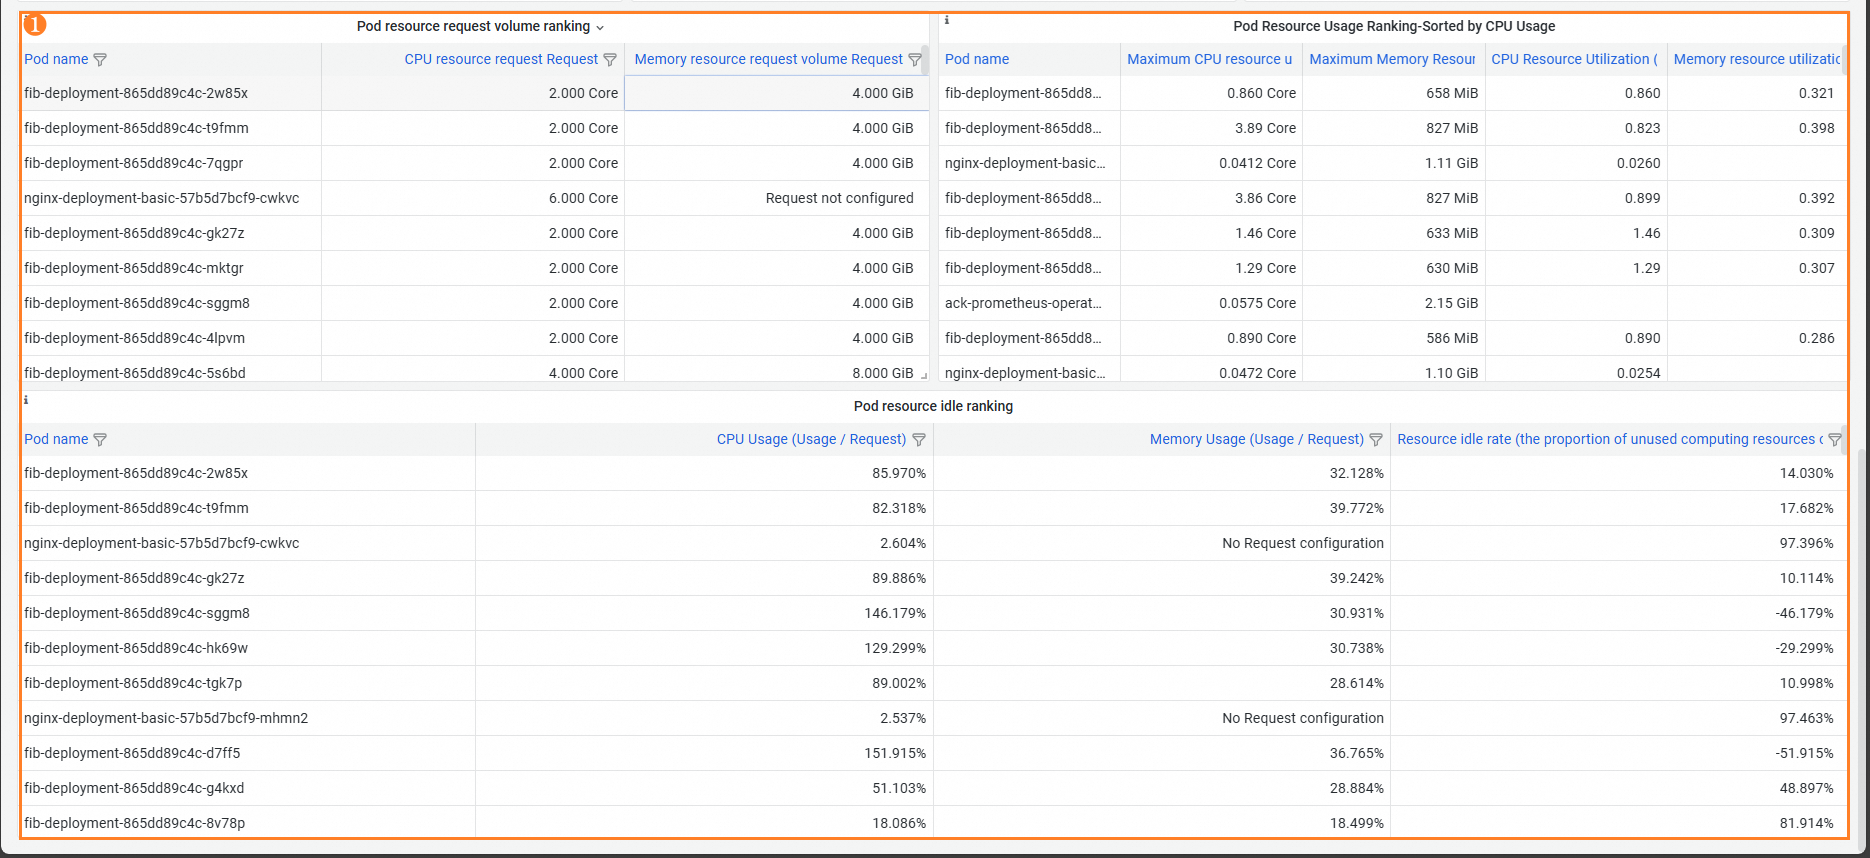
Pod ranking by resource requests, resource utilization, and idle resources | ① | The following rankings can help you identify the application with the most idle resources to avoid resource waste:
|
FAQ
Why is no data displayed after I enable the cost visualization feature?
Check whether the RAM role authorization is complete. For more information, see Step 3 of enabling the cost analysis feature. Cost analysis requires monitoring data and cost data of the cluster. Monitoring data is collected within 3 minutes after the feature is enabled. Cost data is displayed at 08:00 the next day after the cost analysis feature is enabled for the cluster.
Check whether a NAT gateway is configured for the cluster. You cannot use the internal endpoint to query bills in certain regions. Make sure that your cluster has Internet access.
Day-over-day Growth Rate and Predicted Cost for Tomorrow are displayed only after cost data is collected for two consecutive days.
Why is the sum of namespace costs different from the actual bill?
The namespace cost is calculated based on cost estimation rather than direct bill analysis. Cost estimation is calculated based on the catalog price. Therefore, when the cluster cost includes vouchers, discounts, savings plans, or other deduction policies, some data deviations may occur. You can allocate costs by multiplying the ratio of a namespace by the total cluster cost.
Why does the bill not include all cloud resources used by the cluster?
Cost analysis only counts cloud resources that are exclusively used by the cluster. Cloud resources shared by multiple clusters are not included in the bill statistics of cost analysis.
The cost insights feature relies on the cost allocation tags feature in the Expenses and Costs console. The feature relies on a specific identifier (key: value=acs:acc:cluster_id) in cloud resource tags to track and calculate cluster costs. If you disable this tag on the Cost Allocation Tags page, cluster-level cost statistics will be invalid. To resolve the cost statistics failure issue, re-enable the acs.aliyun.com and acs:acc:cluster_id tags on the cost allocation tags management page.
Why is the cumulative cost of the month or week lower than the actual cost?
The cost data of a cluster before you enable the cost insights feature is not analyzed when the cost insights feature calculates the cluster cost.