Scheduled scaling lets compute group instances automatically add or release elastic compute resources at set times each day. Use it to match resource capacity to predictable traffic peaks — without manual intervention — so you can cut costs during quiet periods and avoid performance bottlenecks during busy ones.
Use cases
Scheduled scaling fits workloads with clear daily patterns. The following scenarios illustrate when to use it and when to consider alternatives.
Minute-level near-real-time and real-time data imports
If write traffic stays flat throughout the day, no scaling plan is needed. If there is a recurring write peak within a fixed window (for example, a 16-hour ingestion burst each day), add an elasticity plan for init_warehouse to scale out elastic resources during that window.
Business team query workloads
Keep separate compute groups for each team to maintain workload isolation. If query volume fluctuates on a predictable daily schedule, add an elasticity plan to each group so resources expand at peak hours and release when demand drops.
Large ETL jobs and high-volume offline imports
For large ETL jobs and bulk offline imports, switch to Serverless Computing instead of scheduled scaling. Serverless Computing allocates extra compute on demand without reserved capacity, reducing out-of-memory (OOM) errors and charging only for actual job execution. For usage details, see the Serverless Computing user guide.
Key concepts
For definitions of instance-level and compute group-level compute resources, see Terminology.
The following example shows a sample resource configuration:
| Category | Resource details |
|---|---|
| Instance | 96 reserved CU (64 allocated, 32 unallocated); 32 elastic CU. Total: 128 CU. |
Compute group init_warehouse | 32 reserved CU, 16 elastic CU. Total: 48 CU. |
Prerequisites
Before you begin, make sure that you have:
An Alibaba Cloud account or a Resource Access Management (RAM) user with the AliyunHologresWarehouseFullAccess permission. This permission grants read-only access to the Hologres console and the right to configure elasticity plans. For details, see Grant permissions on Hologres to RAM users.
Superuser privileges on the target instance. For details, see Grant development permissions for instances to RAM users.
A compute group instance running Hologres V2.2.21 or later. General-purpose instances and read-only replica instances do not support scheduled scaling.
Limitations
| Constraint | Details |
|---|---|
| Minimum version | Hologres V2.2.21 |
| Supported instance type | Compute group instances only (general-purpose and read-only replica instances are not supported) |
| Elasticity periods per compute group | Up to 5 |
| Elastic resource ceiling | Elastic resources cannot exceed reserved resources |
| Success guarantee | Scaling is not guaranteed to succeed. Configure Cloud Monitor alerts for failure events — see Monitoring and alerts for scheduled scaling. |
| Console-only operations | After an elasticity plan is configured, scale out only through the Hologres console. Manual execution of hg_alter_warehouse is not supported. Create new compute groups only through the console — manual hg_create_warehouse is not supported. |
| Stop and scale in | A compute group with an active elasticity plan cannot be stopped, deleted, or manually scaled in. |
Regional availability
Scheduled scaling is in public preview. To apply for trial access, use your Alibaba Cloud main account to complete the Hologres scheduled scaling public preview application.
| Region | Status | How to request |
|---|---|---|
| China (Hangzhou), China (Shanghai), China (Beijing), China (Shenzhen) | Supported | Available after your application is approved |
| China (Shanghai) Finance Cloud, China (Beijing) Gov Cloud, China (Shenzhen) Finance Cloud, Japan (Tokyo), Malaysia (Kuala Lumpur), Indonesia (Jakarta) | Not supported | Not available for request |
| China (Chengdu), China (Hong Kong), Singapore, Germany (Frankfurt), US (Silicon Valley), US (Virginia), UAE (Dubai) | Available by ticket | 1. Complete the application form. 2. Submit a ticket. |
Billing
Reserved resources: Billed under the standard instance billing model (subscription or pay-as-you-go).
Elastic resources:
Cost = Actual elastic resource usage (CU × hours) × Unit price. For unit pricing, see Billing overview.
The system records elastic resource usage every minute. On an hourly basis, it calculates total usage, converts units, generates an invoice, and automatically deducts fees from your account.
Elastic resources are separate from unallocated reserved resources. Even if unallocated reserved CU is available, scheduled scaling always adds new elastic resources rather than using the unallocated pool.
Impact on running queries and writes
Scaling operations may briefly interrupt running queries and writes. The impact depends on your Hologres version:
| Version | Scale-out impact | Scale-in impact |
|---|---|---|
| V2.2 | ~15-second interruption | ~15-second interruption |
| V3.0+ | No interruption (compute group status shows "Processing" during the operation) | ~15-second interruption |
| V3.1+ | No interruption | No interruption for most queries and writes. If a large query or write is running when scale-in is triggered and takes more than 60 minutes to complete, the task fails 60 minutes after scale-in finishes. |
Manage compute group resources
Go to Virtual Warehouse Management
Log on to the Hologres console. In the top menu bar, select the target region.
In the left navigation pane, click Instances, then click the target Instance ID.
On the instance details page, click Virtual Warehouse Management in the left navigation pane.
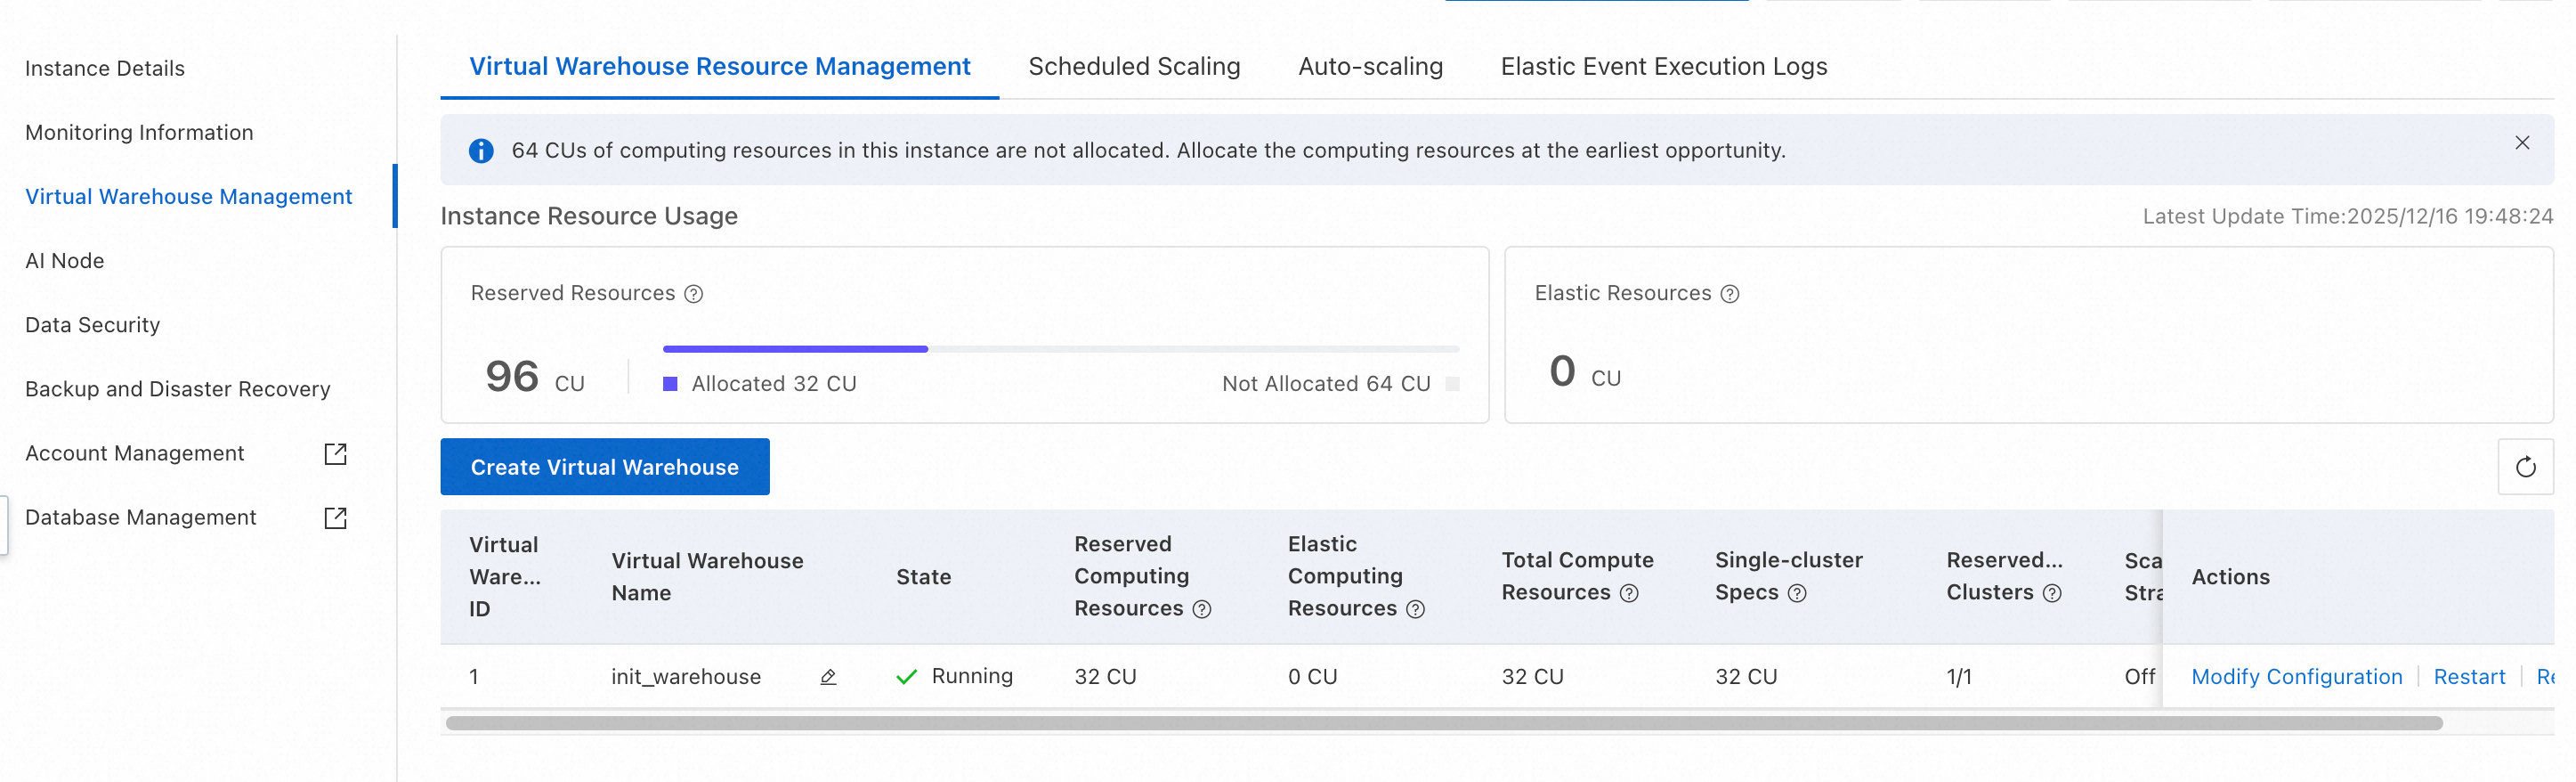
View and manage compute groups
On the Virtual Warehouse Resource Management tab, you can see allocated and unallocated reserved CU and elastic CU across all compute groups.
To create a compute group, click Create Virtual Warehouse. In the dialog box, enter a Virtual Warehouse Name and specify the Virtual Warehouse Resource.
For a compute group with a Status of Running, you can Modify Configuration, Restart, Stop, or Rebalance it. For details on Rebalance, see Shard rebalancing (Rebalance).
The default init_warehouse compute group cannot be stopped.Configure an elasticity plan
View the elasticity plan timeline
On the Virtual Warehouse Management page, click the Virtual Warehouse Scaling Plan tab.
From the Instance/Virtual Warehouse drop-down list, select an instance or compute group to see its upcoming scaling schedule. The timeline shows planned future operations, not historical metrics.
Add or edit an elasticity plan
On the Virtual Warehouse Scaling Plan tab, click the ![]() icon to the left of the target compute group, then click Add Time Segment. Set the start time, end time, and elastic resource amount for the daily period. Click Save in the Actions column to apply.
icon to the left of the target compute group, then click Add Time Segment. Set the start time, end time, and elastic resource amount for the daily period. Click Save in the Actions column to apply.
To update an existing plan, click Edit. To remove it, click Delete.
Elastic resources cannot exceed reserved resources.
Each compute group supports up to five elasticity periods.
Deleting an elasticity plan changes the compute group status to "Processing" momentarily, even if the resource count does not change. Queries and writes are not affected.
How changes take effect immediately
When you save a plan, Hologres checks whether the change affects the current time window. If it does, the new configuration applies right away.
Example 1 — Adding a plan that covers the current time
Current time: 16:00. Compute group A has 64 reserved CU.
You add a plan: effective period 15:00–18:00, elastic resources 32 CU.
Result: Compute group A immediately scales out to 96 CU total.
Example 2 — Narrowing a plan so the current time falls outside it
Current time: 16:00. Compute group A has 64 reserved CU with an existing plan:
Before: effective period 15:00–18:00, elastic resources 32 CU (currently applied; total = 96 CU)
After: effective period 17:00–18:00, elastic resources 32 CU
Result: Compute group A immediately scales in from 96 CU to 64 CU.
Monitoring and alerts for scheduled scaling
Scaling plan execution logs
On the Virtual Warehouse Management page, click the Elastic Event Execution Logs tab.
Select a time range to review past scaling executions. The log shows execution time, compute group name, status, event type, reserved CU, and target elastic CU.
Monitoring metrics
The Warehouse_timed_elastic_cores(Count) metric in the Hologres console shows the number of cores added by scheduled scaling. Configure alert rules for this metric as needed. For details, see Monitoring metrics in the Hologres console.
Cloud Monitor events
All scaling operations triggered by elasticity plans are recorded in Cloud Monitor.
View scaling events:
Go to Cloud Monitor Event Center. On the System events page, under Event monitoring, select Hologres.
Look for the following event names:
Instance:Warehouse:TimedElastic:Start— scaling startedInstance:Warehouse:TimedElastic:Finish— scaling completedInstance:Warehouse:TimedElastic:Failed— scaling failed
Set up alerts:
Configure notifications based on these events. For details, see Use system events for alerts.
Example failure event payload:
{
    "Status": "Failed",
    "InstanceName": "<instance_id>",
    "ResourceId": "<instance_resource_id>",
    "Content": {
        "ScaleType": "ScaleDown",       // "ScaleUp" or "ScaleDown"
        "ScheduleId": "xxxxxx",         // Elasticity plan ID
        "TimedElasticCPU": 0,           // Target elastic CPU cores after scaling
        "WarehouseId": "2",             // Compute group ID
        "WarehouseName": "<warehouse_name>"
    },
    "Product": "hologres",
    "Time": 1722852008000,              // Unix timestamp in milliseconds
    "Level": "WARN",
    "RegionId": "<region>",
    "Id": "<event_id>",
    "GroupId": "0",
    "Name": "Instance:Warehouse:TimedElastic:Failed"
}
Key fields in the failure event:
| Field | Description |
|---|---|
ScaleType | Direction of the scaling operation: ScaleUp (scale out) or ScaleDown (scale in) |
ScheduleId | ID of the elasticity plan that triggered the operation |
TimedElasticCPU | Target elastic CPU core count after scaling (0 on scale-in completion) |
WarehouseId | Internal ID of the compute group |
WarehouseName | Name of the compute group |
Time | Event timestamp in Unix milliseconds |
ActionTrail
Console operations such as editing elasticity plans, and the execution of scaling operations, are recorded in ActionTrail. For details, see Event audit logs.