After you report application data to Managed Service for OpenTelemetry, you can use the Database tab to view how your application interacts with its databases -- request volume, error rates, response times, and individual SQL statements. Use it to identify slow queries, trace them to the calling service, and diagnose performance bottlenecks.
The tab provides three levels of detail:
| Level | What it shows |
|---|---|
| Filtered overview | Narrow results by database type, name, or host using quick filters |
| Trend charts | Track request count, error count, and average response time over a selected time range |
| Database list | View all detected databases with key metrics; drill into any database for SQL analysis, exceptions, request sources, and traces |
Prerequisites
Before you begin, make sure that you have:
Application data reported to Managed Service for OpenTelemetry. For setup instructions, see Connection Description
View database analysis data
Log on to the ARMS console.
In the left-side navigation pane, choose Application Monitoring > Application List.
On the Application List page, select a region in the top navigation bar, then click the application name.
The Language column indicates the connection type. A
 icon means the application uses Application Monitoring. A hyphen (-) means it uses Managed Service for OpenTelemetry.
In the top navigation bar, click Database.
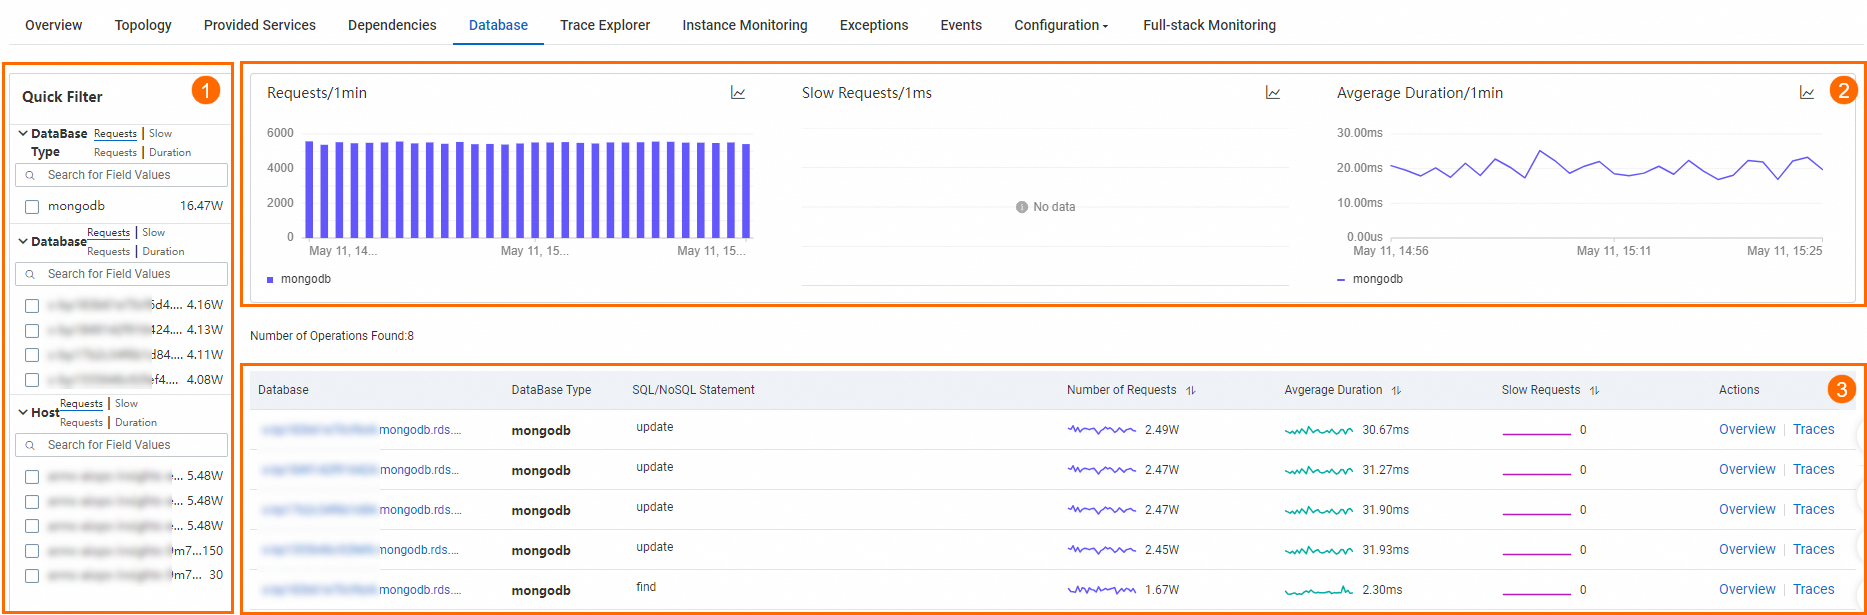
Filter databases
Use the Quick Filter section at the top to narrow results by database type, database name, or host.
To filter, select a value from the dropdown for each dimension. The trend charts and database list update immediately.
To remove a filter, clear the selected value to return to the full view.
Trend charts
The trend chart section displays time series curves for three metrics:
| Metric | Description |
|---|---|
| Requests | Total database calls in the selected time range |
| Errors | Number of errors in the selected time range |
| Average response time | Mean latency per call |
Click the  icon to view metrics for a specific time range or compare the same period across different dates. Click the
  icon to switch between a column chart and a trend chart.
Database list
The database list shows each detected database with its name, type, statement, request count, error count, and average response time.
| Action | How to use it |
|---|---|
| View details | Click a database name to open its detail page. See Database details. |
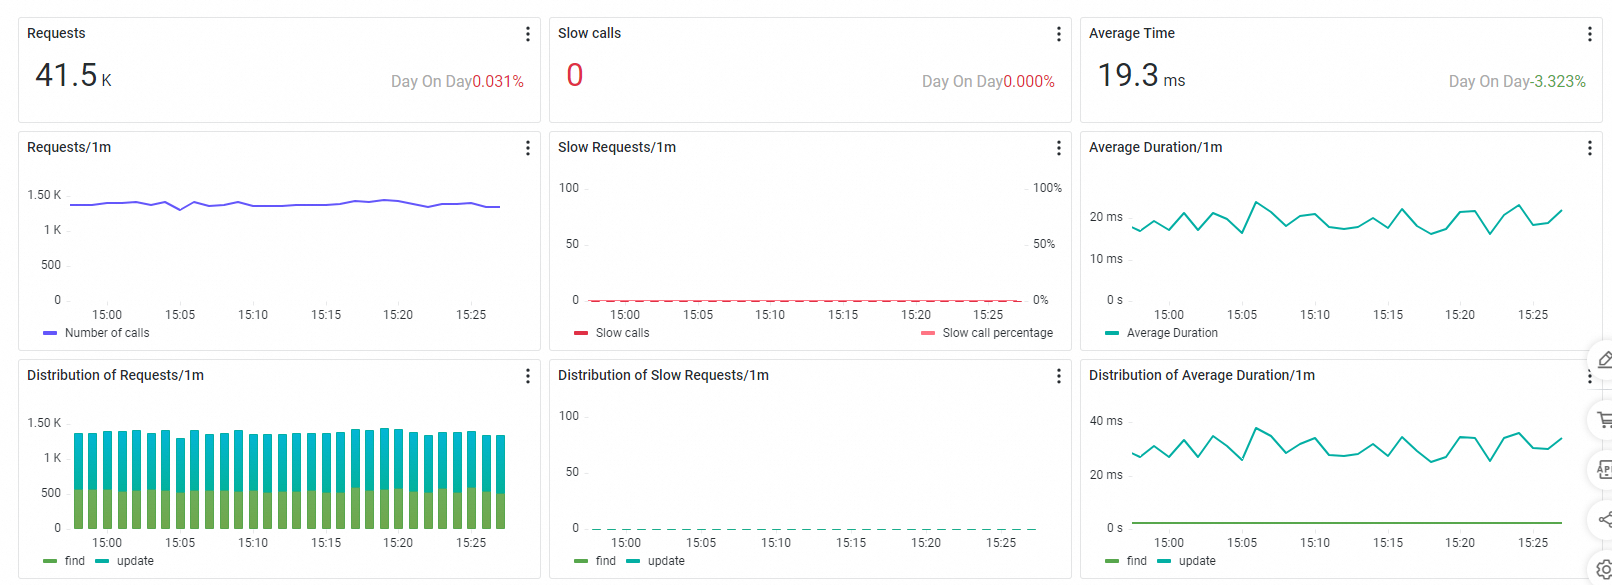
| View overview | Click Overview in the Actions column. A side panel shows request count, slow call count, average response time, and call distribution. |
| View traces | Click Traces in the Actions column to inspect individual database call traces. For more information, see Trace Explorer. |
Database details
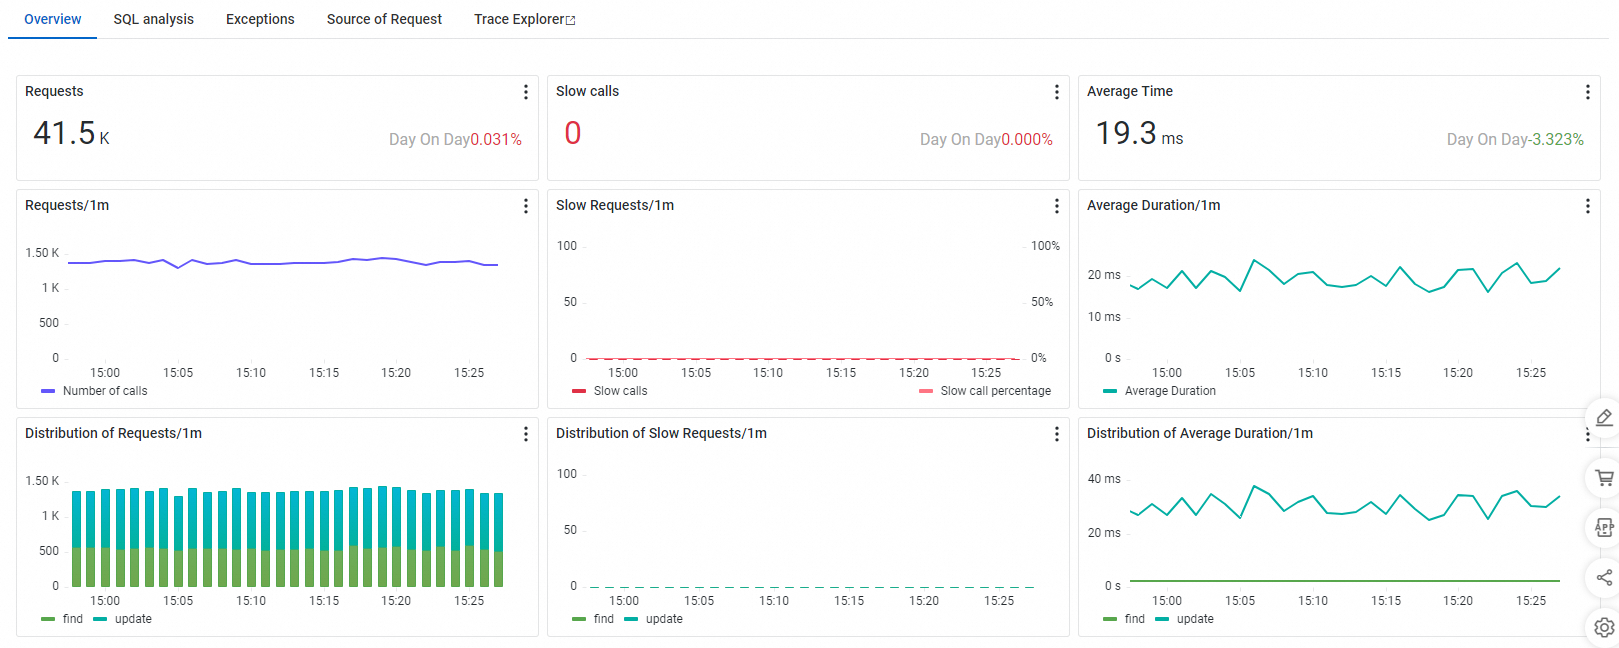
Click a database name in the list to open its detail page. The page contains five tabs:
| Tab | What it shows |
|---|---|
| Overview | High-level health metrics: request count, slow call count, and average response time |
| SQL analysis | Individual SQL statement performance and slow query identification |
| Exceptions | Exceptions thrown during database calls, with occurrence counts |
| Source of Request | Which operations in your application generate the most database load |
| Trace Explorer | Flexible trace analysis with custom filters and aggregation |
Overview
Time series curves and distribution charts for request count, slow call count, and average response time. Use this tab for a high-level view of database health.
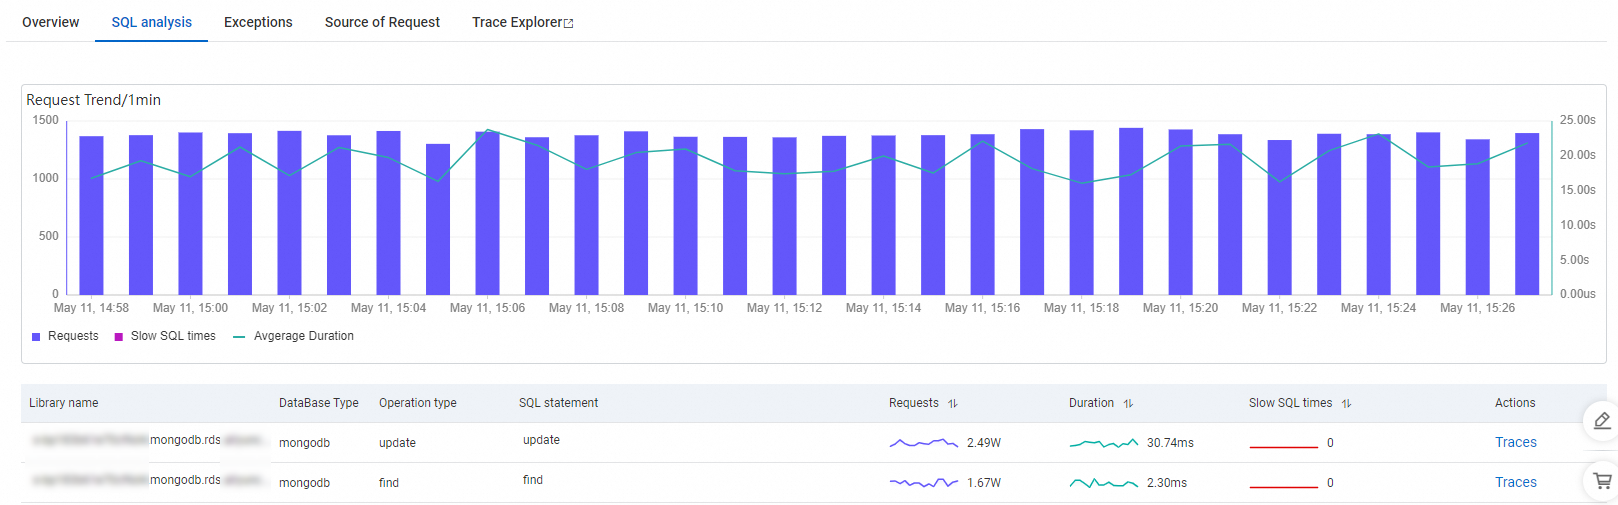
SQL analysis
Request trends for the selected database instance -- request count, slow SQL query count, and average response time -- with a table of individual SQL statements and their performance metrics.
To trace a specific SQL statement, click Traces in the Actions column. For more information, see Trace Explorer.
Exceptions
Exceptions thrown when the application called the database instance during the selected time range, with occurrence counts and details.
For more information, see Exception analysis.

Source of Request
Time series curves for response time, request count, and error count, broken down by the operations that triggered calls to the database. Use this tab to identify which parts of your application generate the most database load and correlate high-latency database calls with specific upstream operations.
Trace Explorer
Combine filter conditions and aggregation dimensions to analyze individual traces in real time. Trace Explorer supports flexible diagnostic workflows for different troubleshooting scenarios.
For more information, see Trace Explorer.

Set up alerts for database issues
To catch database issues before they affect users, create alert rules for specific operations or all operations at once. When a threshold is breached, the system notifies your team automatically.
For instructions, see Application monitoring alert rules.