This topic describes how to use the pipeline configuration feature of Alibaba Cloud Logstash to migrate data from a self-managed Elasticsearch cluster to an Alibaba Cloud Elasticsearch cluster.
Limits
The ECS instance that hosts your self-managed Elasticsearch cluster must be in a virtual private cloud (VPC). ECS instances connected through ClassicLink are not supported.
Alibaba Cloud Logstash instances are deployed in a VPC. If your self-managed Elasticsearch cluster and the Logstash cluster are in the same VPC, you can connect them directly. If they are in different networks, you must use a NAT Gateway to connect to the public network. For more information, see Configure a NAT gateway for public data transmission.
The security group of the ECS instance that hosts your self-managed Elasticsearch cluster must allow access from the IP addresses of the Logstash cluster nodes. You can find these IP addresses on the Basic Information page. You must also open port 9200.
This topic uses the migration from a self-managed Elasticsearch 8.17 cluster to an Alibaba Cloud Elasticsearch 8.17 cluster using Alibaba Cloud Logstash 8.11.4 as an example. The provided script is for this migration scenario only and may not be compatible with other versions. If you use a different setup, see Product compatibility to check for compatibility issues. If issues exist, you must upgrade your instance or purchase a new one.
Procedure
Step 1: Prepare the environment
Set up a self-managed Elasticsearch cluster.
You can use Alibaba Cloud ECS to set up your self-managed Elasticsearch cluster. This topic uses version 8.17 as an example. For more information, see Install and Run Elasticsearch.
Create an Alibaba Cloud Logstash instance.
Create a Logstash instance in the same VPC as the ECS instance that hosts your self-managed Elasticsearch cluster. For more information, see Create an Alibaba Cloud Logstash instance.
Create a destination Alibaba Cloud Elasticsearch instance and enable automatic index creation.
Create an Elasticsearch instance that is in the same VPC and has the same version as the Logstash instance. This topic uses version 8.17 as an example. For more information, see Create an Alibaba Cloud Elasticsearch instance.
To enable automatic index creation, see Configure YML parameters.
NoteLogstash synchronizes only data, not data structure features. If you enable automatic index creation, the data structures before and after synchronization may be inconsistent. To ensure that the data structures are consistent, you must first manually create an empty index in the destination Elasticsearch instance. When you create the index, copy the mappings and settings structures from the source instance and allocate a reasonable number of shards.
Step 2: Configure and run the Logstash pipeline
Go to the Logstash Clusters page of the Alibaba Cloud Elasticsearch console.
Navigate to the desired cluster.
In the top navigation bar, select the region where the cluster resides.
On the Logstash Clusters page, find the cluster and click its ID.
In the left-side navigation pane of the page that appears, click Pipelines.
On the Pipelines page, click Create Pipeline.
On the Create Pipeline Task page, enter a pipeline ID and configure the pipeline.
The pipeline configuration used in this topic is as follows.
input {
  elasticsearch {
    hosts => ["http://<IP address of the self-managed Elasticsearch master node>:9200"]
    user => "elastic"
    index => "*,-.monitoring*,-.security*,-.kibana*"
    password => "your_password"
    docinfo => true
  }
}
filter {
}
output {
  elasticsearch {
    hosts => ["http://es-cn-mp91cbxsm000c****.elasticsearch.aliyuncs.com:9200"]
    user => "elastic"
    password => "your_password"
    index => "%{[@metadata][input][elasticsearch][_index]}"
    document_id => "%{[@metadata][input][elasticsearch][_id]}"
  }
  file_extend {
        path => "/ssd/1/ls-cn-v0h1kzca****/logstash/logs/debug/test"
    }
}
Table 1. Parameter descriptions
Parameter
Description
hosts
The endpoint of the self-managed or Alibaba Cloud Elasticsearch service. In the input section, the format is
http://<IP address of the self-managed Elasticsearch master node>:<Port>. In the output section, the format ishttp://<Alibaba Cloud Elasticsearch instance ID>.elasticsearch.aliyuncs.com:9200.ImportantWhen you configure the pipeline, replace <IP address of the self-managed Elasticsearch master node>, <Port>, and <Alibaba Cloud Elasticsearch instance ID> with their actual values.
user
The username to access the self-managed or Alibaba Cloud Elasticsearch service.
Importantuser and password are required parameters. If X-Pack is not installed on your self-managed Elasticsearch cluster, you can leave these parameters empty.
The default username to access an Alibaba Cloud Elasticsearch instance is elastic. This topic uses this username as an example. If you want to use a custom user, you must assign the required roles and permissions to the user. For more information, see Use Elasticsearch X-Pack role management to control user permissions.
password
The password to access the self-managed or Alibaba Cloud Elasticsearch service.
index
The name of the index to synchronize. In the input section, set this parameter to *,-.monitoring*,-.security*,-.kibana* to synchronize all indexes except system indexes that start with a period (
.). In the output section, set this parameter to %{[@metadata][input][elasticsearch][_index]} to match the index in the metadata. This ensures that the index generated by Alibaba Cloud Elasticsearch has the same name as the index in the self-managed Elasticsearch cluster.docinfo
Set this parameter to true to allow Alibaba Cloud Elasticsearch to fetch metadata from the documents in the self-managed Elasticsearch cluster, such as the index, type, and ID.
document_id
Set this parameter to %{[@metadata][input][elasticsearch][_id]} to match the document ID in the metadata. This ensures that the document ID generated by Alibaba Cloud Elasticsearch is the same as the document ID in the self-managed Elasticsearch cluster.
file_extend
Optional. Enables the debug log feature. The path parameter specifies the output path for the debug logs. Configure this parameter to view the output directly in the console. If you do not configure this parameter, you must check the output at the destination and then return to the console to make changes, which can be time-consuming. For more information, see Use the Logstash pipeline to configure the debug feature.
ImportantBefore you use the file_extend parameter, you must install the logstash-output-file_extend plug-in. For more information, see Install and remove a plug-in. By default, the path field is set to a system-specified path. We recommend that you do not change the path. You can click Start Configuration Debug to obtain the path.
The Elasticsearch input plugin reads documents from an Elasticsearch cluster based on a configured query statement. This is useful for operations such as batch importing test logs. By default, the sync action automatically stops after reading the data. However, Alibaba Cloud Logstash requires the process to run continuously. If the process stops, it restarts. This can cause duplicate data writes in single-task scenarios, such as with `logstash input es`. To prevent duplicate writes, set a scheduled task with a long interval. For example, you can schedule a task to run at 13:20 on March 5. After the task runs for the first time, stop the pipeline. Use cron syntax with the schedule parameter to do this. For more information, see the Scheduling section in the Logstash documentation.
For example, to schedule a task to run at 13:20 on March 5:
schedule => "20 13 5 3 *"For more information about configuration file settings, see Logstash configuration file description.
Click Next to configure pipeline parameters.
Parameter
Description
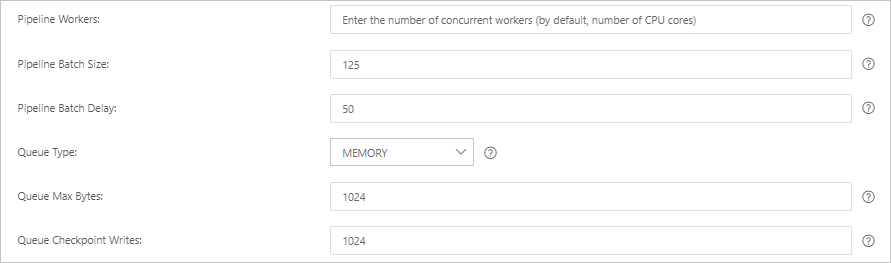
Pipeline Workers
The number of worker threads that run the filter and output plug-ins of the pipeline in parallel. If a backlog of events exists or some CPU resources are not used, we recommend that you increase the number of threads to maximize CPU utilization. The default value of this parameter is the number of vCPUs.
Pipeline Batch Size
The maximum number of events that a single worker thread can collect from input plug-ins before it attempts to run filter and output plug-ins. If you set this parameter to a large value, a single worker thread can collect more events but consumes larger memory. If you want to make sure that the worker thread has sufficient memory to collect more events, specify the LS_HEAP_SIZE variable to increase the Java virtual machine (JVM) heap size. Default value: 125.
Pipeline Batch Delay
The wait time for an event. This time occurs before you assign a small batch to a pipeline worker thread and after you create batch tasks for pipeline events. Default value: 50. Unit: milliseconds.
Queue Type
The internal queue model for buffering events. Valid values:
MEMORY: traditional memory-based queue. This is the default value.
PERSISTED: disk-based ACKed queue, which is a persistent queue.
Queue Max Bytes
The maximum data size for a queue. Unit: MB. Valid values: integers ranging from
1 to 253 - 1. Default value: 1024.NoteThe value must be less than the total capacity of your disk.
Queue Checkpoint Writes
The maximum number of events that are written before a checkpoint is enforced when persistent queues are enabled. The value 0 indicates no limit. Default value: 1024.
WarningAfter you configure the parameters, you must save the settings and deploy the pipeline. This triggers a restart of the Logstash cluster. Before you can proceed, make sure that the restart does not affect your business.
Click Save or Save and Deploy.
Save: After you click this button, the system stores the pipeline settings and triggers a cluster change. However, the settings do not take effect. After you click Save, the Pipelines page appears. On the Pipelines page, find the created pipeline and click Deploy Now in the Actions column. Then, the system restarts the Logstash cluster to make the settings take effect.
Save and Deploy: After you click this button, the system restarts the Logstash cluster to make the settings take effect.
Step 3: View the data migration result
In your Alibaba Cloud Elasticsearch instance, log on to the Kibana console. In the navigation pane on the left, click the
 icon and choose .Note
This topic uses Alibaba Cloud Elasticsearch 8.17 as an example. The operations may differ for other versions. The actual user interface (UI) in the console prevails.
In the Console, run the
GET /_cat/indices?vcommand to view the successfully migrated indexes.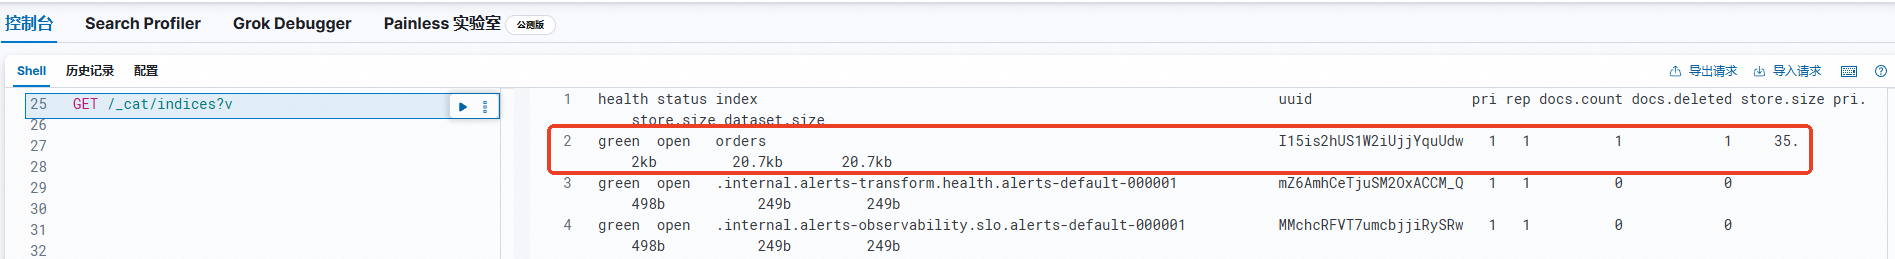
FAQ
Q: My self-managed Elasticsearch cluster on an ECS instance and my Alibaba Cloud Logstash instance are under different accounts. How do I configure network connectivity for data migration?
A: Because the ECS instance and the Logstash instance are under different accounts, they are in different VPCs. You must configure connectivity between the two VPCs. You can use Cloud Enterprise Network (CEN) to do this. For more information, see Step 3: Load network instances.
Q: What should I do if an issue occurs when Logstash writes data?