By Kernel SIG
There have been two major industry problems in the field of kernel memory debugging. What are the solutions to memory corruption and memory leak? This article will introduce the most troublesome bugs for developers in the Linux kernel debugging from three aspects: background, solutions, and summary.
For a long time, there have been two major industry problems in the field of kernel memory debugging: memory corruption and memory leak. The memory problem is strange and erratic. Among the Linux kernel debugging problems, it is one of the most troublesome bugs for developers because the scene where memory problems often occur is already the N-th scene, especially in the production environment. Up to now, there is no very effective scheme to carry out accurate online debugging, resulting intime-consuming, labor-consuming, and difficult troubleshooting. Next, let's take a look at the two difficult problems of memory corruption and memory leak.
Each user mode process in Linux has its own virtual memory space, and the TLB is responsible for mapping management to realize the isolation of non-interference between processes. However, all kernel programs share the same kernel address space in kernel mode, which causes kernel programs to be careful when allocating and using memory.
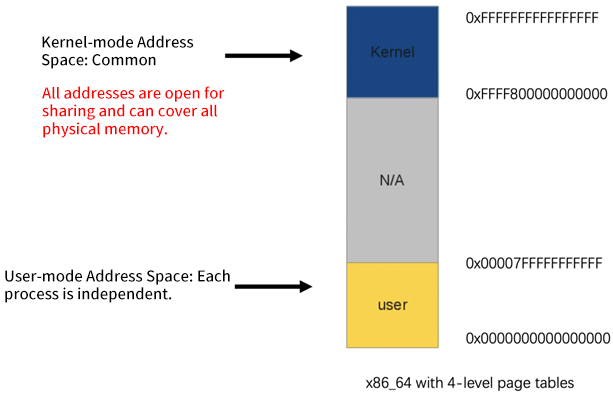
For performance reasons, the vast majority of memory allocation in the kernel is to directly allocate a piece of memory space in the direct mapping area for their use. There are no monitoring and constraints on the specific usage after allocation. The address in the direct mapping area is only a linear offset to the real physical address, which can almost be regarded as directly operating the physical address. It is completely open and shared in kernel mode. This means if the kernel program behaves irregularly, it may contaminate memory in other areas. This can cause many problems, which can directly lead to downtime in severe cases.
A typical scenario example: Let's assume user A has applied to the memory allocation system for addresses 0x00 to 0x0f, which is only a verbal gentleman's agreement. User A does not have to enforce compliance. Due to program defects, user A writes data to 0x10, and 0x10 is the memory space of user B. When user B tries to read the data on his memory space, ze reads the wrong data. If the original data is stored here, there will be calculation errors and various unpredictable consequences. If this is originally a pointer, the entire kernel may be directly down.
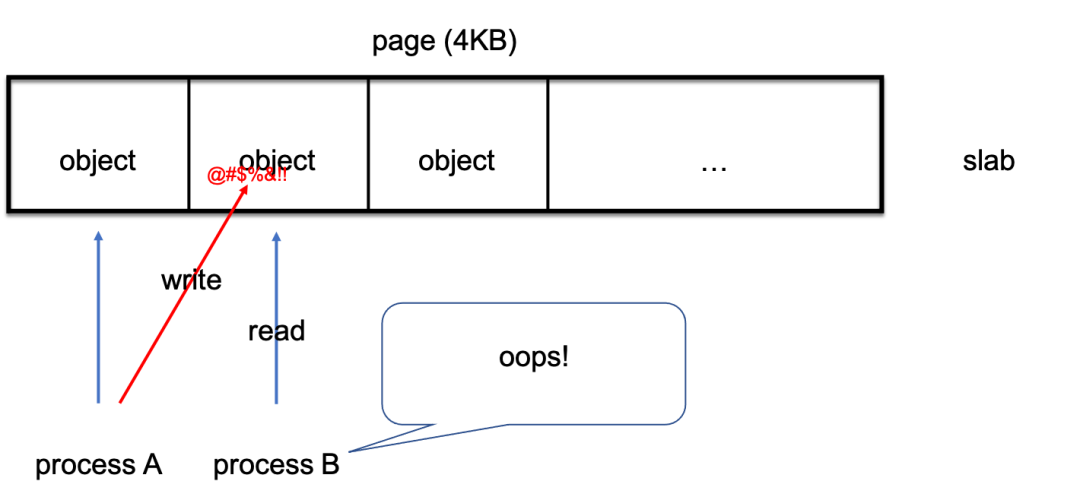
The example above is called out-of-bound access. User A accesses an address that does not belong to user A. Other cases where the memory is modified include use-after-free and invalid-free. In these situations, after user A releases this space, the kernel thinks this space is free and allocates it to user B, but then user A comes back. We can simulate various examples of memory corruption through the following module code:
//out-of-bound
char *s = kmalloc(8, GFP_KERNEL);
s[8] = '1';
kfree(s);

//use-after-free
char *s = kmalloc(8, GFP_KERNEL);
kfree(s);
s[0] = '1';

//double-free
char *s = kmalloc(8, GFP_KERNEL);
kfree(s);
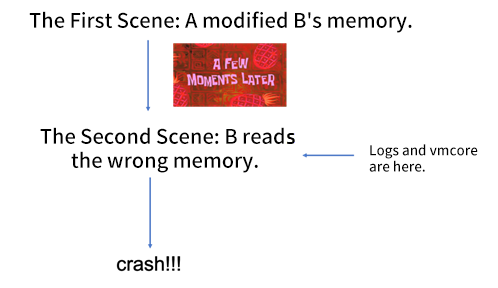
kfree(s);In the example above, the downtime is eventually caused by user B, resulting in various log entries and vmcore, which indicate user B is the troublemaker. In other words, the scene where downtime occurs is already the second scene. There is a time difference from the first scene where the memory was modified, so when the memory problem appears, user A may have disappeared. The kernel developers check for a long time and find out that user B could not have caused this error and don't know why the unexpected error occurred. Therefore, the developer will suspect the memory is modified, but it is very difficult to find the real troublemaker. If you are lucky, you can find clues in the downtime scene (for example, the troublemaker is still nearby, or the value written by the troublemaker is very characteristic), or there are many similar downtimes to find the connection, etc. However, there are situations where there is no clue (for example, the troublemaker has released the memory and disappeared), and it is difficult to reproduce it (for example, there is no other memory users near by, the troublemaker modifies unimportant data, or the modification has been overwritten by the principal).
The Linux community has introduced SLUB DEBUG, KASAN, KFENCE, and other solutions successively to debug the memory corruption.

However, these programs have many limitations:
Compared with the memory corruption, the impact of memory leak is more moderate, which will slowly encroach on the system's memory. As is known to all, it is caused by the program only allocating memory but forgetting to release it.
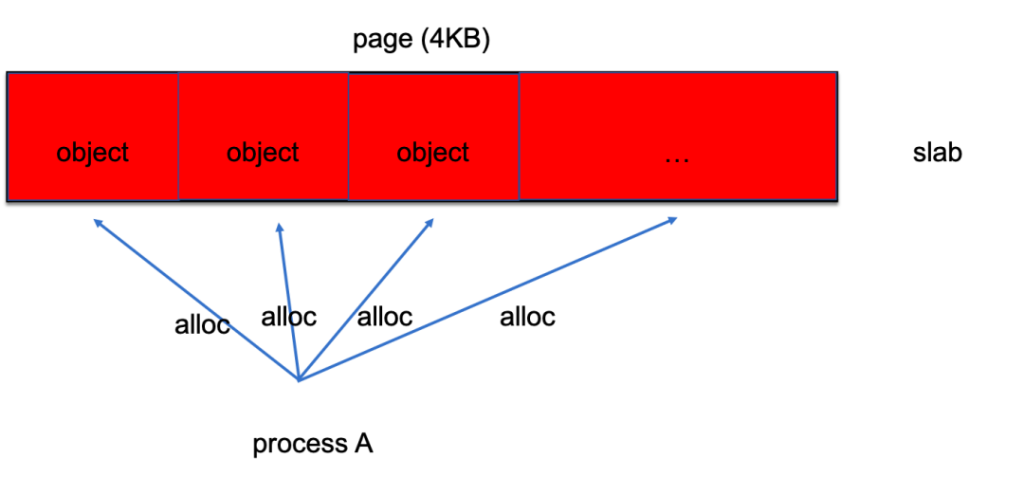
For example, the following module code simulates memory leak:
char *s;
for (;;) {
    s = kmalloc(8, GFP_KERNEL);
    ssleep(1);
}Since the program in the user mode has its independent address space management, the problem can be easily located (At least you can directly see which process has occupied a lot of memory by using "top" command). However, the memory usage in the kernel mode is mixed together, making it difficult to investigate the root cause of the problem. Developers may only be able to observe the growth of a certain memory type (slab/page) through system statistics but cannot find out who has been allocating memory without releasing it. This happens because the kernel does not record the allocation in the linear mapping areas, and there is no way to know who is the owner of the allocated memory.
The Linux community introduced the kmemleak mechanism in the kernel, which periodically scans to check the values in memory for the presence of pointers to allocated areas. The kmemleak method is not rigorous enough to be deployed in online environments. There are many false-positive problems, so the problem orientation is not accurate. In addition, the self-developed O&M tool set sysAK includes detection for memory leak in the user mode. It dynamically collects allocation/release behaviors and combines memory similarity detection to troubleshoot memory leak accurately in the production environment in some scenarios.
When there is a memory problem, if vmcore does not capture the first scene and cannot find the clue, the traditional practice of kernel is to switch to debug kernel and use KASAN offline debugging. However, the online environment is complex, and some very hidden problems cannot be reproduced stably offline, or they are accidental online. These thorny problems often have to be left unsolved, offering more clues the next time they arise. Therefore, we have seen the flexibility of KFENCE and improved it to become a more flexible debugging tool for memory problems in online/offline scenarios.
The advantage of the latest KFENCE technology is that it can flexibly adjust the performance overhead (at the cost of sample rate/the probability of capturing bugs). It can start by restarting without replacing the kernel. The disadvantage is the capture probability is too low, and it is troublesome to restart in an online scenario.
Based on the characteristics of KFENCE technology, we have carried out functional enhancements and added some brand-new designs to support full monitoring and dynamic switching, which is suitable for production environments. It was released in the Linux 5.10 branch of OpenAnolis. The specific implementations are listed below:
If you are interested in specific technical details, you can visit the OpenAnolis kernel code warehouse to read the relevant source code and documents (please visit the end of this article for related links).
Access /sys/kernel/slab/<cache>/kfence_enable for each slab individual switch control and access /sys/module/kfence/parameters/order0_page for order-0 page monitoring switch
The user can set the boot command line kfence.sample_interval=100 and restart to directly turn on KFENCE (original upstream usage) during system startup or manually turn on the sampling function of KFENCE through the echo 100 > /sys/module/kfence/parameters/sample_interval after the system starts.
First, we need to configure the pool size.
An Estimation Method of the Pool Size: One object is approximately equal to two pages (8KB). Considering that splitting the TLB page table into PTE granularity may affect the performance of other address in the same PUD, the final pool size will be aligned by 1GB. (The number of objects will be automatically aligned by 131071.) If the slab filtering function is configured, you can leave the pool size unmodified first and observe the situation with a 1GB pool size by default. If the slab filtering is configured and full monitoring is required, a 10GB pool size is recommended. After determining the pool size, write the corresponding number into the /sys/module/fence/parameters/num_objects. Finally, turn the full mode on by setting the sample_interval to -1. (You can also write these two parameters in the boot cmdline and start the mode as soon as the machine starts.)
How to Observe the Situation: Read the /sys/kernel/debug/kfence/stats interface after kfence starts up. If the sum of the two current slab/page allocated items is close to the object_size you set, it means the pool space is not enough and needs to be expanded. (First, write 0 to the sample_interval to close the kfence, change the num_objects, and finally write -1 to the sample_interval to start the kfence.)
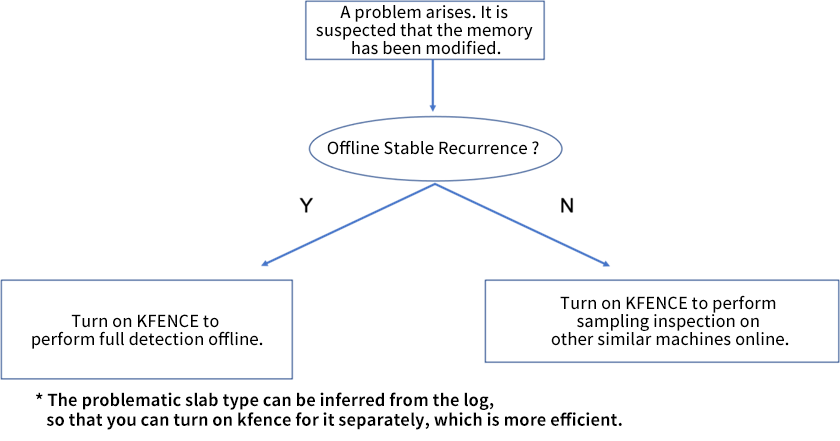
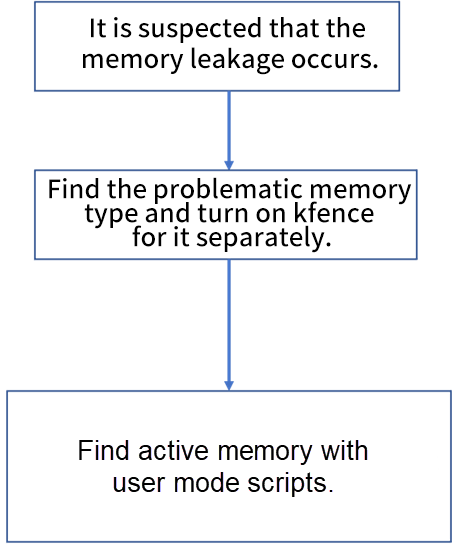
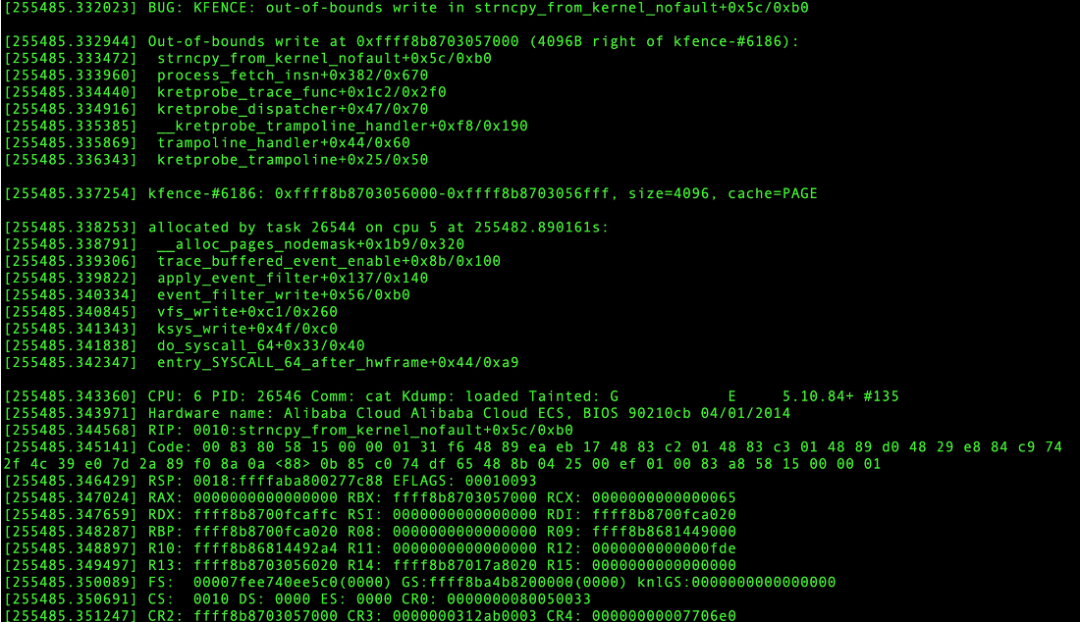
If the memory is modified, the call stack will be printed in dmesg after the behavior is captured. The call stack contains everything from the trigger scene to the memory allocation/release process to help accurately locate the problem.
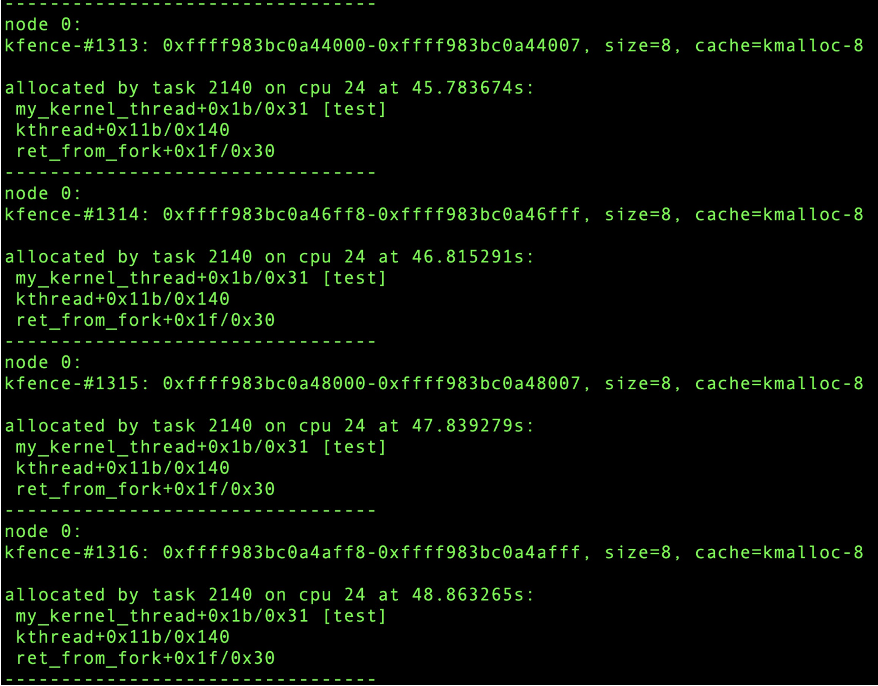
For memory release, you can use the user-mode scripts to scan the active memory in the /sys/kernel/debug/kfence/objects (only alloc has no free records) to find the most identical call stacks:
We use a bare metal machine on ECS for testing. Intel Xeon (Cascade Lake) Platinum 8269CY with 104 vCPUs. Use hackbench to set the thread (104) and measure the performance according to different sampling times:
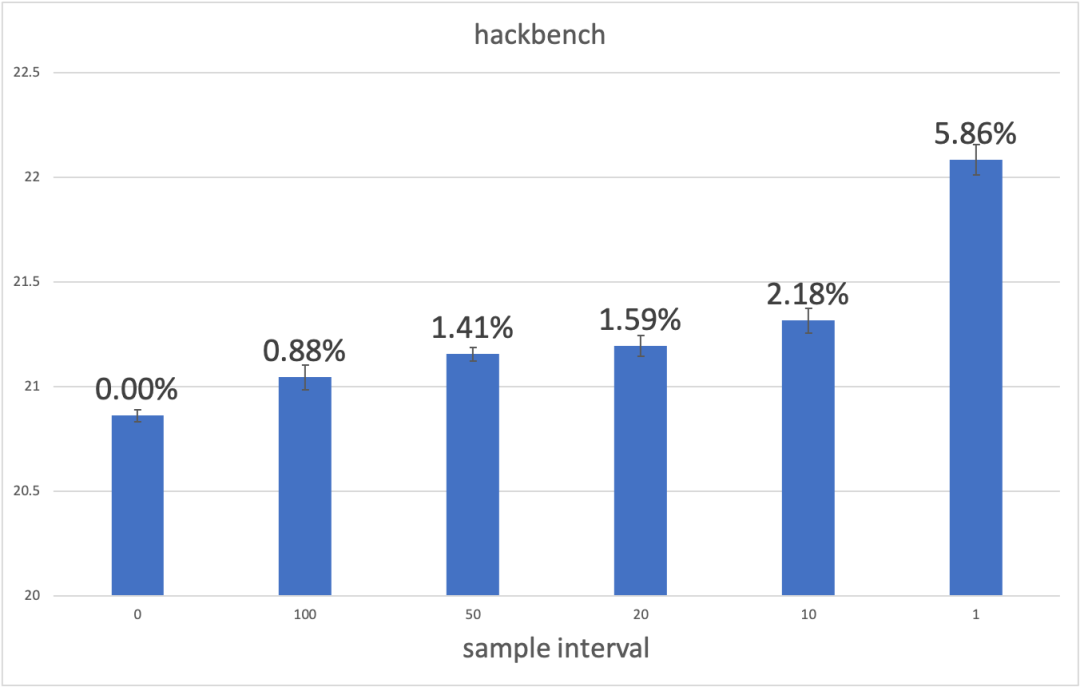
As you can see, when the sampling interval value is relatively large (for example, the default value is 100ms), KFENCE has almost no impact on performance. If the sampling interval value is set smaller, you can get a higher success rate of capturing bugs with small performance loss. Note: The hackbench test is also the benchmark used by the author of upstream KFENCE. The benchmark frequently allocates memory, so it is sensitive to kfence. This test case can reflect the performance of kfence in a bad scenario. The performance in a specific online environment depends on the business.
The use environment is the same as above. Use sysbench's oltp.lua script to set 16 threads for testing. Observe the mean and p95 percentile of throughput (tps/qps) and response time (rt), respectively.
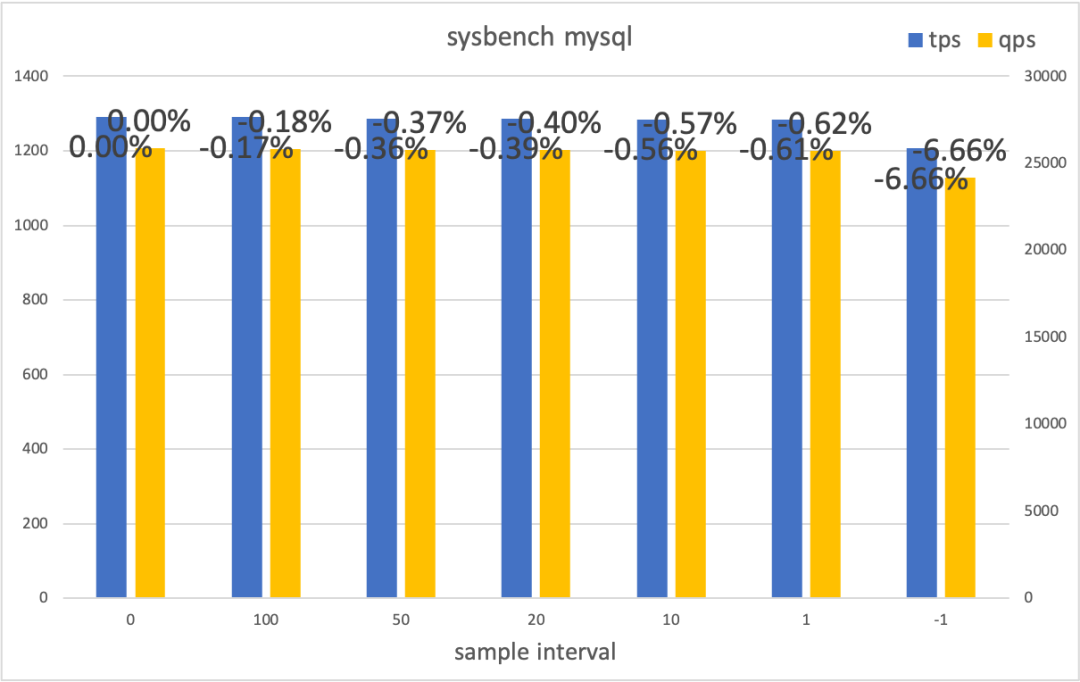
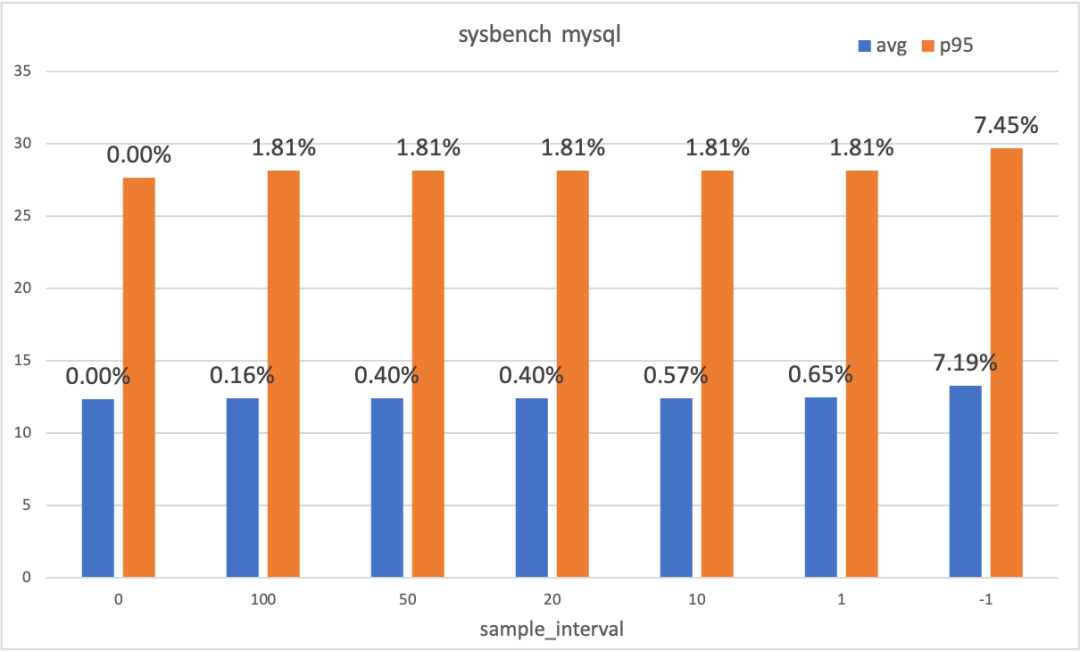
The MySQL test impact on the business is minimal in the sampling mode. The impact on the business is visible (about 7% in this example) in the full mode. Deciding whether to enable the full mode needs to be evaluated based on the actual scenario. Note: This test enables the full mode. If the problematic slab type is found, the additional overhead caused by kfence can be reduced further with the filtering function.
We have implemented an online, accurate, flexible, and customizable memory debugging solution by enhancing the function of kfence in the Anolis 5.10 kernel, which can effectively solve the two major problems of online kernel memory corruption and memory leak. At the same time, we added a full mode to ensure the first scene of the bug occurrence is quickly caught in the debugging environment. However, the KFENCE enhancement solutions also have some disadvantages:
Scenarios (such as global /local variables, dma hardware direct read/write, composite pages and wild pointers) are not supported. However, according to our statistics on memory problems, all the problems online are memory problems related to the slab and order-0 page, which shows that the solutions in this article are sufficient for the current online scenario in terms of coverage.
Currently, the memory expense can be significantly reduced by supporting individual per-slab switches and setting intervals. Next, we plan to develop more optimization and stability work to deal with large memory overhead.
Source Code and Documentation Related to the OpenAnolis Kernel Code Warehouse:
https://gitee.com/anolis/cloud-kernel/blob/devel-5.10/Documentation/dev-tools/kfence.rst
When Java Meets Confidential Computing, Another Fantastic Journey Begins!

104 posts | 6 followers
FollowXianYu Tech - May 11, 2021
amap_tech - December 2, 2019
Alibaba Clouder - November 26, 2019
OpenAnolis - December 26, 2025
OpenAnolis - March 4, 2026
hyj1991 - July 22, 2019

104 posts | 6 followers
Follow Apsara Stack
Apsara Stack is a full-stack cloud solution created by Alibaba Cloud for medium- and large-size enterprise-class customers.
Learn More ECS(Elastic Compute Service)
Elastic and secure virtual cloud servers to cater all your cloud hosting needs.
Learn More Super Computing Cluster
Super Computing Service provides ultimate computing performance and parallel computing cluster services for high-performance computing through high-speed RDMA network and heterogeneous accelerators such as GPU.
Learn More Elastic High Performance Computing
A HPCaaS cloud platform providing an all-in-one high-performance public computing service
Learn MoreMore Posts by OpenAnolis