By SysOM SIG
The customer receives a system alert. The used memory of some nodes in the Kubernetes cluster continues to increase. When using the top command to check the memory, the client finds that processes do not use much memory. The remaining memory is insufficient, but the one that occupies the memory cannot be found. It seems the memory has disappeared mysteriously. At this time, it is necessary to check where the memory went.

The top instruction is executed, and the output is sorted by memory usage. For all processes, the highest memory usage is only about 800 MB, far less than the total memory usage of 9 GB.

Before analyzing the specific problems, we classify the system memory to find out abnormal memory usage. From the nature of memory use, we can divide the memory into application memory and kernel memory. The sum of application memory, kernel memory, and free memory should be close to the total memory. As such, we can quickly locate the area with the memory issue.
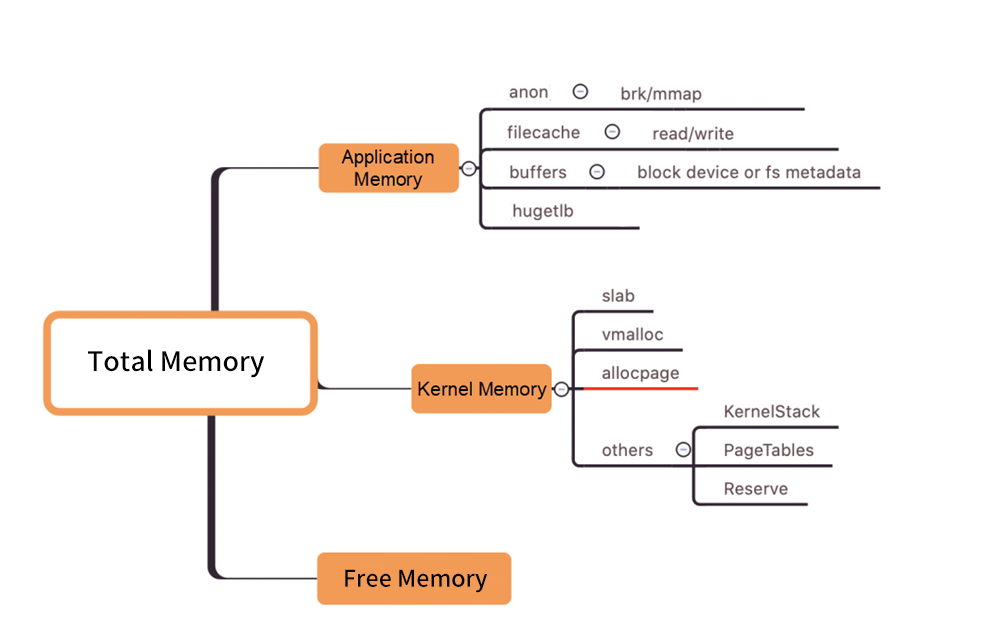
In the figure above, allocpage refers to the memory (excluding slab and vmalloc) directly requested from the buddy system through __get_free_pages/alloc_pages and other APIs.
If we calculate the application memory and kernel memory separately based on the figure above, we can know which part is abnormal. However, the calculation is complicated, and many memory values overlap. The memory dashboard of SysOM can display memory usage in a visualized manner to solve this problem. It directly shows whether there is a memory leak. In this case, with the help of SysOM, we can know that allocpage has a leak, and the usage is close to 6 GB.
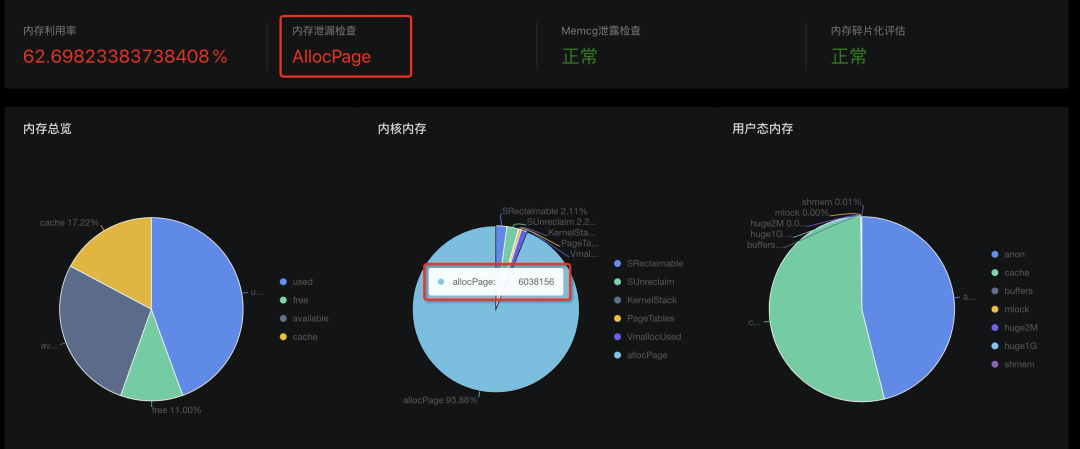
Since allocpage occupies a large amount of memory, can we view its memory usage directly from file nodes sysfs and procfs? The answer is no. This part of the memory is used by a single or multiple consecutive pages applied from the buddy system by the kernel or driver by directly calling __get_free_page/alloc_pages and other APIs. There is no API at the system level to query the memory usage details. If allocpage memory leak occurs, we may find the memory disappears without reason. This issue is difficult to be detected, and the cause of the issue is hard to be found. SysOM can carry out memory statistics and diagnosis to solve this problem.
SysAK (a useful diagnostic tool of SysOM) is needed to capture the usage of such memory dynamically.
For kernel memory leaks, we can directly use SysAK for dynamic tracking. Execute the command and wait for ten minutes:
sysak memleak -t page -i 600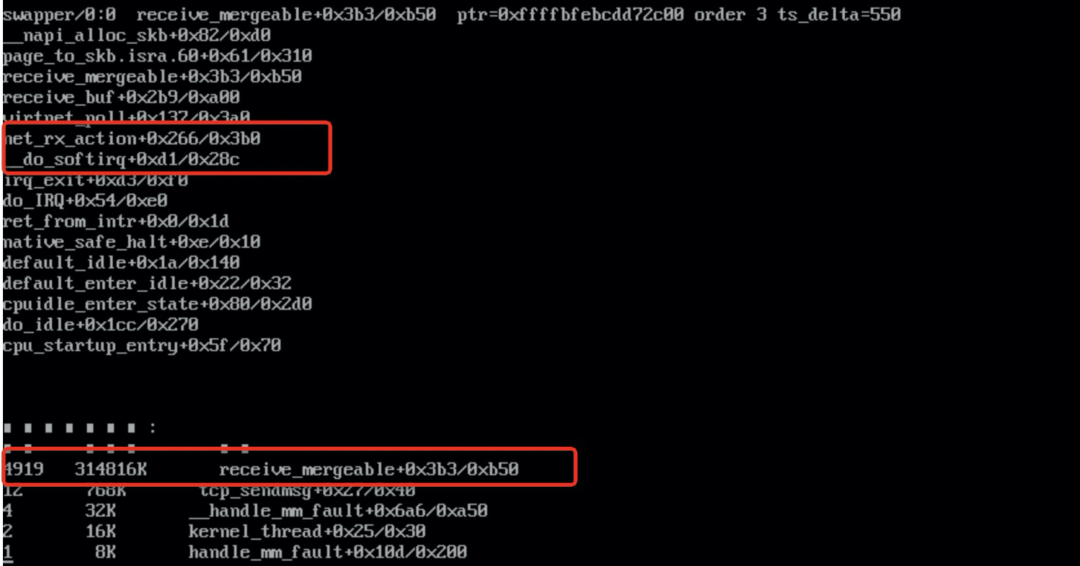
The diagnosis results show that the memory allocated by the receive_mergeable function has not been released 4,919 times within ten minutes. The memory size is about 300 MB. Now, we need to check the code to confirm whether the memory allocation and release logic of the receive_mergeable function is correct.
1) page_to_skb will allocate an skb with a zone of 128 bytes for linear data at a time.
2) The data zone calls the alloc_pages_node function to apply for 32 KB of memory (order=3) from the buddy system at one time.
3) All skbs will reference the 32-KB head page. The 32 KB of memory will be released to the buddy system only when all skbs are released.
4) The receive_mergeable function is responsible for applying for memory but is not responsible for releasing this part of memory. When the application reads data from Recv-Q of the socket, the reference count of the head page will be reduced by 1. When the value of page refs is 0, the memory is released back to the buddy system.
When the application consumes data slowly, the memory applied by the receive_mergeable function may not be released in time. In the worst case, one skb will occupy the whole 32-KB memory. sysak skcheck can be used to check the receiving queue and sending queue of the socket.

From the output, we can know that only the receiving queue of an NGINX process in the system has residual data. The Recv-Q of socket fd=11 has nearly 3-MB data that is not received. By killing the process (pid = 146935), the system memory becomes normal, so the root cause of the issue is that NGINX did not receive the data in time.
After communicating with the business party, it is finally confirmed that the business configuration is not proper, so a thread of NGINX does not process data. Therefore, the memory applied by the NIC driver is not released in time. However, statistics of the allocpage memory cannot be carried out, so the memory seems to have disappeared for no reason.
Is there really residual data in the receiving queue? Here, the corresponding sock is found through fd using the files instruction of the tool crash.
socket = file->private_data
sock = socket->sk
Observations show that the skb in sk_receive_queue has not changed for a long time. This proves that NGINX does not process the skb in the receiving queue in time. As a result, the memory applied by the NIC driver is not released.
We are confused about one thing during troubleshooting. The usage of tcp mem and skbuff_head_cache of sockstat and slabtop after the check is normal, which covers up the memory occupied by the network.
tcp mem = 32204*4K=125M
The number of skbs ranges from 15,000 to 30,000:

The analysis in the previous section shows that one skb can take up 32 KB of memory in the worst case. Therefore, 20,000 skbs take up about 600 MB of memory. How can the memory occupation be so high (GB level)? Is there a problem with the analysis? As shown in the following figure, there may be several frag pages in the nonlinear zone of an skb, and each frag page may consist of compound pages.
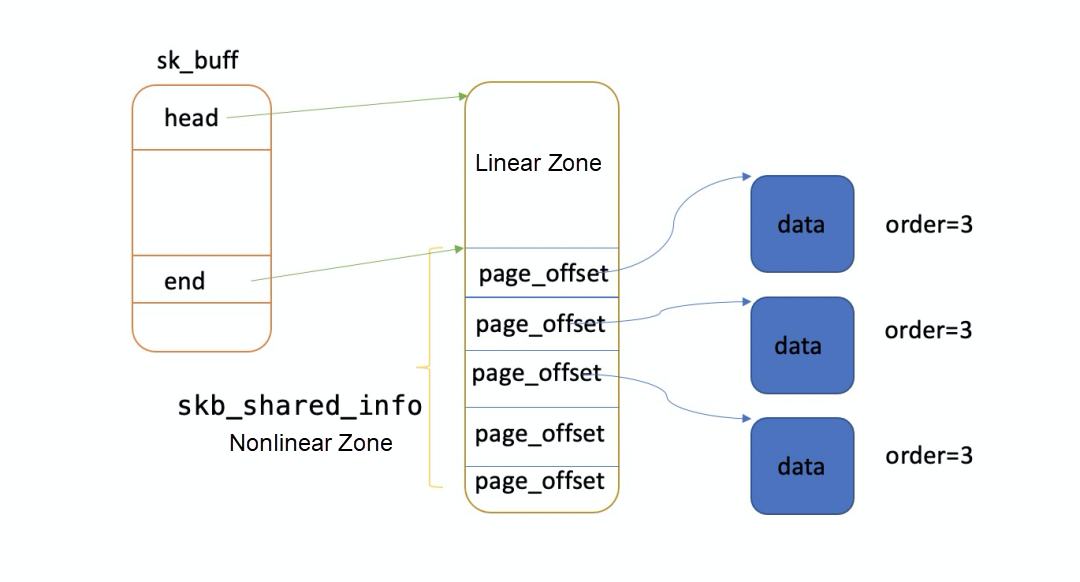
By using crash to read skb memory, we find that some skbs have 17 frag pages and the data size is only 10 bytes.
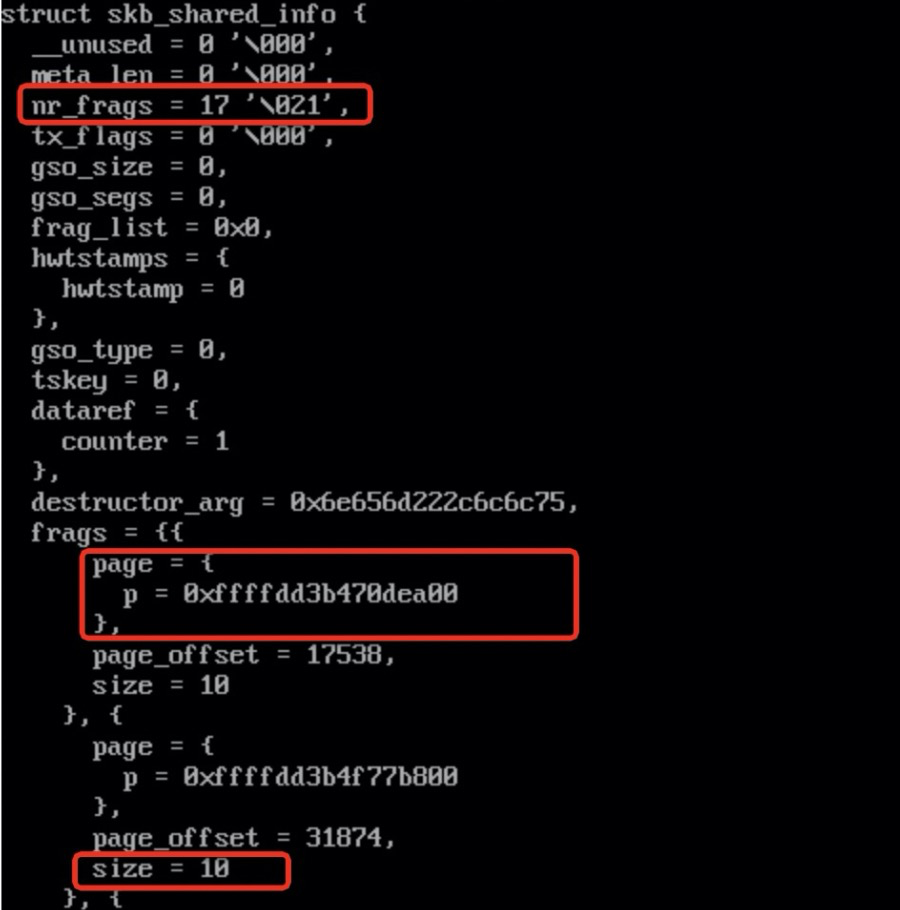
The order for parsing frag pages is 3, which means that a frag page occupies 32 KB of memory.

In extreme cases, one skb may possess 144 pages. The number of active objects in skbuff_head_cache of slabinfo in the preceding figure is 15,033, so the theoretical maximum total memory equals 144150334K = 8.2 GB. So, it is possible that 6 GB of memory is occupied.
Improving Kubernetes Service Network Performance with Socket eBPF
Coolbpf Is Open-Source! The Development Efficiency of the BPF Program Increases a Hundredfold

104 posts | 6 followers
FollowOpenAnolis - March 25, 2026
OpenAnolis - June 25, 2025
OpenAnolis - January 24, 2024
OpenAnolis - March 5, 2026
OpenAnolis - September 21, 2022
OpenAnolis - May 8, 2023

104 posts | 6 followers
Follow CloudOps Orchestration Service
CloudOps Orchestration Service is an automated operations and maintenance (O&M) service provided by Alibaba Cloud.
Learn More ChatAPP
Reach global users more accurately and efficiently via IM Channel
Learn More Microservices Engine (MSE)
MSE provides a fully managed registration and configuration center, and gateway and microservices governance capabilities.
Learn More Cloud Migration Hub
Cloud Migration Hub (CMH) provides automatic and intelligent system surveys, cloud adoption planning, and migration management for you to perform migration to Alibaba Cloud.
Learn MoreMore Posts by OpenAnolis