By Xiaoxiang, from Xianyu Technology Team
Memory utilization is one of the important indicators to judge the performance of an app. Developers reduce memory usage as much as possible and clear useless memory blocks to reduce the memory usage of the app. This is something developers always pursue. However, inevitably, the to-be-released objects are not released due to language usage or writing conditions. As a result, memory leaks occur, and the memory space is depleted, which leads to a system crash.
Different ways to make it easier for developers to analyze, discover, and solve memory leaks is almost a common feature for every platform, framework, and developer. For example, there are Apple's instruments and Linux's Kmemleak. However, for the Flutter community, a user-friendly memory leak tool is still not available.
For Flutter, Dart can form a rendering tree and then submit the rendering tree to Skia developed in C++. The rendering procedure is very long from the Dart layer to the C++ layer. Therefore, users must have a deep understanding of the whole rendering process to fully understand the memory usage.
Based on the Flutter rendering principle, this article analyzes the memory allocation of Flutter, explains the rendering process, and proposes a solution for memory leaks based on the number of rendering trees.
When it comes to memory, it usually refers to physical memory. When the same application runs on different machines or operating systems, the size of the allocated physical memory varies depending on the operating system and hardware conditions. Generally, virtual memory used by an application is roughly the same. The memory discussed in this article is virtual memory.
All objects operated in the code can be measured by virtual memory without focusing on if the object exists in physical memory or not. It is considered ideal when the objects consume less memory.
Flutter uses three types of languages:
When it comes to the memory used by Flutter from the perspective of the process, it refers to the sum memory of the three layers. For simplicity, the memory can be divided into DartVM and native memories according to the code that users can directly contact. DartVM memory refers to the memory used by the Dart virtual machine, while native memory contains running memories of the Engine and platform-related code.
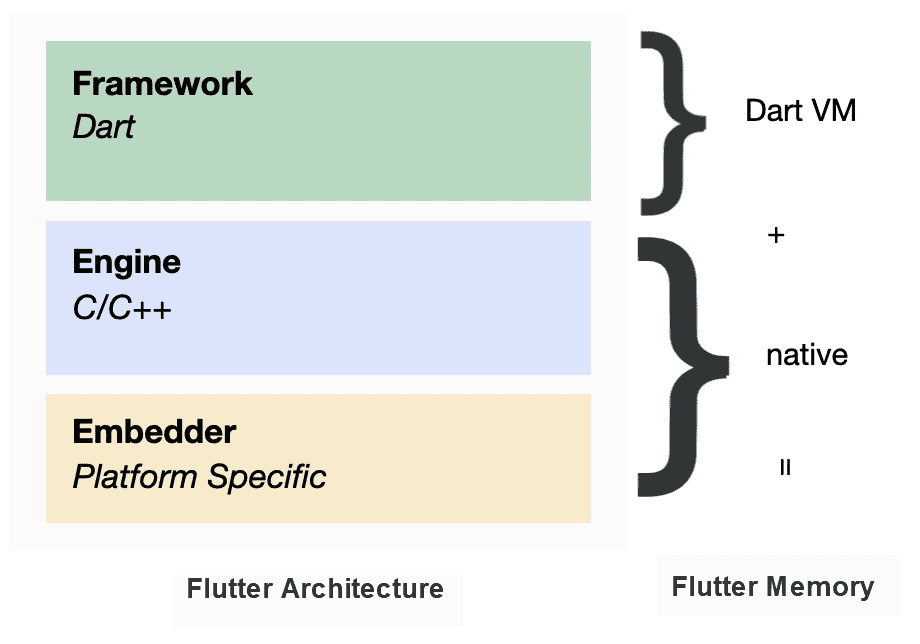
Since the most direct objects that Flutter users can access are objects generated by Dart, users cannot figure out how to create and destroy objects in the Engine layer. For the answer, it is necessary to discuss the design of the Dart virtual machine binding layer.
Due to performance, cross-platform operation, or other reasons, scripting languages or virtual machine-based languages cause C/C++ or function objects to be bound with interfaces of specific language objects. Thus, C/C++ objects or functions can still be manipulated in languages. This API layer is called the binding layer. The examples are Lua binding and Javascript V8 binding, which can be embedded in an application easily.
During the initialization of a Dart virtual machine, a class or a function declared by C++ will be bound with a class or function of Dart. Then, they will be injected into the global traversal during the Dart runtime in sequence. When the Dart code runs a function, it directs to a specific C++ object or a function.
The following shows several common bindings of C++ classes and corresponding Dart classes:
flutter::EngineLayer --> ui.EngineLayer
flutter::FrameInfo --> ui.FrameInfo
flutter::CanvasImage --> ui.Image
flutter::SceneBuilder --> ui.SceneBuilder
flutter::Scene --> ui.Scene
Let's take ui.SceneBuilder as an example. The following diagram shows how Dart binds a C++ object instance and controls its parsing process. The rendering process of the Dart layer is about configuring the layer rendering tree and submitting it to the C++ layer. ui.SceneBuilder is the container for this rendering tree.
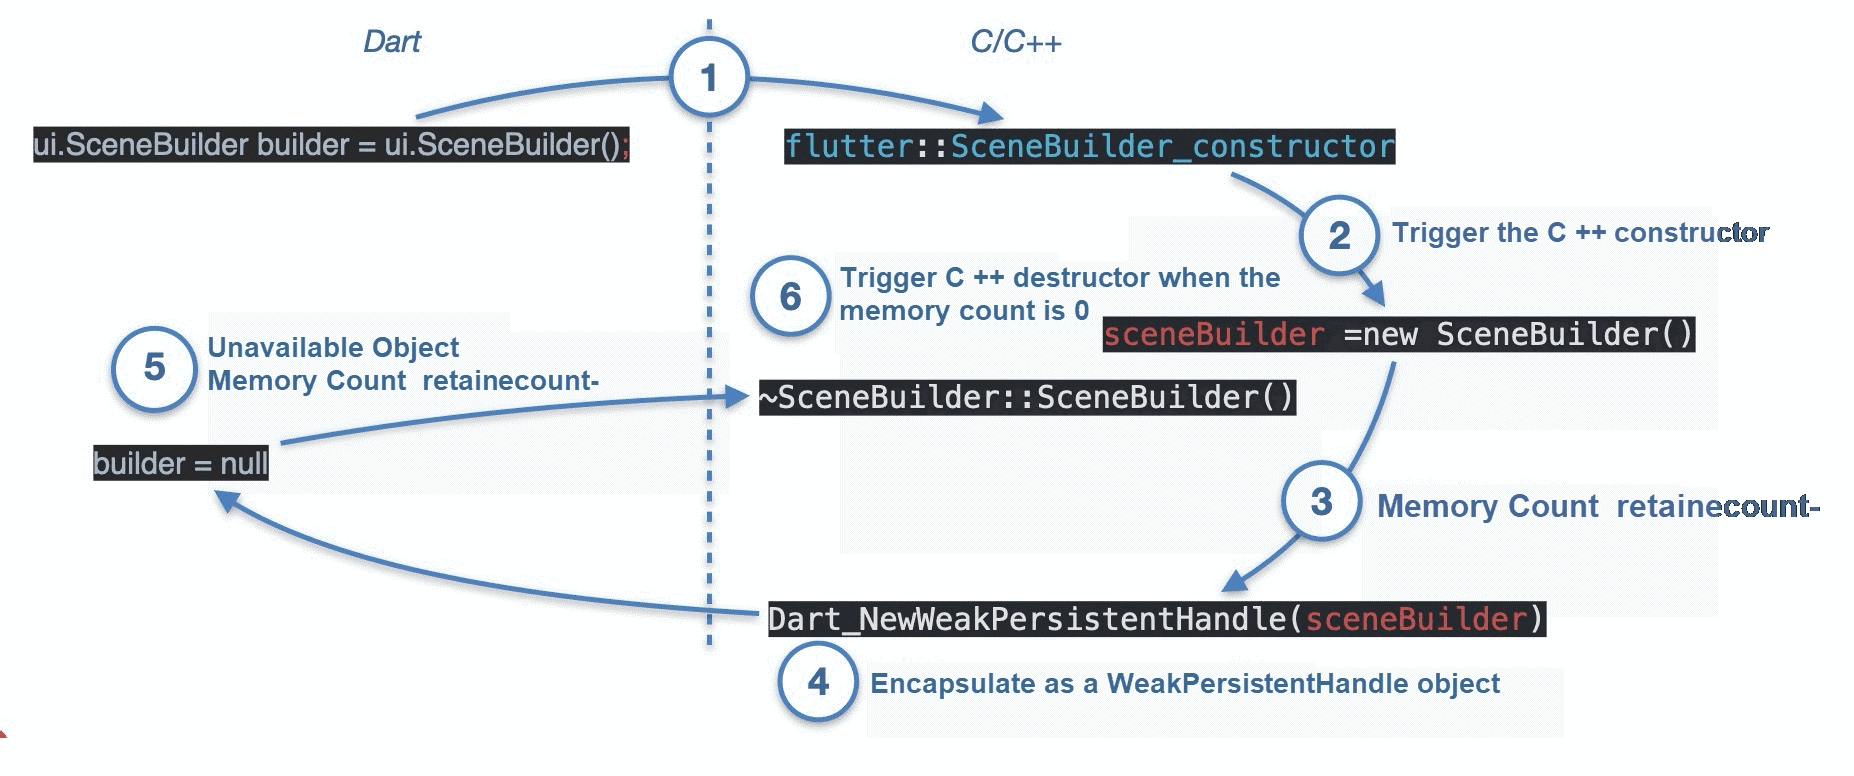
ui.SceneBuilder(), it calls the C++ method SceneBuilder_constructor.flutter::SceneBuilder_constructor and generates a C++ instance, sceneBuilder.flutter::SceneBuilder inherits from the memory count object RefCountedDartWrappable, the memory count increases by 1 after the object is generated.sceneBuilder is encapsulated as the westpersitenthandle through the Dart API and is injected into the Dart context. After that, Dart can use this builder object to operate the C++ instance flutter::SceneBuilder.As shown above, Dart encapsulates the C/C++ instances into WeakPersitentHandle and injects them into the Dart context. Thus, it controls the creation and release of C/C++ instances through the GC of the Dart virtual machine.
More directly, as long as the Dart object corresponding to the C/C++ instance can be collected normally by GC, the memory space that C/C++ points to will be normally released.
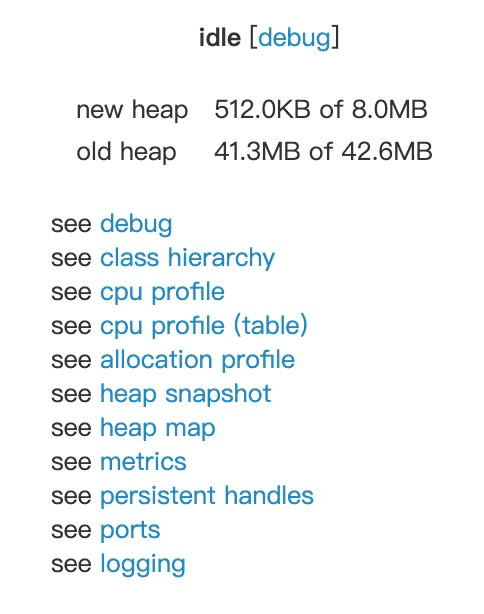
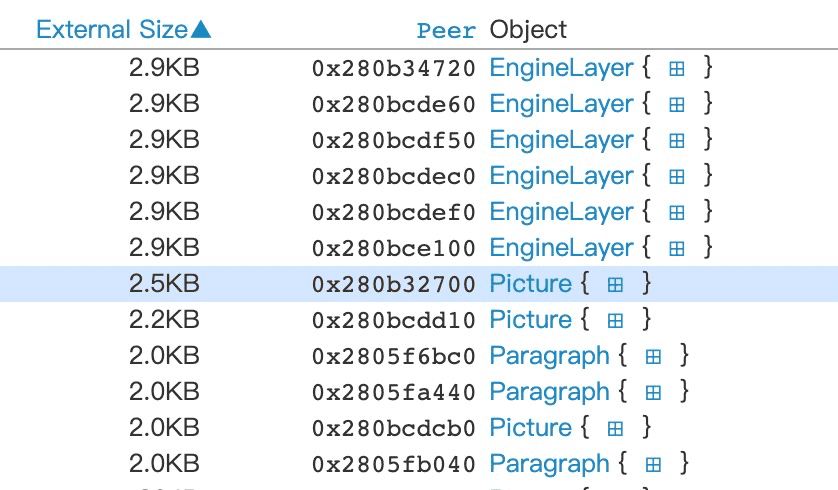
WeakPersistentHandle?As Dart objects often move in virtual machines due to fragmented GC organizing, the use of objects indirectly points to objects by using handles. Furthermore, C/C++ objects or instances are located outside the Dart virtual machine. Their lifecycle is not constrained by the scope and always exists in the whole Dart virtual machine for a long time. Thus, it is Persistence. Therefore, WeakPersistentHandle points to the lifecycle and persistent handles, which are used to encapsulate C/C++ instances in Dart. You can check all the WeakPersistentHandle objects in the Observatory tool provided by Flutter.
The Peer column is the pointer that encapsulates the C/C++ objects.
GC releases Dart objects by determining whether the objects are still available. Availability means the objects are accessed through the reference chain between objects, starting from some root nodes. If the object can be accessed through the reference chain, it indicates that the object is available. Otherwise, it is not.
A yellow mark means the object is available, and a blue mark means the object is unavailable.
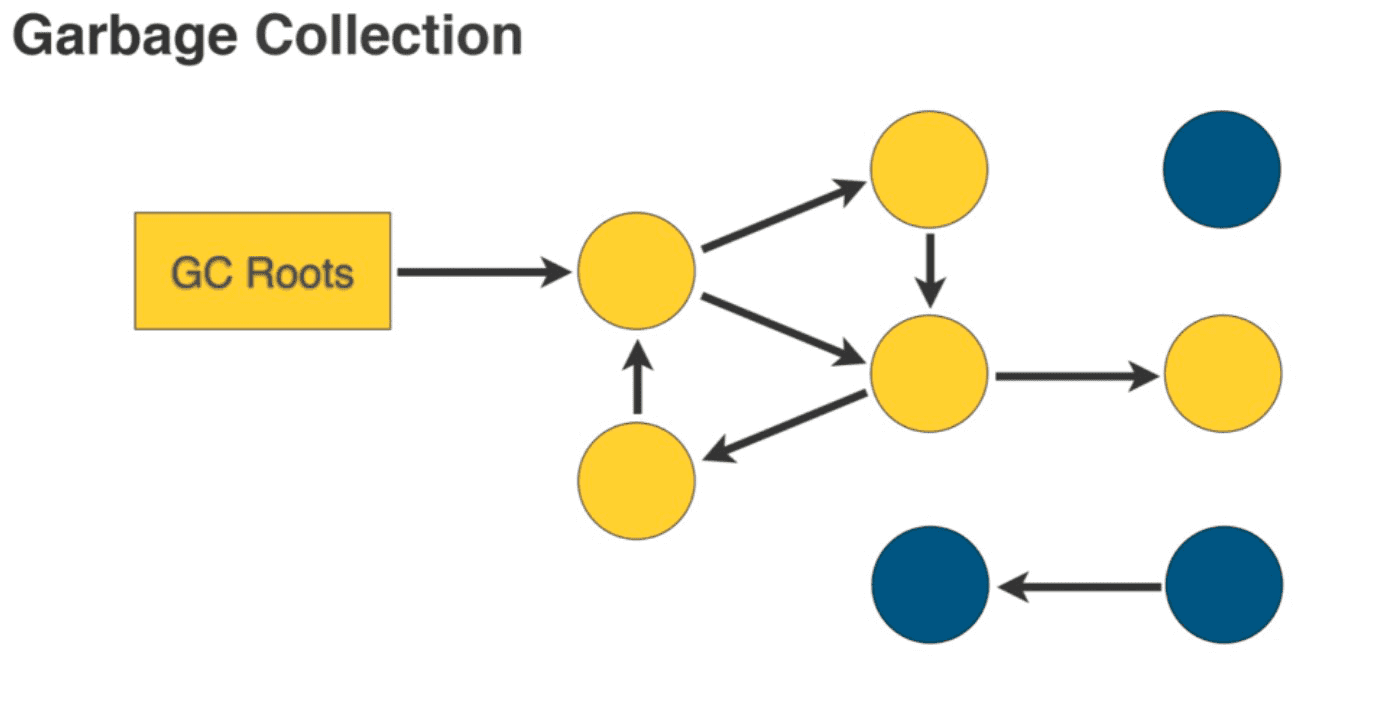
It is difficult to perceive the disappearance of C/C++ objects from the Dart side because Dart objects do not have a unified destructor like C++. Once the object is referenced long-term by other objects due to reasons, such as circular reference, GC will not be able to release it. This will eventually lead to a memory leak.
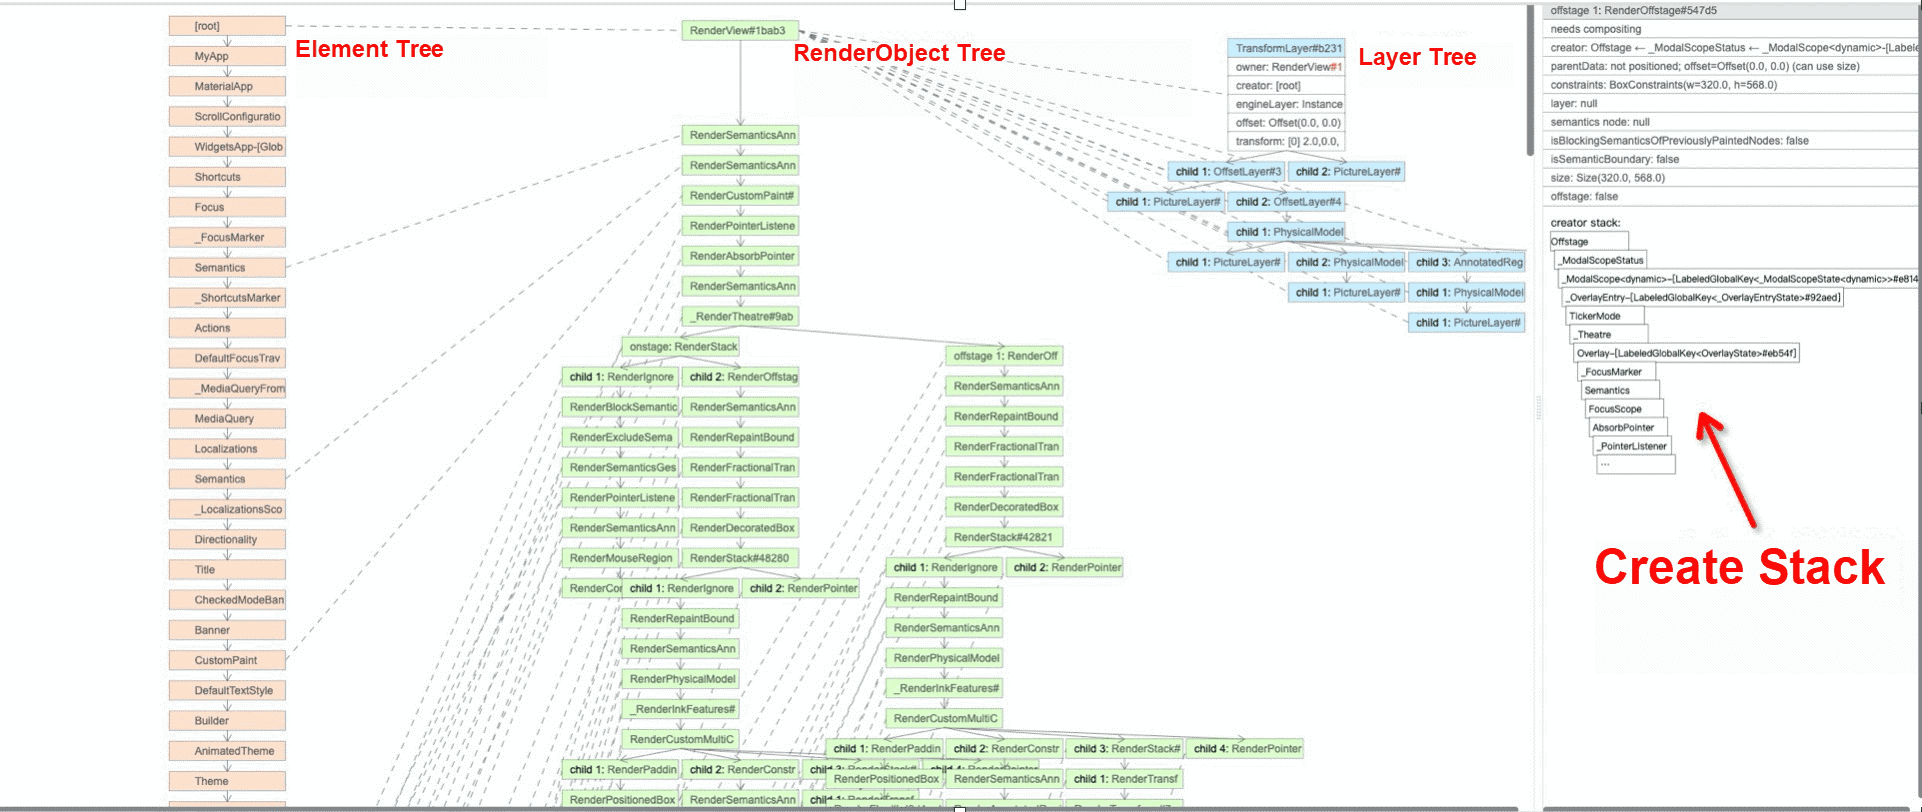
Let's discuss this problem in Flutter. Flutter is a rendering engine. A Widget tree is constructed through Dart language. Then, the Widget tree is simplified into the Element tree, then into the RenderObject tree, and into the Layer tree at last through drawing. Next, the Layer tree is submitted to the C++ layer for rendering using Skia.
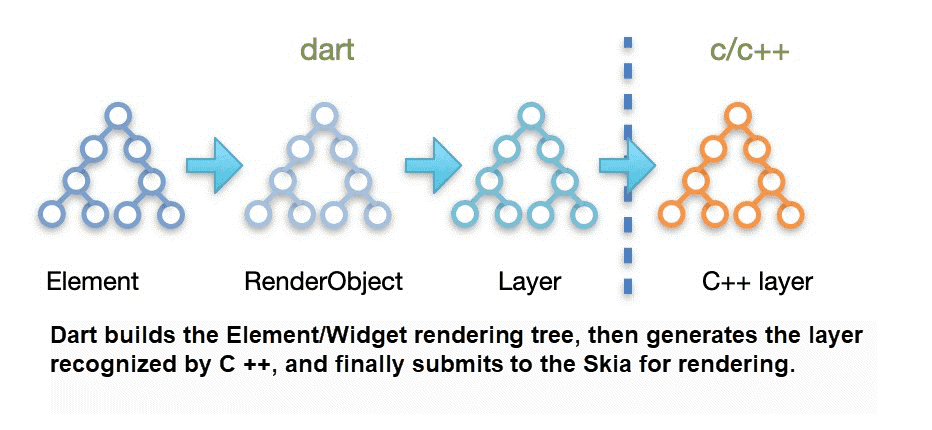
If a node of a Widget tree or an Element tree cannot be released for a long time, it may be hard to release its sub-nodes. Thus, the leaked memory space will expand rapidly.
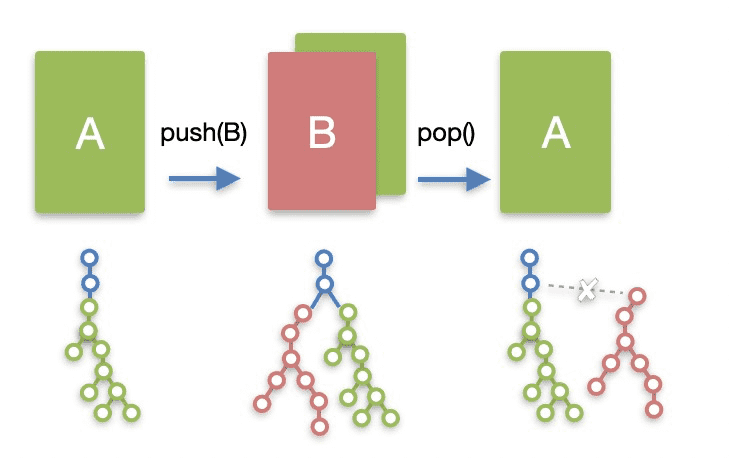
For example, there are two interfaces, A and B. Interface A adds interface B through Navigator.push, and interface B rolls back to A through Navigator.pop. If the rendering tree of B cannot be released, although unraveled from the main rendering tree due to some writing methods on the B, the whole original subtree of B cannot be released.
Based on the case above, memory leaks caused by former interface releases can be detected by comparing the rendering node number of the current frame and the current memory.
In Dart code, a rendering tree is built by adding EngineLayer to ui.SceneBuilder. So, the number of EngineLayer in the C++ memory can be detected and compared with what is used in the current frame. If the number of EngineLayers in the memory surpasses what is used for a long time, it means there is a memory leak.
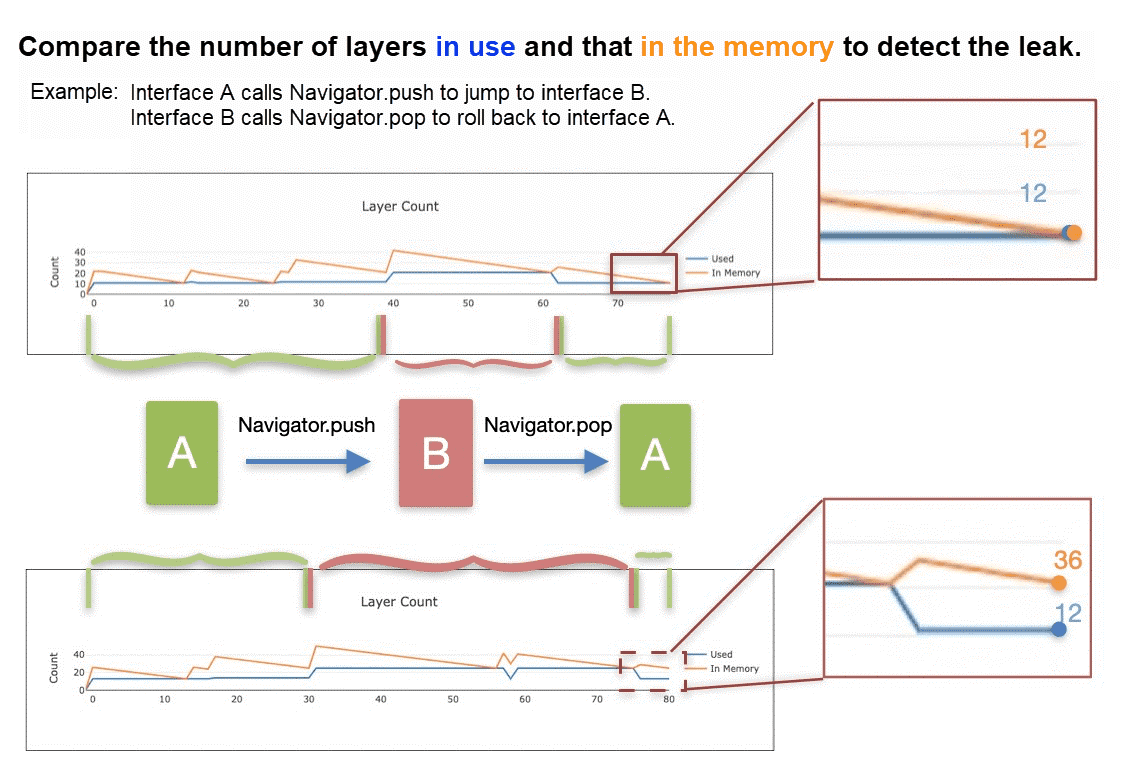
Let's use the case above as an example again. If there is no memory leak, two curves will reach almost the same value eventually, though they may fluctuate. The blue curve stands for the number of layers in use, and the orange curve stands for the number of layers in the memory.
When interface B rolls back to A with a memory leak, the rendering tree of B will not be released. The orange curve cannot conform to the blue curve. For rendering, if the Widget tree or Element tree cannot be collected by GC for a long time due to code, it is likely to cause a serious memory leak.
Currently, scenarios of asynchronous code running (Feature, async/await,methodChan) have been in BuildContext for a long time. As a result, the element remains for a long time after being removed, resulting in the leakage in the associated widget and state.
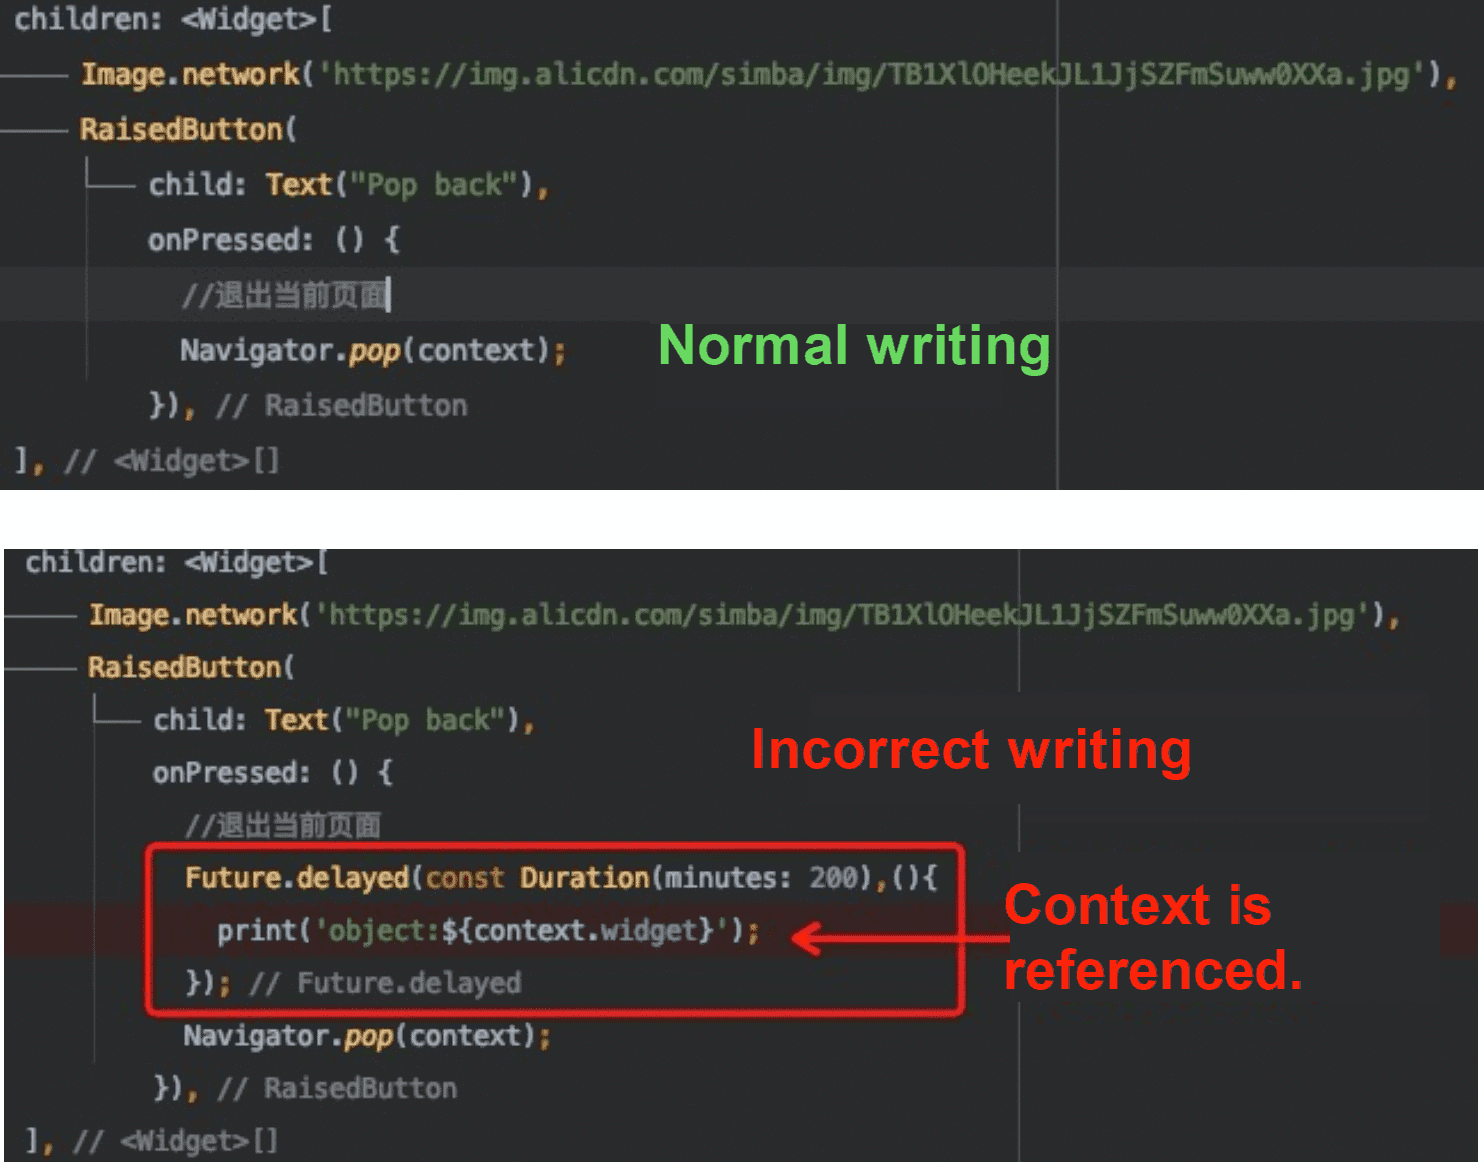
Let's take another look at the memory leak example of interface B on the images below:
The difference between correct and incorrect code writing is that the BuildContext uses the asynchronous method Future before Navigator.pop is called. This causes a memory leak on interface B.
The current design of the Flutter memory leak detection tool compares the objects before and after entering the interface. Then, the tool finds out the unreleased objects and views the unreleased reference relationships (retained path or inbound references.) Next, it conducts analysis based on the source code to find the incorrect code.
The reference relationship of each leaked object can be viewed one by one with the Flutter Observatory. However, it is very complicated to find incorrect codes in all leaked objects in the Observatory. The number of layers generated is very large on the slightly more complex interface. For this reason, we have visualized how complicated positioning works.
We record all EngineLayer submitted to the Engine on a line chart frame by frame. If the number of layers in the memory is unusually greater than what is in use, there is a memory leak on the previous page.
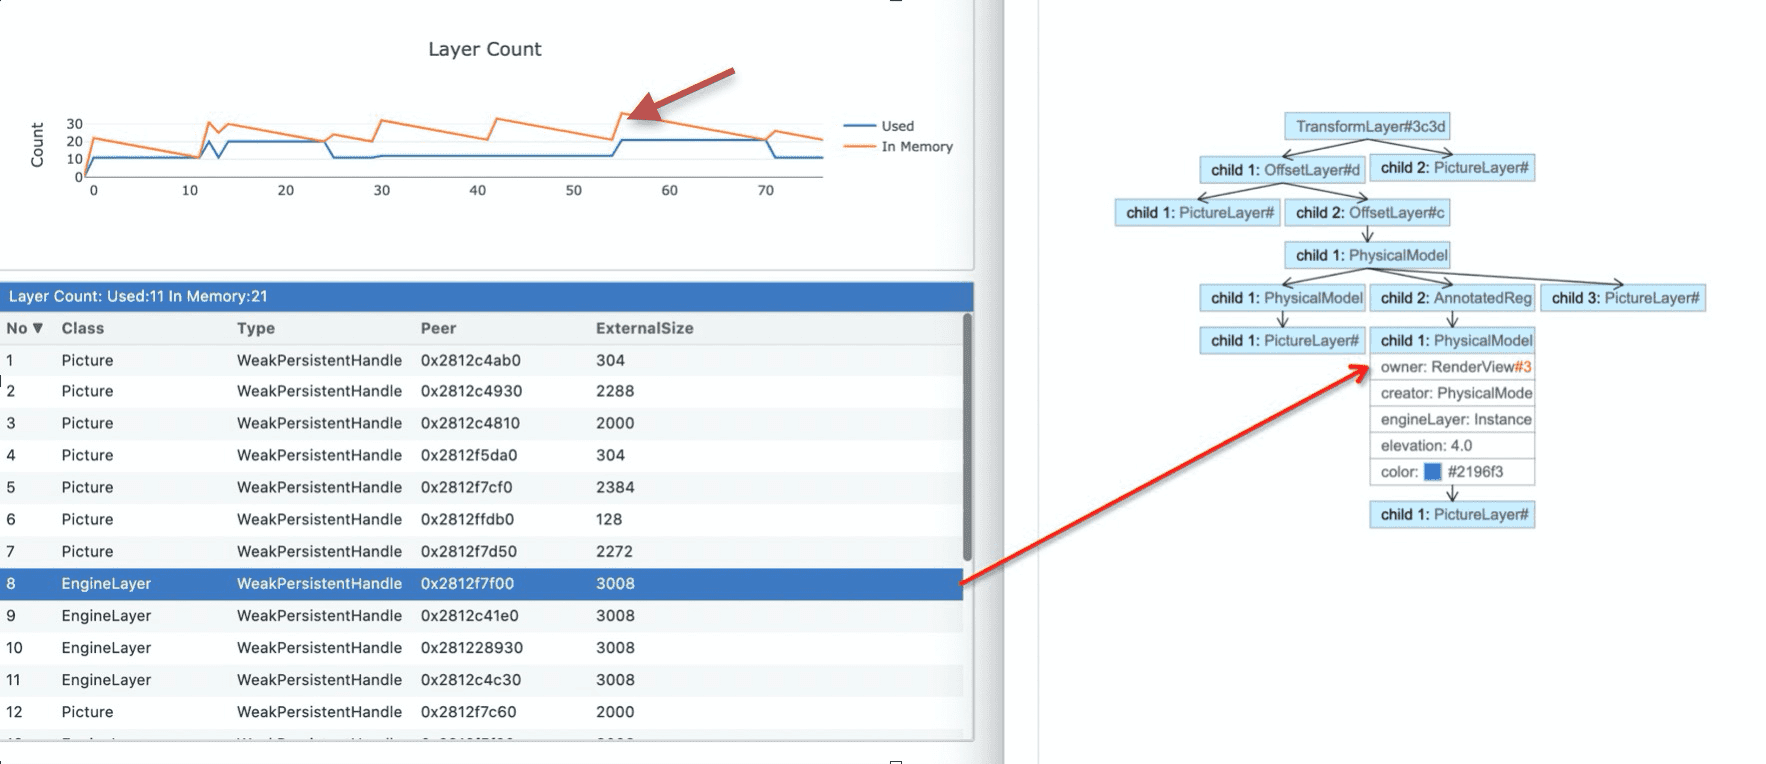
Users can also fetch the structure of the Layer tree of the current page to determine which RenderObject tree generates the Layer tree. Users can continue to analyze which Element node generates the RenderObject node.
You can print the reference chain of WeakPersitentHandle for auxiliary analysis.
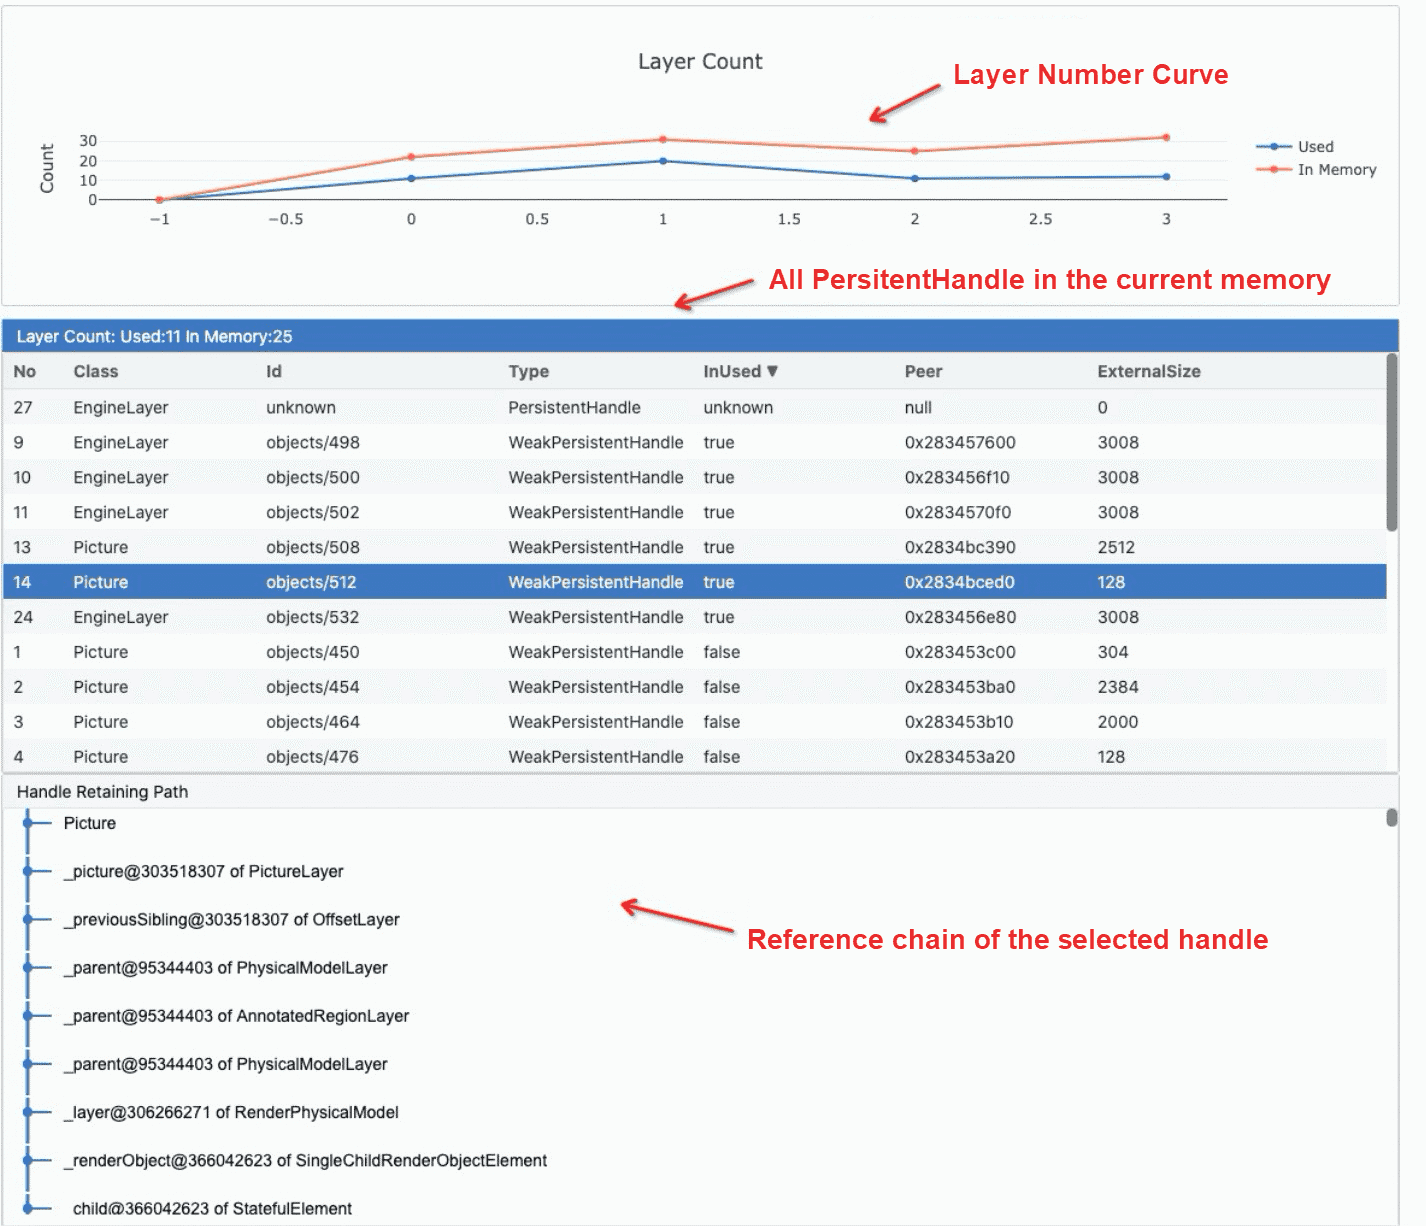
However, the pain point still exists today. It is still necessary to check the reference chain of the Handle and analyze the source code to define the problem quickly. This is the problem that needs to be solved urgently.
Xianyu has been working on Flutter for a long time and is continuously making efforts in the Flutter toolchain. The important memory detection tool is being developed continuously, and you are welcome to follow our development on the tool!
From Nothing to Something: Xianyu's Path to Integration with Flutter

56 posts | 4 followers
FollowAlibaba Clouder - December 22, 2020
Joyer - January 11, 2021
Alibaba Tech - April 24, 2020
卓凌 - September 8, 2020
Alibaba Tech - February 24, 2020
XianYu Tech - May 13, 2021

56 posts | 4 followers
Follow Web Hosting Solution
Explore Web Hosting solutions that can power your personal website or empower your online business.
Learn More Storage Capacity Unit
Plan and optimize your storage budget with flexible storage services
Learn More Web Hosting
Explore how our Web Hosting solutions help small and medium sized companies power their websites and online businesses.
Learn More Hybrid Cloud Storage
A cost-effective, efficient and easy-to-manage hybrid cloud storage solution.
Learn MoreMore Posts by XianYu Tech
5555590181998165 July 24, 2023 at 7:02 am
Hi, Thank you for your postI would like to know which tool you use to track the leak point in this post