By Jiao Xian
Prometheus is an all-in-one monitoring and alerting platform developed by SoundCloud, with low dependency and full functionality.
It joined CNCF (Cloud Native Computing Foundation) in 2016 and is widely used in the monitoring system of the Kubernetes cluster. In August 2018, it became the second project to "graduate" from CNCF after K8S. Prometheus, as an important member of CNCF ecosphere, is second only to Kubernetes in the level of activity.
In terms of scenarios, PTSDB is suitable for numerical time series data compared with InfluxDB. However, it is not suitable for log-type time series data, and index statistics for billing. InfluxDB is intended for the universal time series platform, and scenarios including log monitoring. Prometheus focuses more on the metrics solutions. A lot of similarities exist between the two systems, including collection, storage, alert, and display.
Format: {=, …}
The metric name has business implications. For example: http_request_total.
jobs and instances
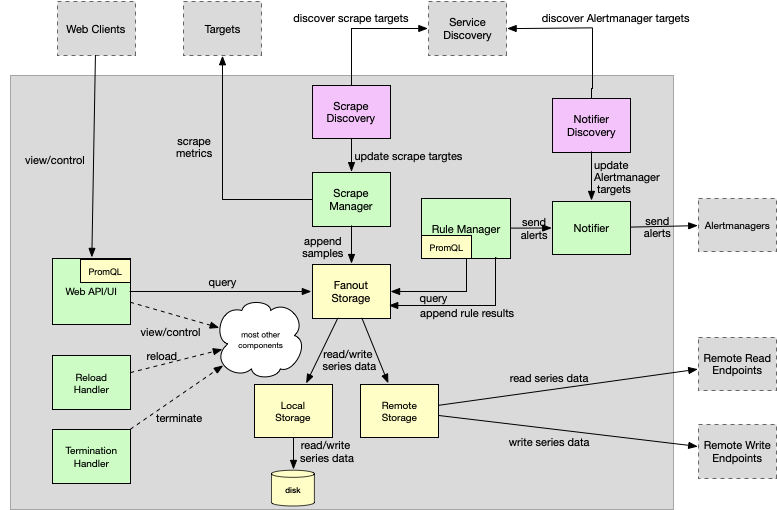
The overall technical architecture of Prometheus can be divided into several important modules:
Storage:
This article focuses on the analysis of Local Storage PTSDB. The core of PTSDB includes: inverted index + window storage block.
Data is written in two hours as a time window. The data generated within two hours is stored in a Head Block. Each block contains all the sample data (chunks), metadata file (meta. json), and index files (index) in the time window.
The newly written data is stored in the memory block and written to the disk two hours later. The background thread eventually merges the two hours of data into a larger data block. For a general database, if the memory size is fixed, the write and read performance of the system will be limited by this configured memory size. The memory size of PTSDB is determined by the minimum time period, the collection period, and the number of timelines.
WAL mechanism is implemented to prevent memory data loss. Records in a separate tombstone file are deleted.
The core data structure of PTSDB is the HeadAppender. When the Appender commits, the WAL log encoding is flushed to the disk and written to the head block.
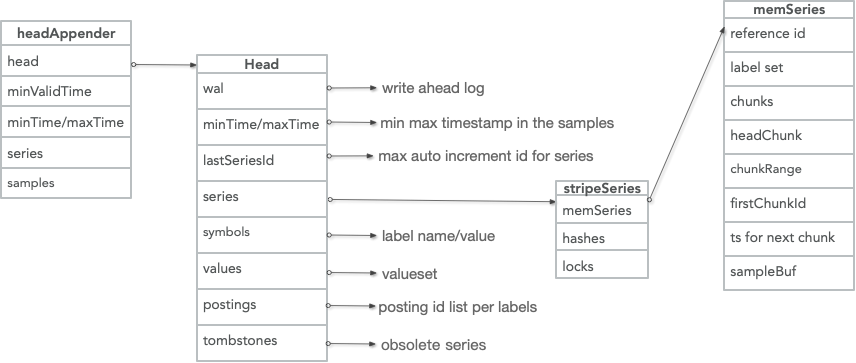
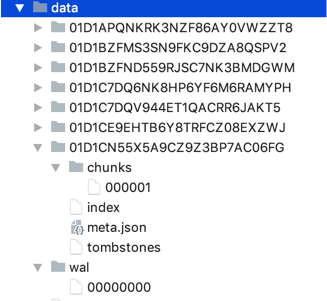
PTSDB local storage uses a custom file structure. It mainly includes: WALs, metadata files, indexes, chunks, and tombstones.
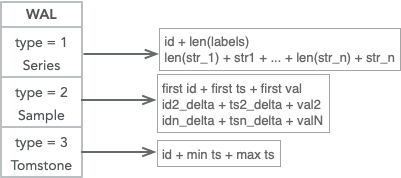
WAL has three encoding formats: timelines, data points, and delete points. The general policy is to scroll based on the file size, and perform cleanup based on the minimum memory time.
When restarting, first open the latest segment, and resume loading data from the log to memory.
The meta. json file records the details of chunks. For example, several small chunks that the new compactin chunk comes from. The statistical information of this chunk. For example, the minimum and maximum time range, the timeline, and the number of data points.
The compaction thread determines whether the block can perform compaction based on the statistical information: (maxTime-minTime) accounts for 50% of the overall compaction time range, and the number of deleted timelines accounts for 5% of the total number.
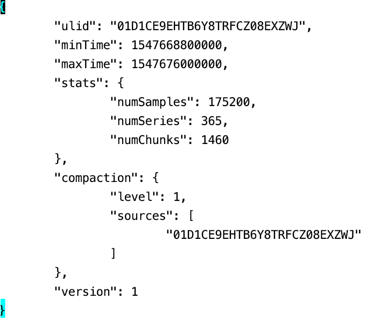
An index is partially written into the Head Block first, and is flushed to the disk with compaction triggered.
The index uses the inverted mode. The IDs in the posting list are locally auto-incremented and represent the timeline as the reference ID. When the index is compacted, the index is flushed to the disk in 6 steps: Symbols -> Series -> LabelIndex -> Posting -> OffsetTable -> TOC
To save space, the timestamp range and the location information of the data block are stored using difference encoding.
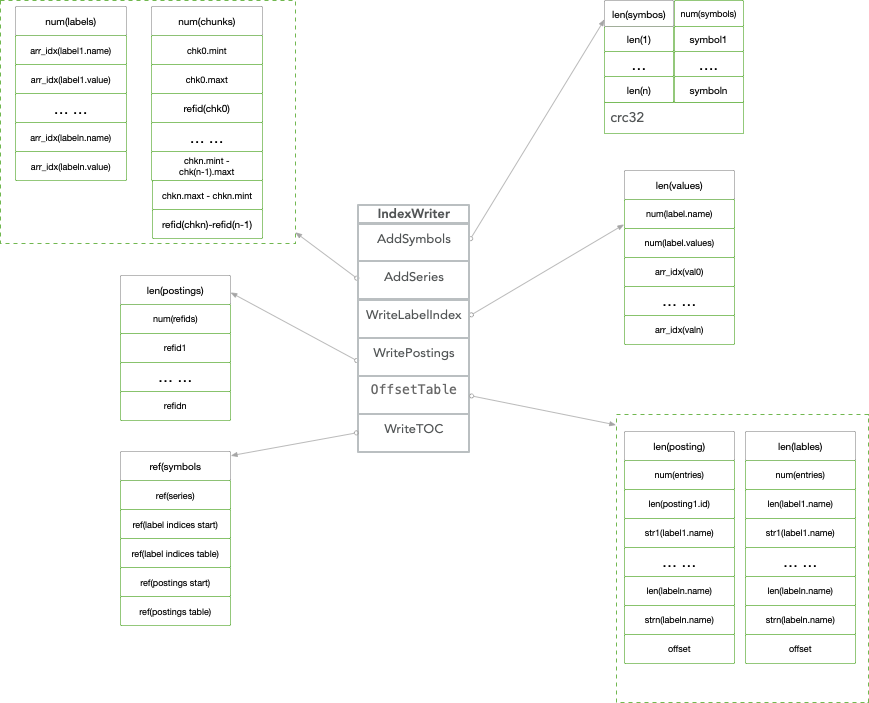
Data points are stored in the Chunks directory. Each data point is 512 MB by default. The data encoding method supports XOR. Chunks are indexed by refid, which consists of segmentid, and offset inside the file.

Records are deleted by marking, and the data is physically cleared when compaction and reloading are performed. The deleted records are stored in units of time windows.

The query language of Promethues is PromQL. The syntax parsing AST, the execution plan and the data aggregation are completed by PromQL. The fanout module sends query data to both the local and remote endpoints simultaneously. PTSDB is responsible for local data retrieval.
PTSDB implements the defined Adpators, including Select, LabelNames, LabelValues, and Querier.
PromQL defines three types of queries:
Instant vector: contains a set of time series, and each time series has only one point. For example: http_requests_total
Range vector: contains a set of time series, and each time series has multiple points. For example: http_requests_total[5m]
Scalar: only has one number and no time series. For example: count(http_requests_total)
Some typical queries include:
http_requests_total
select * from http_requests_total where timestamp between xxxx and xxxxhttp_requests_total{code="200", handler="query"}
select * from http_requests_total where code="200" and handler="query" and timestamp between xxxx and xxxxhttp_requests_total{code~="20"}
select * from http_requests_total where code like "%20%" and timestamp between xxxx and xxxxhttp_requests_total > 100
select * from http_requests_total where value > 100 and timestamp between xxxx and xxxxhttp_requests_total[5m]
select * from http_requests_total where timestamp between xxxx-5m and xxxxcount(http_requests_total)
select count(*) from http_requests_total where timestamp between xxxx and xxxxsum(http_requests_total)
select sum(value) from http_requests_total where timestamp between xxxx and xxxxtopk(3, http_requests_total)
select * from http_requests_total where timestamp between xxxx and xxxx order by value desc limit 3irate(http_requests_total[5m])
select code, handler, instance, job, method, sum(value)/300 AS value from http_requests_total where timestamp between xxxx and xxxx group by code, handler, instance, job, method;PTSDB uses the minimum time window to solve the disorder, and specifies a valid minimum timestamp. Data smaller than this timestamp will be discarded and not processed.
The valid minimum timestamp depends on the earliest timestamp in the current head block and the chunk range that can be stored.
This limitation on data behavior greatly simplifies the design flexibility, and provides the foundation for efficient compaction and data integrity.
MMAP is used to read compressed and merged large files (without occupying too many handles).
The mapping between the virtual address of the process and the file offset is established. The data is truly read to the physical memory after the query reads the corresponding location.
The file system page cache is bypassed, so that a data copy is reduced.
After the query is complete, the corresponding memory is automatically reclaimed by the Linux system based on the memory pressure, and can be used for the next query hit before reclamation.
Therefore, using mmap to automatically manage the memory cache required for queries has the advantage of simple management and efficient processing.
The main operations of the compaction include merging blocks, deleting expired data, and refactoring chunk data.
It is better to compute the maximum duration of the block by percentage (for example, 10%) based on the data retention period. When the minimum and maximum duration of the block exceeds the time range of 2 or 3 block respectively, compaction is executed.
PTSDB provides the snapshot data backup function. You can use the admin/snapshot protocol to generate snapshots. The snapshot data is stored in the data/snapshots/- directory.
needed_disk_space = retention_time_seconds * ingested_samples_per_second * bytes_per_sampleDuring usage, PTSDB has also encountered some problems in some aspects. For example:
PTSDB, as the implementation standard for storing time series data in the K8S monitoring solution, has gradually increased its influence and popularity in time series. Alibaba TSDB currently supports the implementation of remote storage through the Adapter.

2,593 posts | 793 followers
FollowAlibaba Cloud Native - January 26, 2025
digoal - May 28, 2021
Alibaba Cloud Native Community - February 8, 2024
Alibaba Cloud Native Community - February 2, 2026
Alibaba Clouder - April 22, 2019
Alibaba Developer - April 7, 2020

2,593 posts | 793 followers
Follow Big Data Consulting for Data Technology Solution
Alibaba Cloud provides big data consulting services to help enterprises leverage advanced data technology.
Learn More Big Data Consulting Services for Retail Solution
Alibaba Cloud experts provide retailers with a lightweight and customized big data consulting service to help you assess your big data maturity and plan your big data journey.
Learn More Data Transmission Service
Supports data migration and data synchronization between data engines, such as relational database, NoSQL and OLAP
Learn More ApsaraDB for HBase
ApsaraDB for HBase is a NoSQL database engine that is highly optimized and 100% compatible with the community edition of HBase.
Learn MoreMore Posts by Alibaba Clouder