By Yijun
Currently, two popular trends in cloud computing are containerization and microservices. In a microservices architecture, enterprises may need to solve a problem in their actual development scenarios. This issue is in particular the conflict between achieving stable service-side APIs while also being flexible with diverse user requirements.
To take this issue head on, first consider a more specific development scenario. Because Android, iOS, PCs, and mobile web pages require different fields for the same interface type, the field addition and reduction between the front-end development and the service-side development often incurs a large communication overhead as a result.
To solve this problem, some companies have added the Building-a-Backend-for-Frontend (BFF) layer between the traditional frontend and backend to support development and maintenance by people who need to use this data. Moreover, given that most front-end developers are familiar with Node.js, Node.js is a more ideal language for implementing the BFF layer.
However, this solution also brings some new challenges. To be specific, compared with the traditional and relatively mature Java language, the Node.js runtime is relatively new to most developers. Moreover, no tools in the ecological chain are available to guarantee the stability of the BFF layer. Therefore, you need to consider several issues. For example, you need to consider how to locate and process problems if memory leaks cause some processes to experience intermittent OOM.
This article particularly explores this issue by analyzing some memory leak issues that can be found in the Node.js development.
To analyze and locate memory leak problems, first we need to obtain the objects and the reference relationship between them in the heap when a Node.js process experiences a memory leak. A heap snapshot is the file where the objects in the heap and the reference relationship are saved. The V8 engine provides an interface that allows you to easily obtain heap snapshots in real time.
The following are different methods for obtaining heap snapshots.
Run the following command to install the heapdump module:
npm install heapdumpThe following is required in the code of the module:
const heapdump = require('heapdump');The heapdump module provides two methods to obtain the current heap snapshots of processes:
1. Use custom logic in the code.
By doing this, snapshots will be regularly obtained by the timer or the switch is started through a persistent connection. The following is an example of this:
'use strict';
const heapdump = require('heapdump');
const path = require('path');
setInterval(function() {
    let filename = Date.now() + '.heapsnapshot';
    heapdump.writeSnapshot(path.join(__dirname, filename));
}, 30 * 1000);
In the preceding example, a heap snapshot is written to the current directory every 30s.
2. Use the usr2 signal to trigger heap snapshots after starting a Node.js process that uses the heapdump module.
Consider the following example:
kill -USR2 <the PID of the process for which you want to obtain a heap snapshot>By doing this, you can connect to the server through ssh and obtain heap snapshots by using the signal only when they are required. You do not have to embed relevant logic in the code.
Run the following command to install the v8-profiler module:
npm install v8-profilerv8-profiler returns heap snapshots as a transform stream, which allows large heap snapshots to be processed in a better manner:
'use strict';
const v8Profiler = require('v8-profiler-node8');
const snapshot = v8Profiler.takeSnapshot();
// Obtain transform stream of heap snapshots
const transform = snapshot.export();
// Process heap snapshot stream
transform.on('data', data => console.log(data));
// Delete data after data is processed
transform.on('finish', snapshot.delete.bind(snapshot));
In Node.js versions earlier than version 6.0, v8-profiler can be directly downloaded to the corresponding binary on different operating systems by using node-pre-gyp, without having to perform local compilation. v8-profiler is relatively friendly to non-Mac development environments.
The above methods require you to install the npm module and embed corresponding hot operation logic into the code. In Node.js Performance Platform, the task of obtaining heap snapshots has been integrated into the runtime. After an application is connected to the platform, heap snapshots of processes can be obtained online for analysis, without having to modify business code:
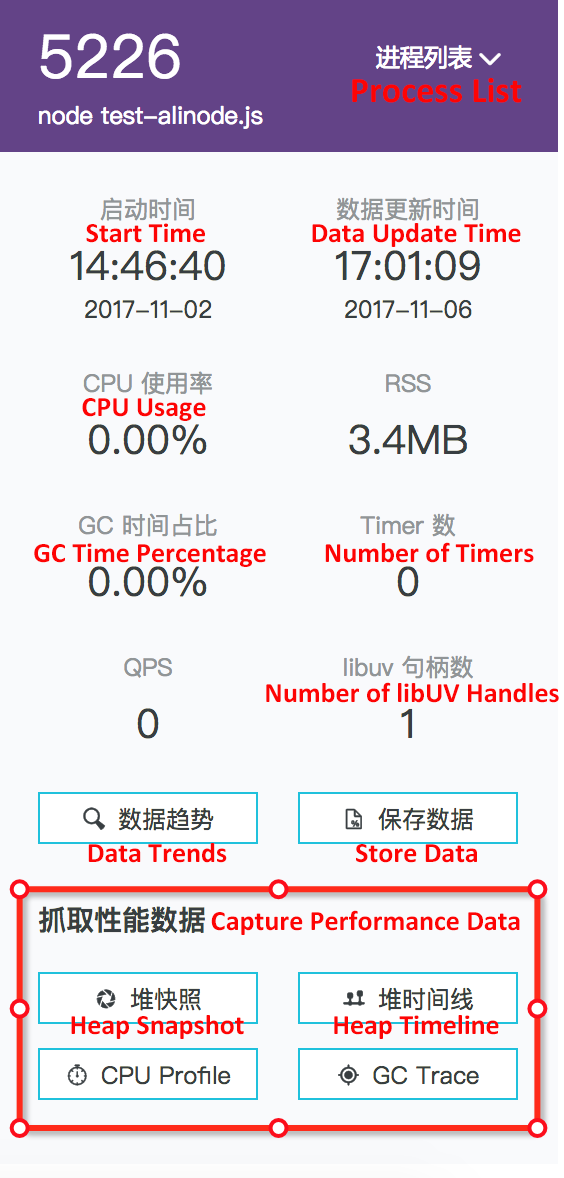
As shown in the screenshot, after selecting the target process, click Heap Snapshot to generate a heap snapshot. Click File in the left-side navigation bar to view the generated heap snapshot:

At this point, click Dump to store the heap snapshot on the cloud. After this, you can download the heap snapshot for analysis anytime.
After opening the heap snapshot obtained in the previous section in any document reader, you can see that the snapshot is a large JSON file:
{
    snapshot: {},
    nodes: [],
    edges: [],
    strings: []
}
We can easily speculate what are stored in the nodes and edges arrays. The nodes array stores information about each node in the memory, and the edges array stores relations between nodes in the memory.
The snapshot stores descriptive information about each node and edge. After expanding the snapshot node, we can see that it only includes one meta node. Next, after further expanding the meta node, we can see the description of each node and edge:
The last array is strings. This array is relatively simple and stores the names of nodes and edges.
The following is the overall relation graph.
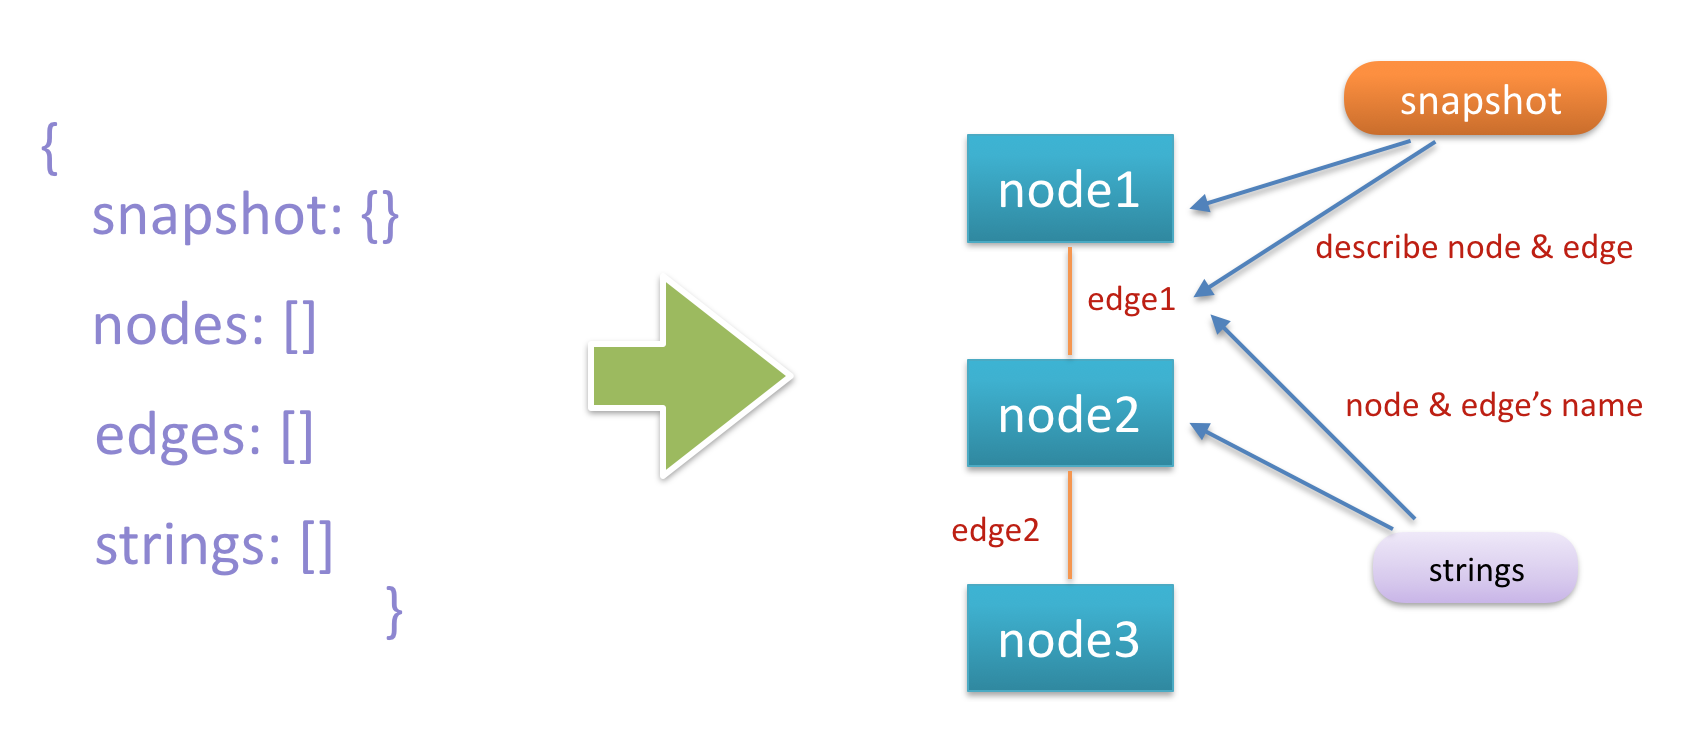
The preceding information describes each node and each edge in the memory relation graph. However, the relationship between nodes and edges is not shown in the graph.
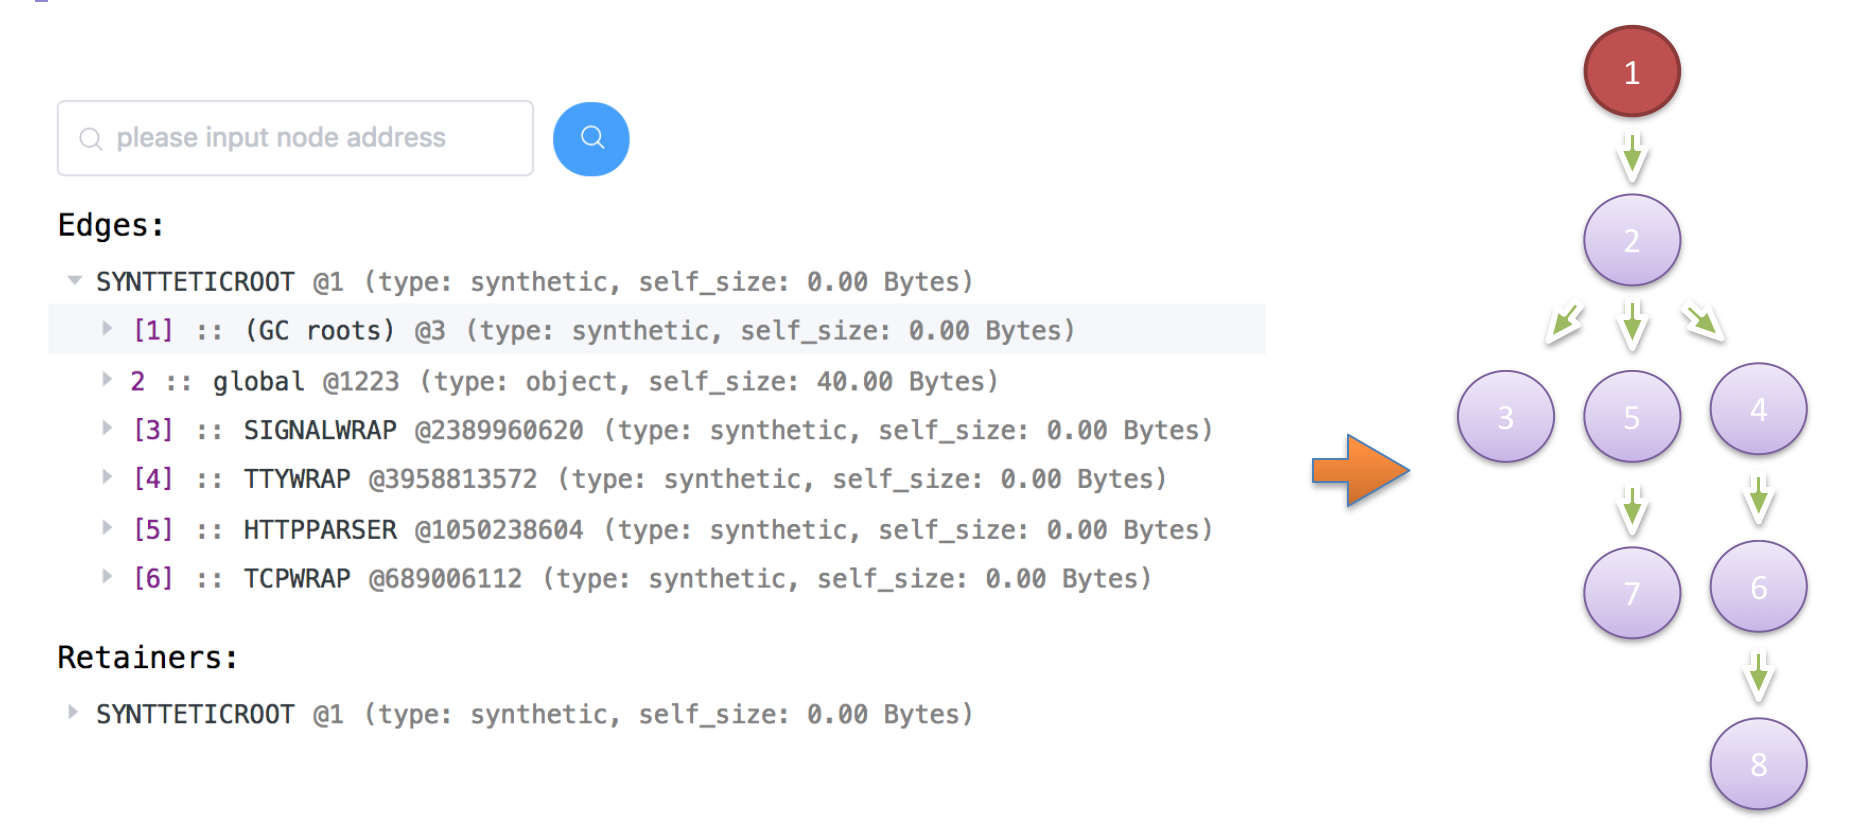
We can see that the preceding meta.node_fields that describes nodes includes one item called edge_count. It describes the number of edges under this node. Edges in the edges array are sequentially ordered. Therefore, we can draw a relation graph like this:
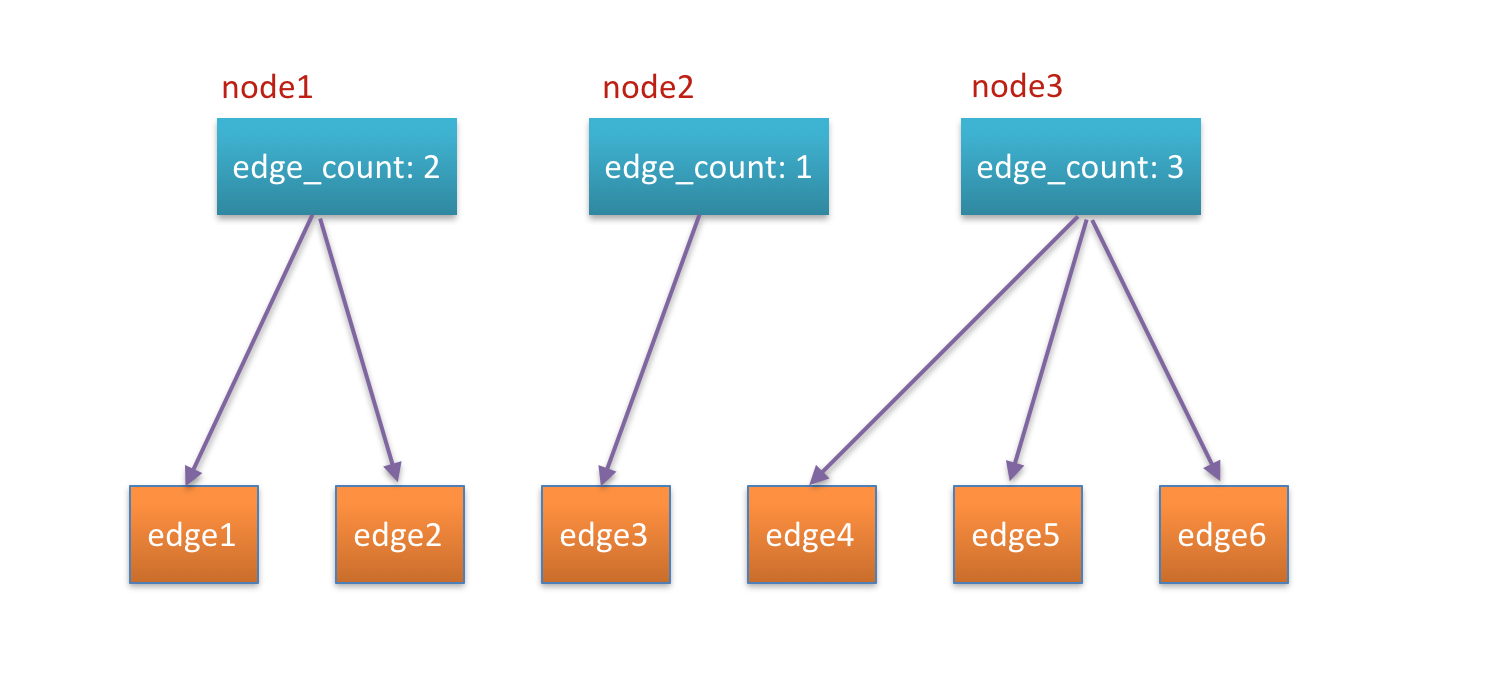
In addition, the to_node in the meta.edge_fields that describes edges refers to the node to which this edge points. By combining all the information together, we can draw a real memory relation graph.
Based on the information described in the previous section, we can obtain a memory relation graph like this:
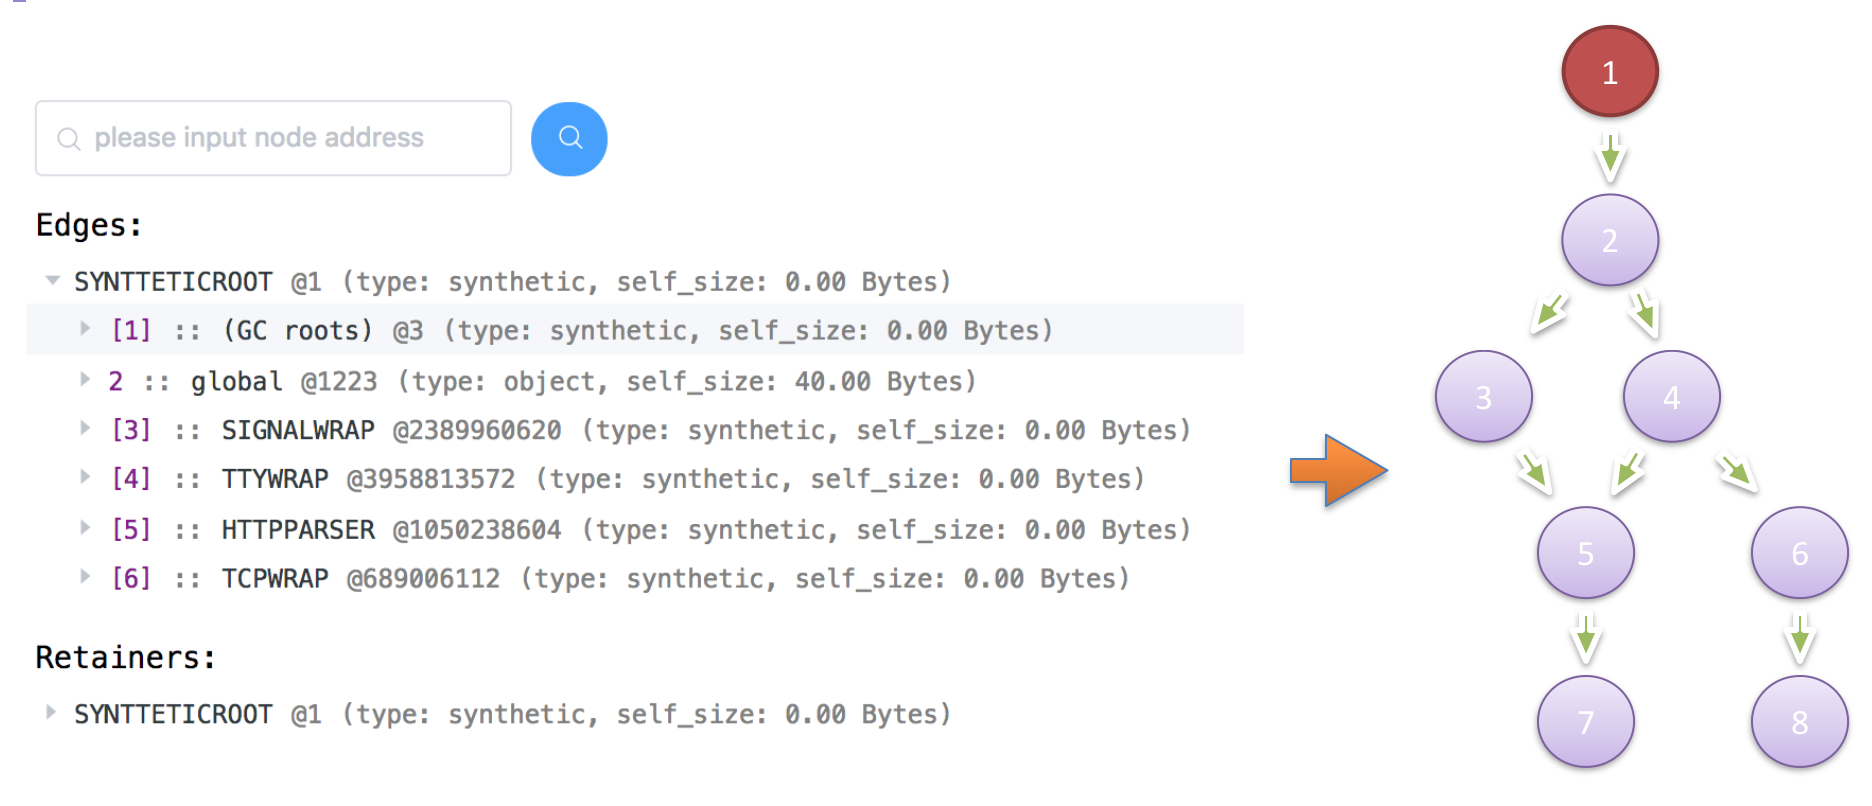
Assume that node 5 is where a memory leak happens. Node 5 consumes significant memory and does not release it as expected. If we release parent node 3 of node 5, node 5 can still be reached by following the path 1 -> 2 -> 4 -> 5 from the root node. That is, releasing node 3 alone cannot terminate the reference to node 5. Similarly, releasing node 4 does not work, either.
In this example, we can only release node 5 by stopping the reference to node 2. In other words, node 2 is the node that directly controls node 5, because every path from node 1 to node 5 goes through node 2. This structure is called a dominator tree. It is helpful for analyzing memory leaks.
We can convert the preceding memory relation graph to a dominator tree like this:
Now we can calculate the retained size from node 8 up to the root node. The retained size for a node equals the size of that node itself plus the retained size of its child node. Finally, we can see which nodes have memory consumption accumulated. These nodes that have memory consumption accumulated instead of being deallocated are likely candidates for memory leaks.
After we know where memory leaks happen, we can find the corresponding code logic snippet in the memory relation graph to see if these nodes really fail to deallocate memory unexpectedly.
Alibaba Clouder - November 26, 2019
hyj1991 - June 20, 2019
hyj1991 - July 22, 2019
hyj1991 - June 20, 2019
Alibaba Clouder - November 25, 2019
hyj1991 - June 20, 2019
 Microservices Engine (MSE)
MSE provides a fully managed registration and configuration center, and gateway and microservices governance capabilities.
Learn More Web Hosting Solution
Explore Web Hosting solutions that can power your personal website or empower your online business.
Learn More YiDA Low-code Development Platform
A low-code development platform to make work easier
Learn More mPaaS
mPaaS
Help enterprises build high-quality, stable mobile apps
Learn MoreMore Posts by hyj1991