By Yijun
Before we want to launch a new Node.js application, especially the first Node.js application for technology stack switching, we definitely want to conduct a performance stress test due to concerns about its online throughput performance. This estimates the amount of traffic it can withstand at the current cluster scale. In fact, this case is exactly in such a scenario that we want to launch a Node.js technology stack to separate the front-end from the back-end. So, regardless of the response QPS of the back-end service, the performance of template rendered using Node.js only is a matter of great concern to everyone.
This manual is first published on GitHub at https://github.com/aliyun-node/Node.js-Troubleshooting-Guide and will be simultaneously updated to the community.
The overall capacity of the cluster reflected by the cluster performance stress test can be measured by the standalone throughput. Therefore, this performance stress test uses a server with 4 cores and 8 GB memory server for stress testing, and the page uses the popular EJS for server rendering, while the number of processes to be started depends on the number of cores, that is, 4 sub-processes are started to run using PM2.
After these preparations are completed, the PTS, a performance stress testing tool provided by Alibaba Cloud, is used for stress testing. At this time, the QPS rendered by the standalone EJS template is about 200. Through the monitoring of the Node.js Performance Platform, we can see that the CPU of the 4 sub-processes is basically 100%, that is, the CPU load has reached the bottleneck. However, the QPS is only about 200. Obviously, the overall rendering of the system is not ideal.
Note: At the time of writing, both PTS and Node.js Performance Platform products are only available for domestic (Mainland China) accounts.
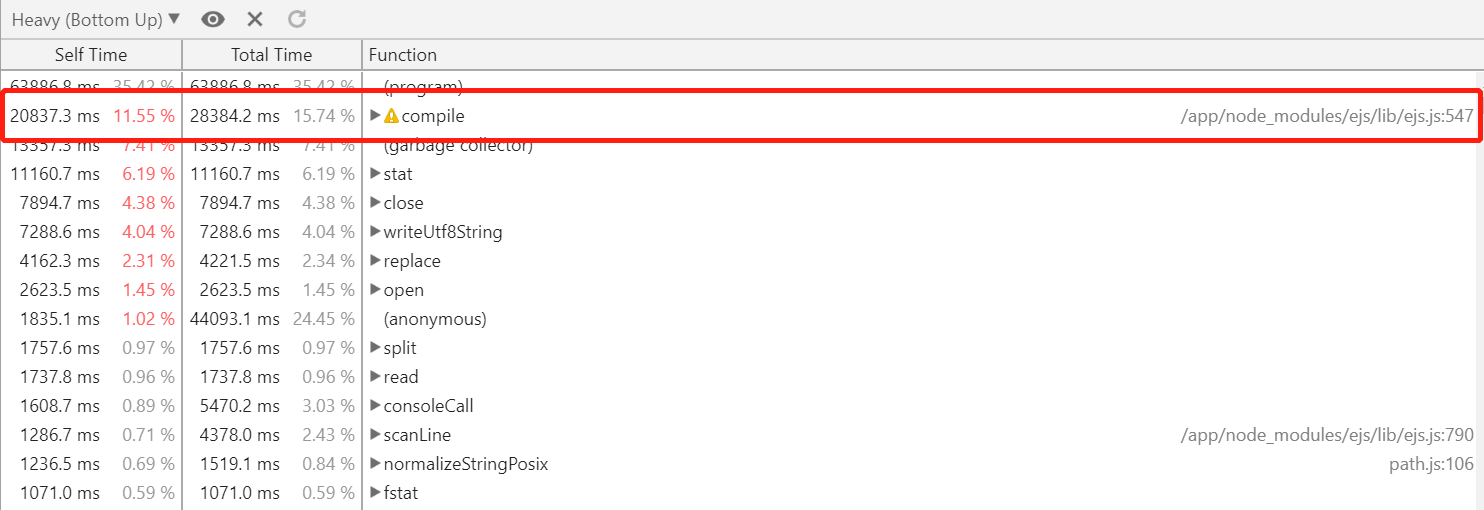
The CPU load reaches the bottleneck of the system, so the overall QPS cannot increase. Therefore, according to the method described in the Tool chapters of the second section, we captured a 3-minute CPU profile during the stress test on the platform, and the results are shown in the following figure:

Here, we can see something strange. We have enabled the template cache in the stress testing environment, so the template compilation corresponding to the ejs.compile function should not appear again. When carefully examining the rendering logic code in the project, we found that a relatively uncommon template koa-view was used in this part. The project developer assumes that the input method of the EJS template can be used to pass in the "cache: true". But in fact, the template does not provide better support for the EJS template, so the template cache does not take effect in the actual stress test. And the compilation of the template is essentially string processing, which is a CPU intensive operation, thus causing the QPS to fail to meet expectations.
After learning the reason, we first replaced the koa-view with a better template koa-ejs, and opened the cache correctly according to the koa-ejs documentation:
render(app, {
  root: path.join(__dirname, 'view'),
  viewExt: 'html',
  cache: true
});
After another stress test, the standalone QPS is increased to about 600. Although the performance is improved by about three times, it still fails to reach the expected goal.
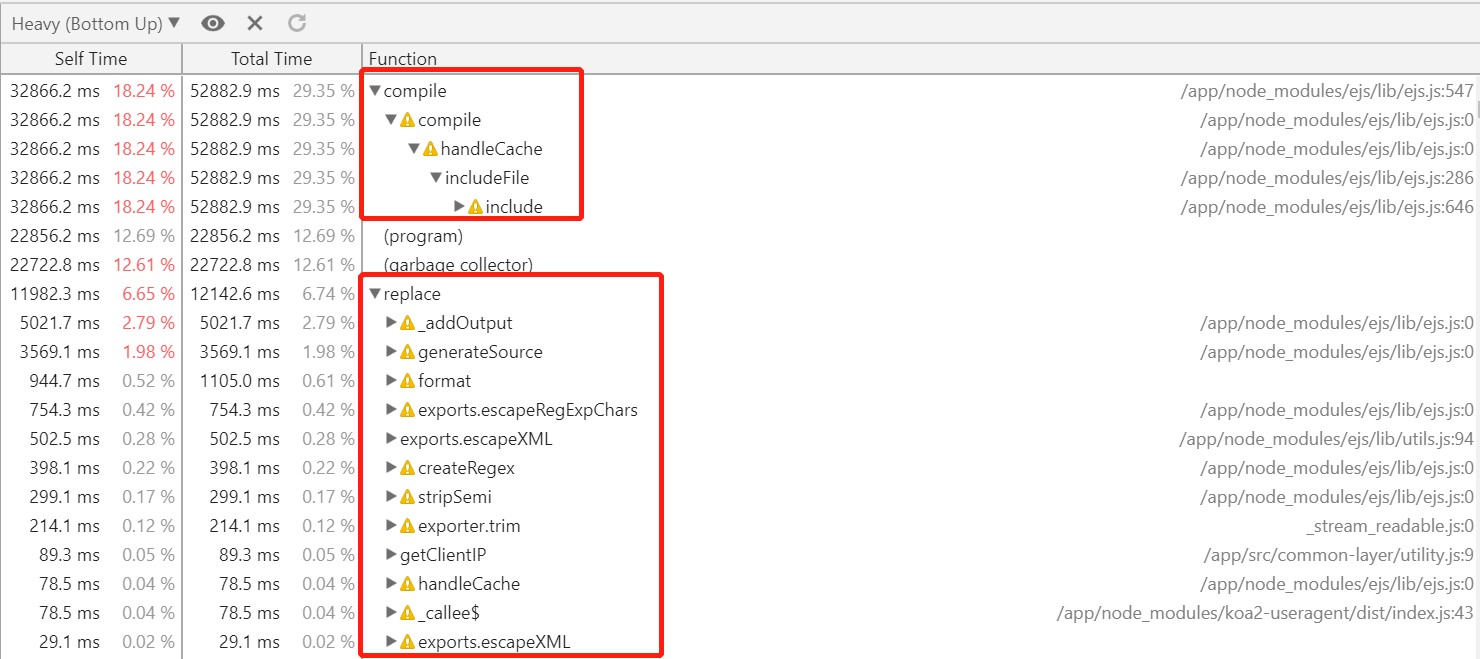
To continue optimizing to further improve the rendering performance of the server, we once again captured a 3-minute CPU profile during the stress test:

As can be seen, although we have confirmed that the koa-ejs template is used, and the cache is enabled correctly, the EJS compile action still exists in the CPU profile during the stress test! After expanding the compile here, we found it was introduced when the includeFile was executed. Then back to the project, we reviewed the page template of the stress test, and found that the "include" method injected by EJS was indeed used to introduce other templates:
<%- include("../xxx") %>After examining the EJS source code, the injected "include" function call chain is indeed include -> includeFile -> handleCache -> compile, which is consistent with the content displayed in the CPU profile obtained by the stress test. Then the "replace" part in the red box is also generated in the compile process.
At this point, we began to suspect that the koa-ejs template did not correctly pass the cache parameters to the EJS template that is really responsible for rendering, leading to this problem. Therefore, we continued to read the cache settings of koa-ejs. The following is the simplified logic (koa-ejs@4.1.1 version):
const cache = Object.create(null);

async function render(view, options) {
  view += settings.viewExt;
  const viewPath = path.join(settings.root, view);
  // If a cache exists, the function obtained by parsing the cached template is directly used for rendering.
  if (settings.cache && cache[viewPath]) {
    return cache[viewPath].call(options.scope, options);
  }
  // If no cache exists, ejs.compile is called to compile for the first rendering.
  const tpl = await fs.readFile(viewPath, 'utf8');

  const fn = ejs.compile(tpl, {
    filename: viewPath,
    _with: settings._with,
    compileDebug: settings.debug && settings.compileDebug,
    debug: settings.debug,
    delimiter: settings.delimiter
  });
  // Cache the parsed function for the template obtained by ejs.compile.
  if (settings.cache) {
    cache[viewPath] = fn;
  }

  return fn.call(options.scope, options);
}
Obviously, the cache of the koa-ejs template is completely self-implemented. The cache parameter set by the user is not passed in the option parameter passed in when the ejs.compile method is called, so the cache capability provided by EJS template is not used. However, the project directly uses the "include" method injected by the EJS template in the template to call between templates. The result is that only the master template is cached, but when the main template uses "include" to call other templates, it re-compiles and parses them, thus resulting in a large number of repeated template compilation operations during the stress test, and QPS can not be increased.
Once again, we found the root cause of the problem. To verify whether it was a bug in the koa-ejs template, we slightly changed the rendering logic in the project:
const fn = ejs.compile(tpl, {
  filename: viewPath,
  _with: settings._with,
  compileDebug: settings.debug && settings.compileDebug,
  debug: settings.debug,
  delimiter: settings.delimiter,
  // Pass the cache parameter set by the user to EJS, to use the cache capability provided by EJS.
  cache: settings.cache
});
Then, the stress test was performed after packaging. At this time, the standalone QPS was increased from 600 to about 4000, which basically reached the pre-launch performance expectation. To confirm whether any template compilation actions exist under the stress test, we continued to capture a 3-minute CPU profile during the stress test on the Node.js Performance Platform:

We can see that, after the koa-ejs template is optimized, ejs.compile has indeed disappeared, and repeated and CPU-consuming compilation operations no longer exist during the stress test, so the overall performance of the application is improved by about 20 times compared with the initial performance. The the cache problem of koa-ejs template covered in this article was fixed in version 4.1.2. For details, see cache includeFile. If you use koa-ejs version 4.1.2 or later, then you can use it with confidence.
Essentially, the CPU profile reflects the frequency that JavaScript code is executed at runtime in a readable way for developers. In addition to being used to locate problem code when online processes are heavily loaded, it can also be very helpful when we perform per-launch stress tests and corresponding performance tuning. It should be noted that only a CPU profile captured when the CPU load of the process is very high can really give us feedback on the problem.
In this real production case, we can also see that the difference between correctly and incorrectly using Node.js to develop applications can have up to a 20x gap in operating efficiency. Node.js, as a server-side technology stack, continues to be developed to this day, and its performance is beyond doubt. In most cases, poor execution efficiency is caused by bugs in our own service code or third-party libraries. Node.js Performance Platform can help us find these bugs in a more convenient way.
Node.js Application Troubleshooting Manual - OOM Caused by Passing Redundant Configurations
Node.js Application Troubleshooting Manual - Outline and General Problem Metrics
hyj1991 - July 22, 2019
Alibaba Clouder - August 13, 2020
hyj1991 - June 20, 2019
hyj1991 - June 20, 2019
hyj1991 - June 20, 2019
hyj1991 - June 20, 2019
 ECS(Elastic Compute Service)
Elastic and secure virtual cloud servers to cater all your cloud hosting needs.
Learn More Container Compute Service (ACS)
A cloud computing service that provides container compute resources that comply with the container specifications of Kubernetes
Learn More Mobile Testing
Provides comprehensive quality assurance for the release of your apps.
Learn More Web App Service
Web App Service allows you to deploy, scale, adjust, and monitor applications in an easy, efficient, secure, and flexible manner.
Learn MoreMore Posts by hyj1991