By Yijun
In the previous article, we used Chrome DevTools to troubleshoot CPU and memory problems in Node.js applications. However, in actual production practices, we may find that Chrome DevTools is more inclined to local development because it obviously does not generate dump files, which are required for problem analysis. This means that developers additionally need to configure tools like v8-profiler and heapdump for online projects and export statuses of projects running online in real time by using additionally implemented services.
In addition to CPU and memory problems described in the previous article, in some scenarios, we may need to analyze error logs, disks, and core dump files to eventually locate problems. In these scenarios, Chrome DevTools alone may not be able to meet the requirements. To solve those pain points for Node.js developers, we recommend Node.js Performance Platform (formerly known as AliNode). Node.js Performance Platform has already been used to monitor and troubleshoot almost all of Alibaba Group's online Node.js applications. You can deploy and use it in your production environment without any worries.
This article describes the architecture, core capabilities, best practices, and other aspects of Node.js Performance Platform to help developers understand how to use this tool to analyze abnormal metrics and troubleshoot online Node.js application faults.
This manual is first published on GitHub at https://github.com/aliyun-node/Node.js-Troubleshooting-Guide and will be simultaneously updated to the community.
Note: At the time of writing, the Node.js Performance Platform product is only available for domestic (Mainland China) accounts.
To put it simply, Node.js Performance Platform consists of three parts: cloud console, AliNode runtime, and Agenthub:
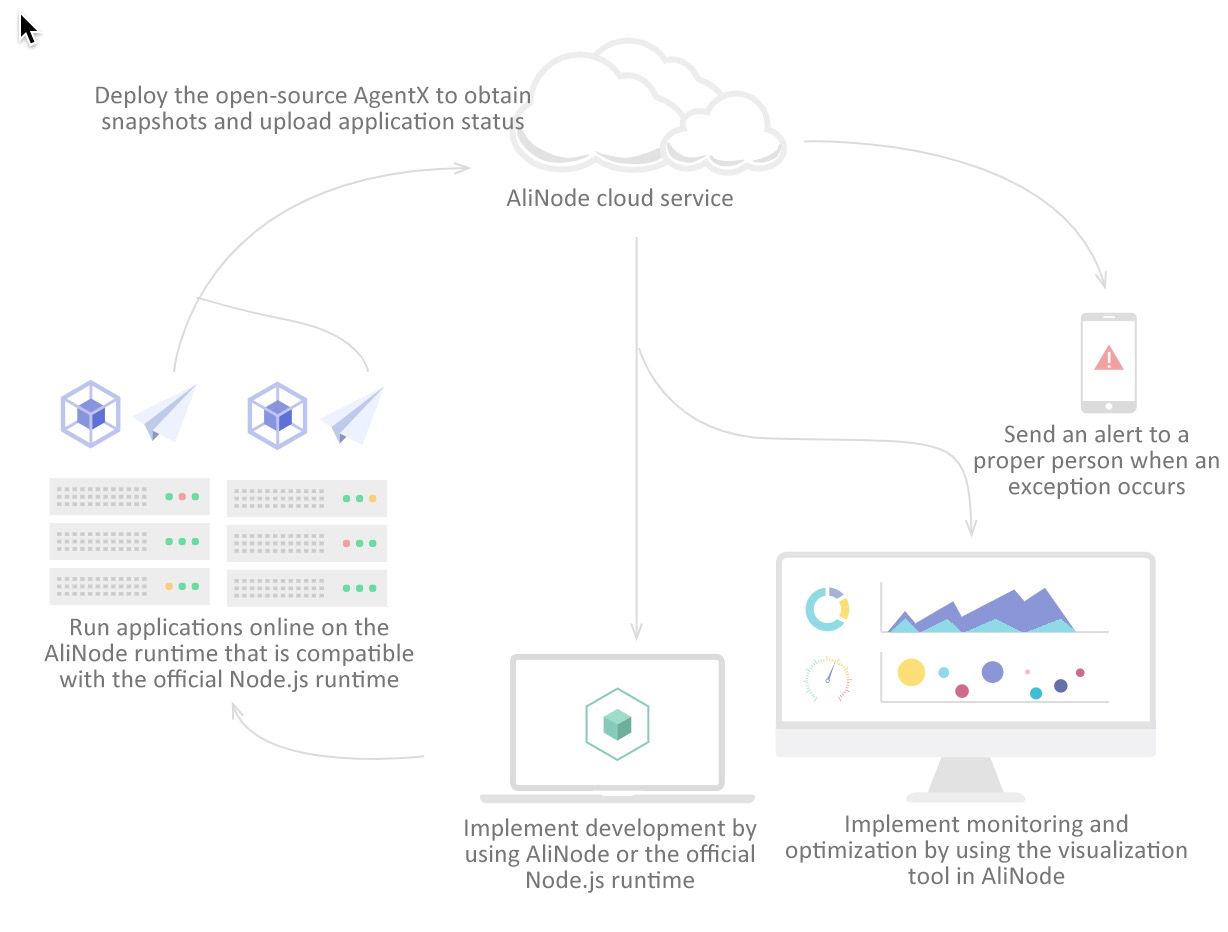
With the whole set of solutions enabled by Node.js Performance Platform, we can easily alert on and analyze the majority of the abnormal metrics mentioned in the preliminary chapter. In practical production scenarios, I think that Node.js Performance Platform provides three core capabilities, which are also the most efficient features:
In other words, although Node.js Performance Platform features are constantly being added, modified and improved, the preceding three core features have top priority. Other features may not be as important as these three core features.
I understand that developers that use this platform want to see all details of online Node.js applications from the bottom layer to the business layer. However, I think that a tool should be differentiated by core features. Constant feature addition may obscure the original product purpose and provide extensive but not specialized features. Node.js Performance Platform has always been committed to intuitively showing developers runtime status that was once hidden in "black box", so that Node.js application developers can solve complicated application problems.
Online application alerting is actually a self-discovery mechanism. Without this alerting capability, problems can only be discovered when they are reported by users who have encountered these problems. This problem discovery procedure does not enable friendly user experience.
Therefore, after a project is deployed, developers first need to configure proper alerts. In our production practices, we can basically solve online problems by analyzing error logs, Node.js process CPU and memory usage, core dump files, and disks. So, we can configure alerting policies in these five sections. Fortunately, these alerts have been preset in the platform. You only need to select some options to complete the alert configuration, as shown in the following screenshot.
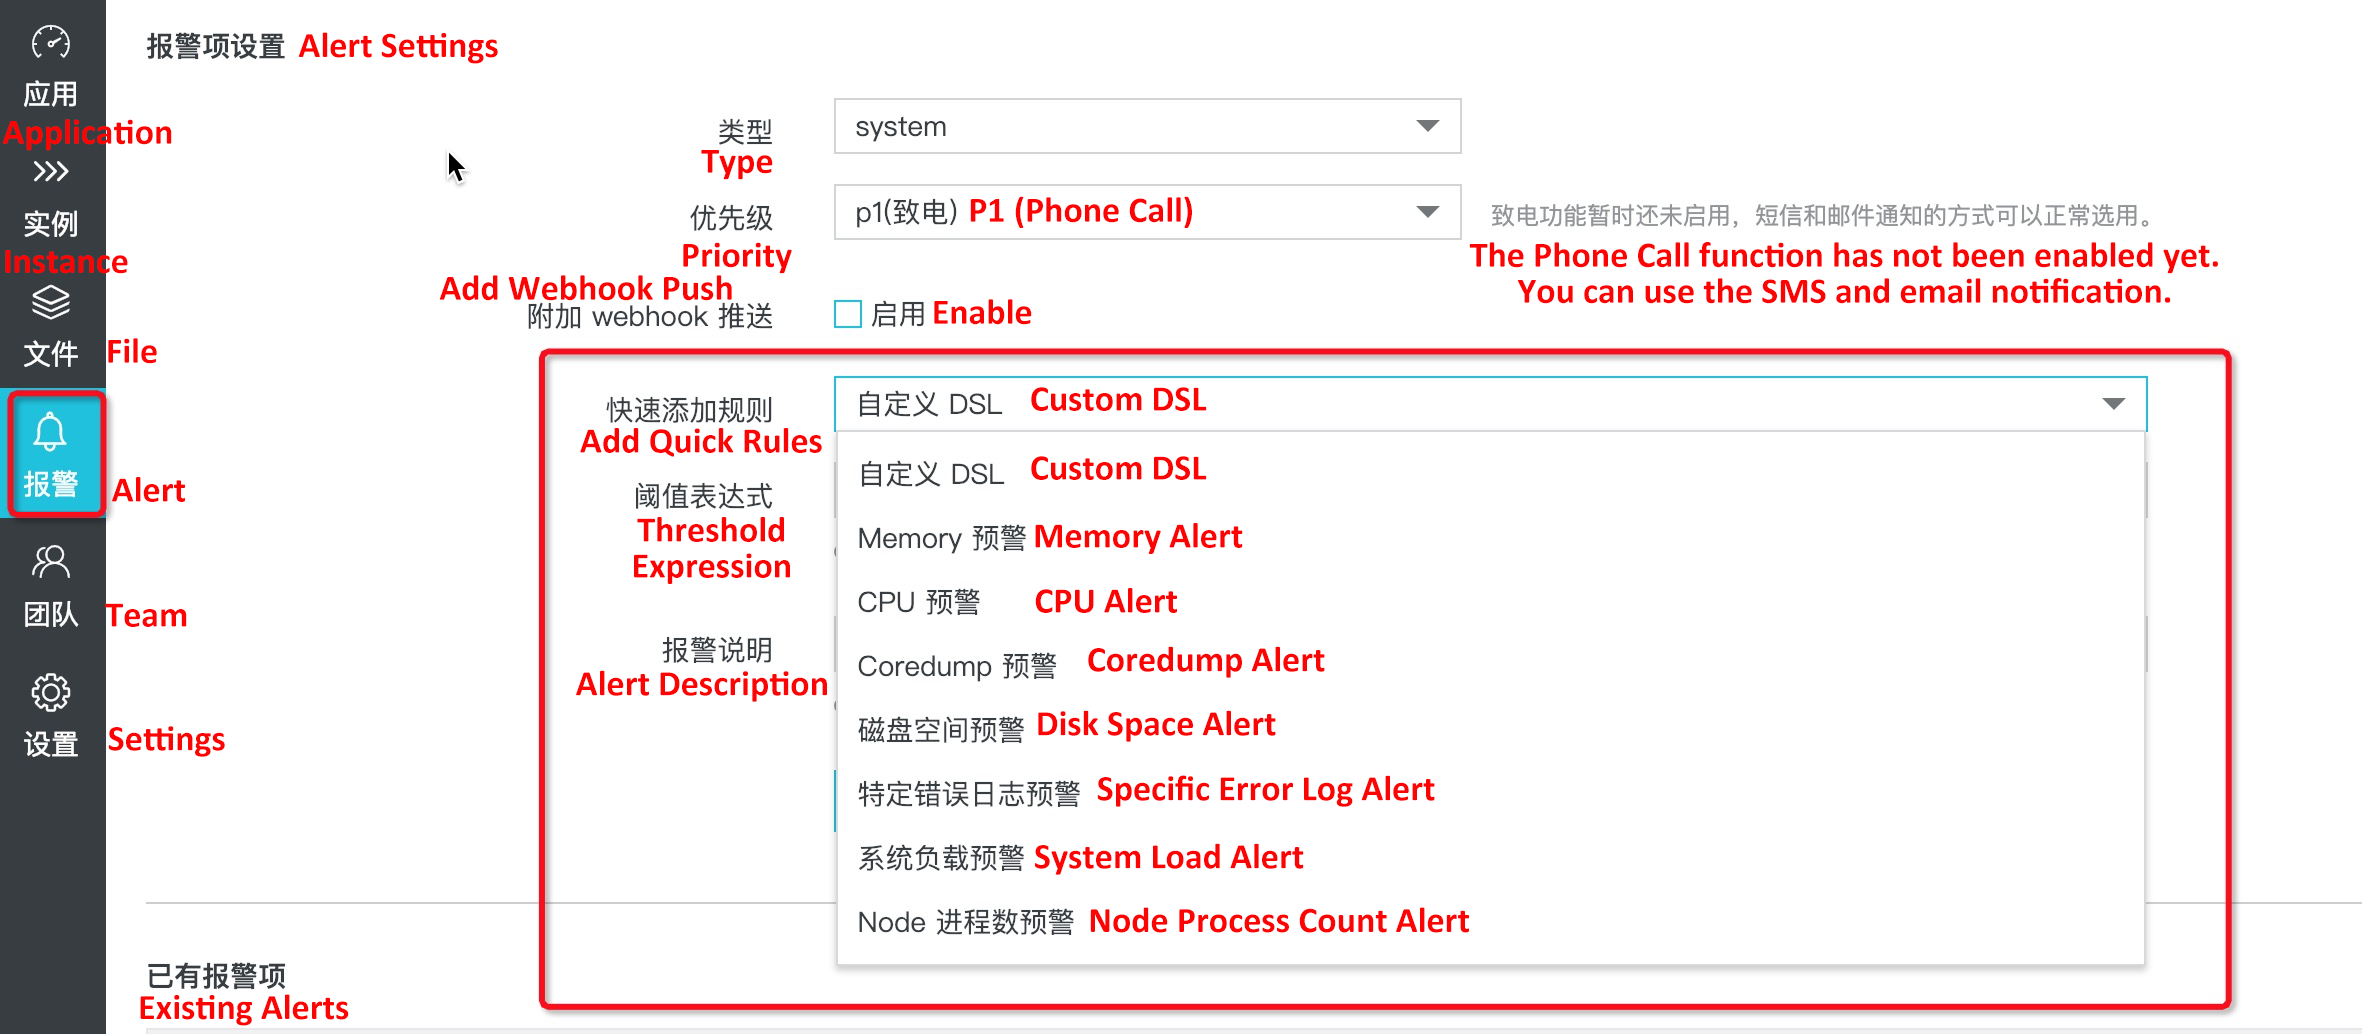
By clicking Add Quick Rules in Node.js Performance Platform, threshold expression templates and alert description templates will be automatically generated. You can make some modifications based on your project monitoring requirements. For example, to monitor the heap memory of a Node.js process, you can select the Memory Alert option:
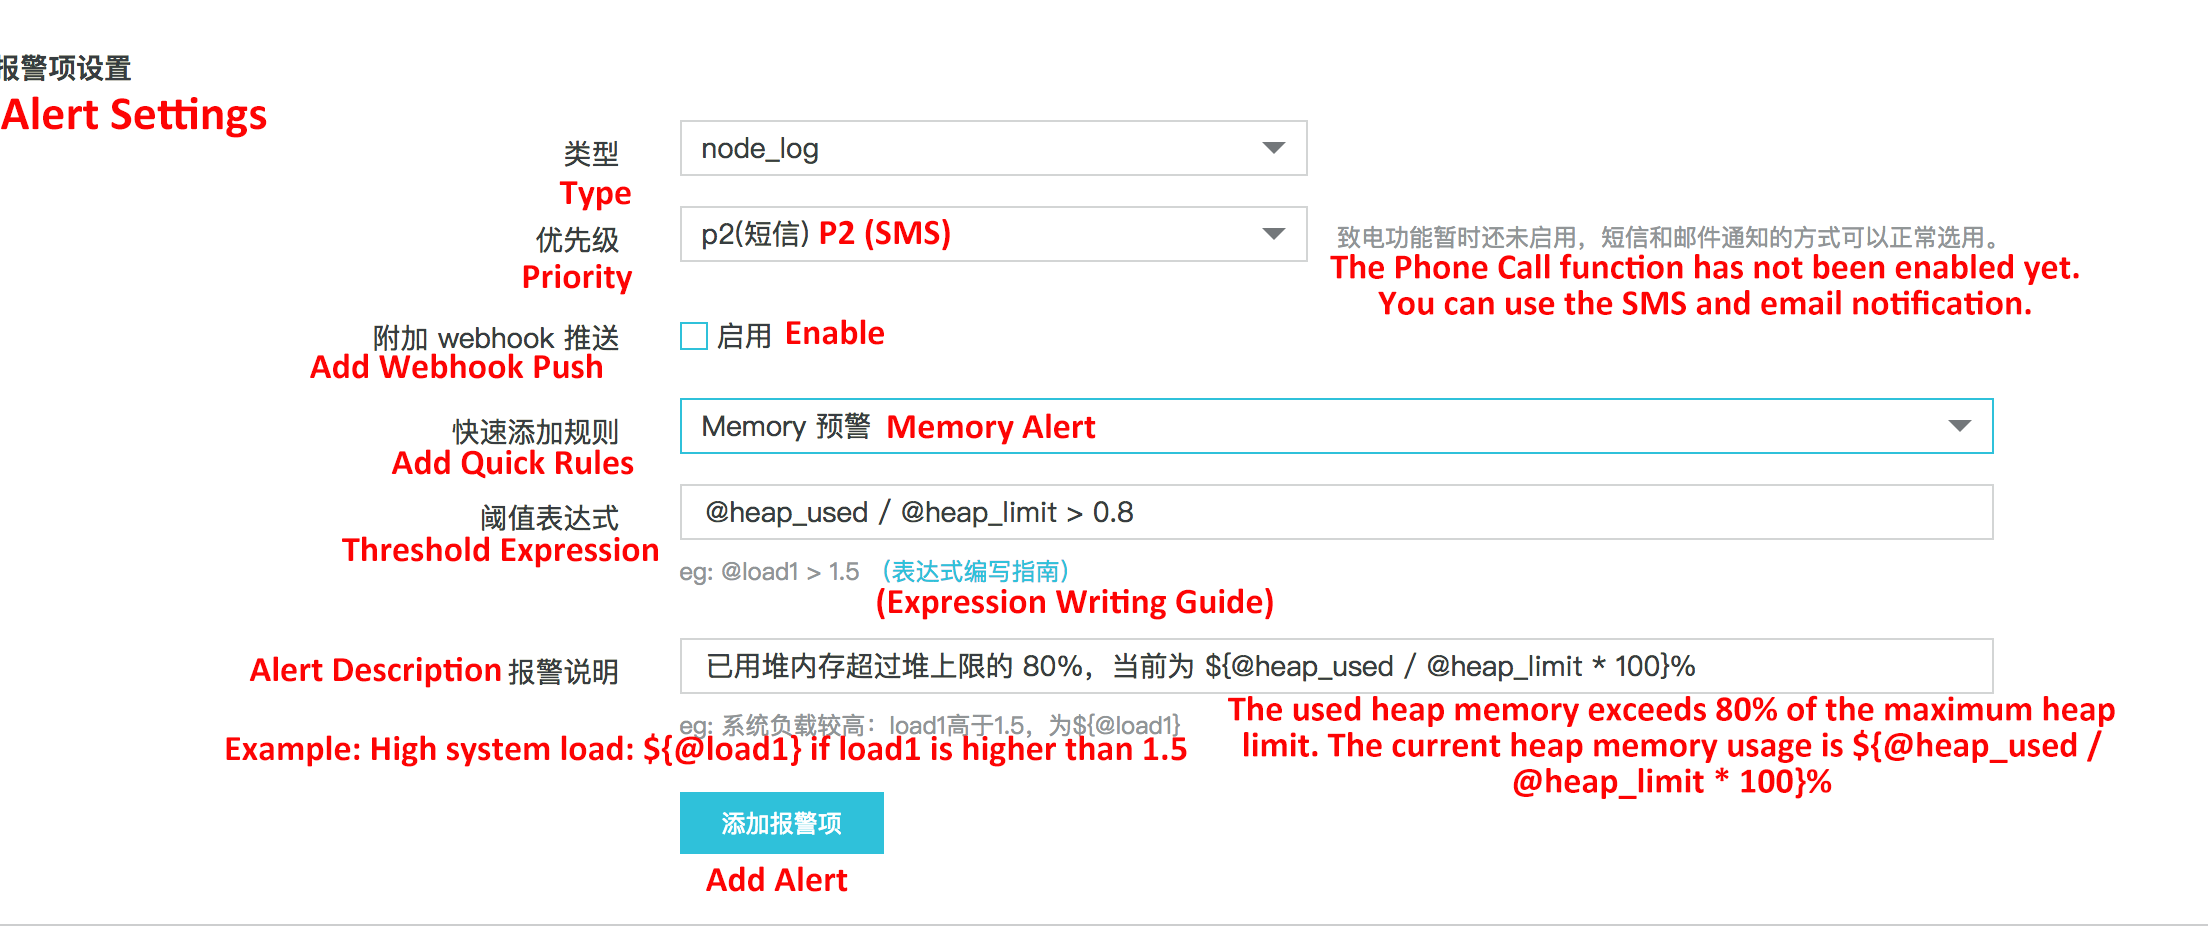
Click Add Alert to complete the heap memory alert configuration. At this point, click Notification Settings -> Add to Contacts List to add a contact for this rule:

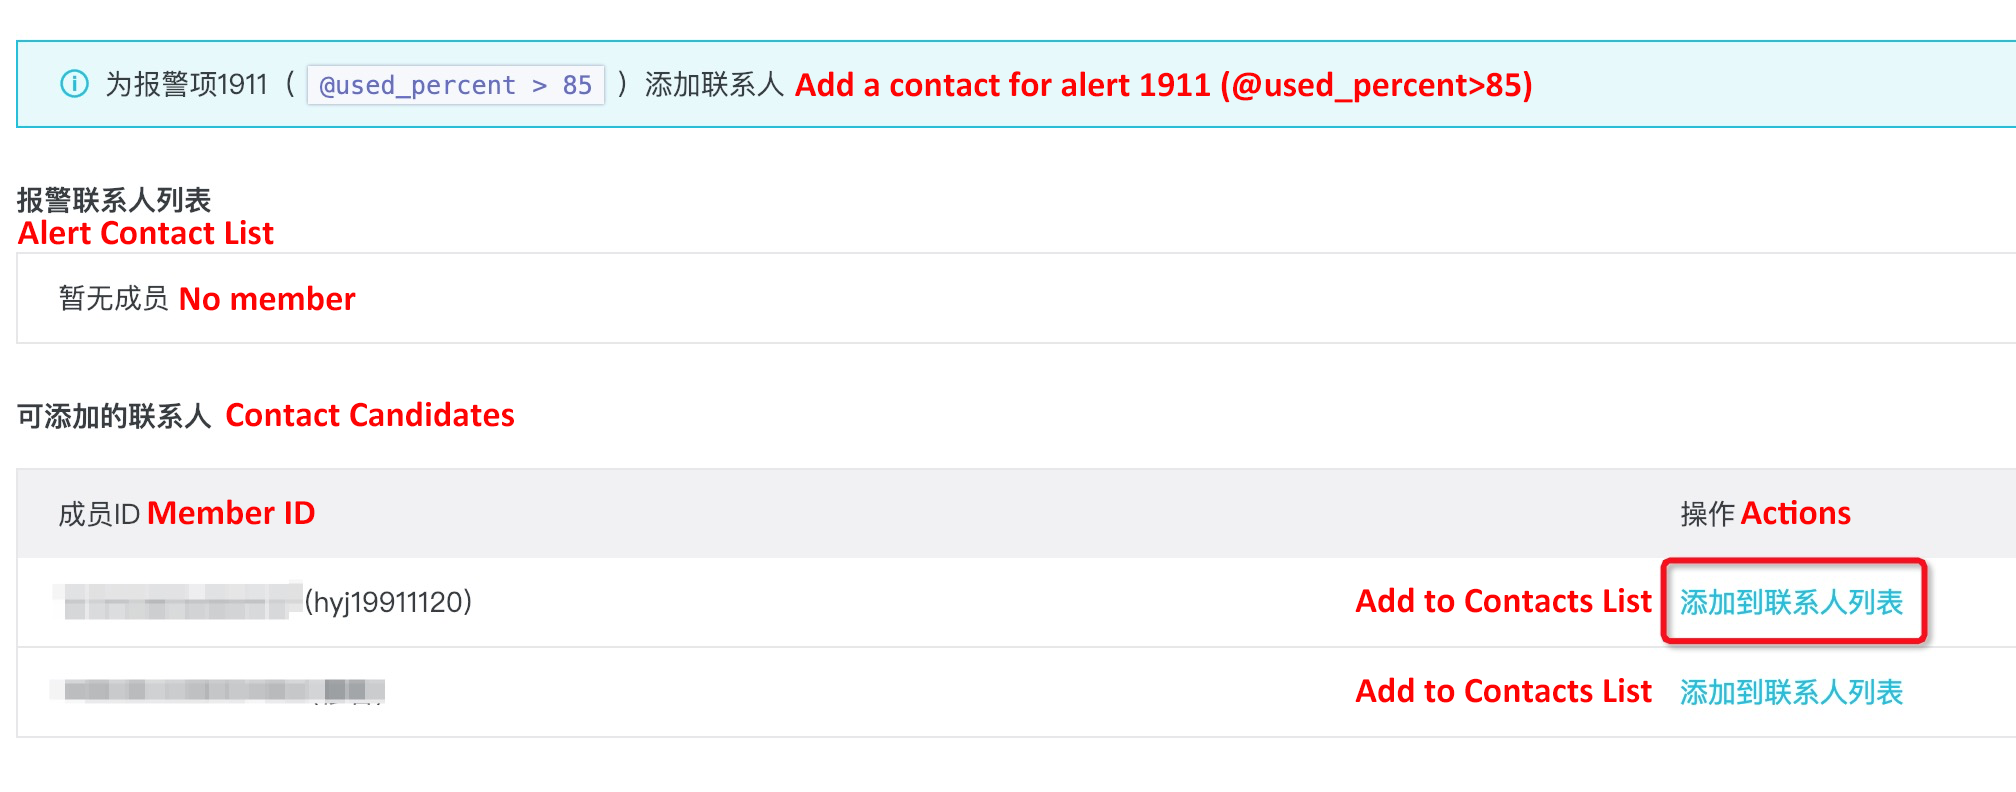
The default rule in this example will send an SMS message to the contact bound to this alert rule when the heap memory allocated to the Node.js process exceeds 80% of the maximum heap memory. (The default maximum heap memory on a 64-bit machine is 1.4 GB.)
The quick rule list provides some common pre-configured alert policies. If these pre-configured policies cannot meet your needs, you can see the Alert Settings document to see how to customize service alert policies. In addition to SMS message notifications, you can also use DingTalk Chatbot to push alert notifications to DingTalk groups so that a group of people can be notified of Node.js application status.
After you follow instructions in the previous section to configure proper alert rules, you can perform analysis accordingly when you receive SMS alert messages. This section describes how to perform analysis based on the five main metrics described in the preliminary section.
This is a relatively easy question. In the quick rule list, the default disk monitoring rule is to issue an alert if the server disk usage exceeds 85%. When you receive a disk alert, you can connect to the server and use the following command to see which directory has high disk usage:
sudo du -h --max-depth=1 /After locating the directory and files that consume significant disk space, see if it is necessary to back up these files and then delete them to free up disk space.
After receiving a specific error log alert, you only need to go to the Node.js Performance Platform console for the corresponding project, find the problematic Instance and view its Exception Log:

Information on this page is organized by error type. You can locate and identify problems by using error stack information. Note that you need to write error log files into the profile when deploying Agenthub. For more information, see Configuration details in the Configure and start Agenthub document.
Now let's see the error type for which we use v8-profiler to export the CPU Profile file and then use Chrome DevTools to perform analysis in the previous section. With a complete set of solutions provided in Node.js Performance Platform, you no longer need to use third-party libraries like v8-profiler to export process status data. Instead, when you receive an alert that says that a Node.js application process is taking CPU usage higher than the configured threshold, you only need to click CPU Profile of the corresponding Instance in the console:
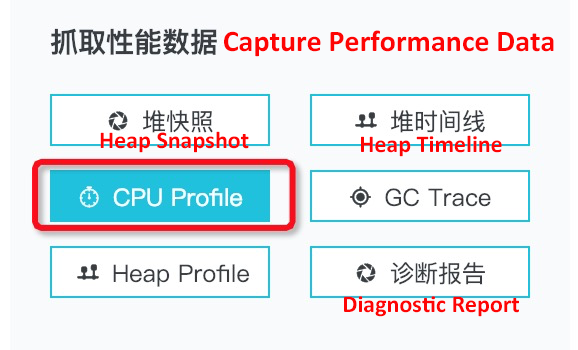
By default, the system generates a CPU Profile file that contains information about the captured process in the last three minutes. This generated file is displayed on the File page:

Click Dump to upload the file to the cloud for online analysis and demonstration:

On this page, you can see two Analyze buttons. The second one with (DevTools) under it performs analysis with Chrome DevTools described before. Chrome DevTools is not described again in this section. If you are not sure how to use it, see the Intro section in this article. Now let's see how to perform custom analysis by using AliNode. Click the first Analyze button and you can see the following information on the new page:
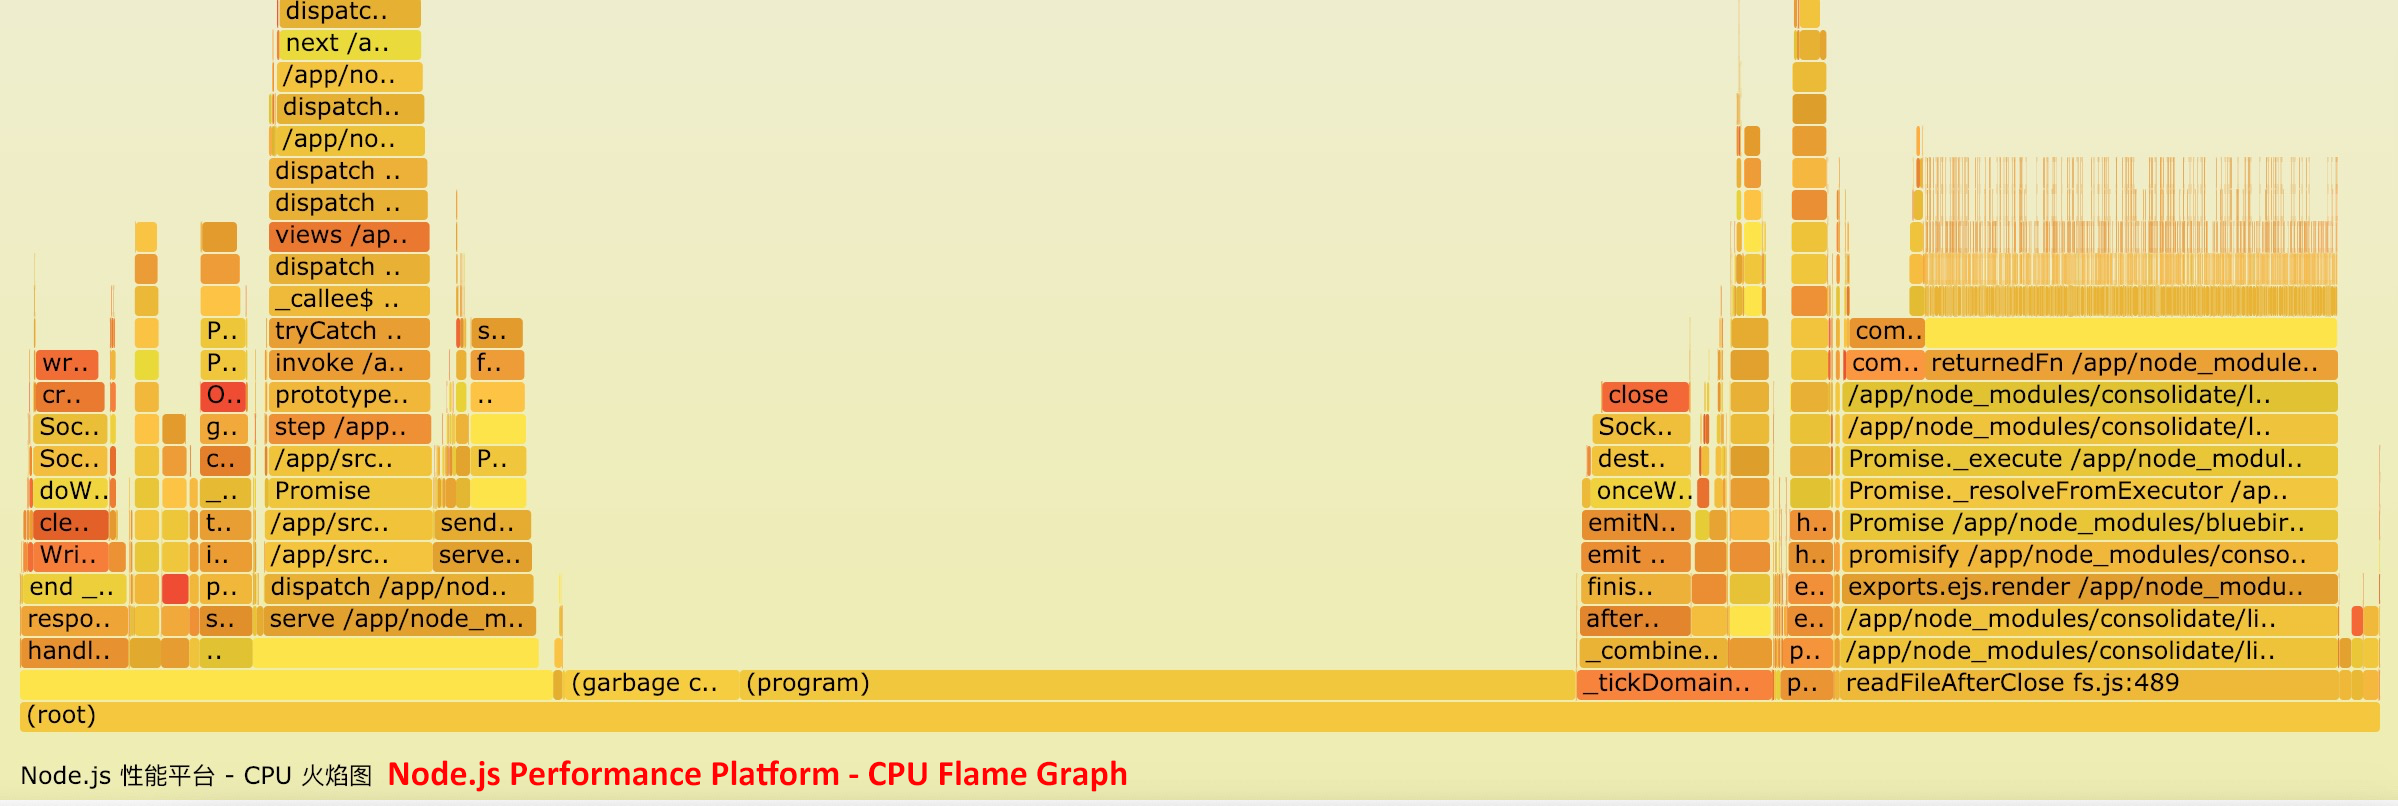
This flame graph is different from the flame graph in Chrome DevTools. This flame graph aggregates JS functions executed in three minutes. In scenarios where the same function is executed several times (each execution instance may take little time), a flame graph that contains the aggregation result is helpful for you to identify code execution bottlenecks and perform optimization accordingly.
Note that you can quickly find the code that causes problems by capturing the CPU Profile file if you are using AliNode runtime newer than v3.11.4 or v4.2.1 (inclusive) and encounter application problems like an endless loop. For example, an exceptional user parameter causes backtracking in a regular expression and it may take decades to run this regular expression (this is similar to an endless loop in a Node.js application). For more information, see Locate endless loops and regex attacks with Node.js Performance Platform.
Like a high CPU usage alert, when you receive an alert saying that a Node.js application process is taking heap memory usage higher than the configured threshold percentage, you also no longer need third-party modules like heapdump to export heap snapshots for analysis. Similarly, you can just click Heap Snapshot for the corresponding instance in the console to generate heap snapshots of the desired Node.js process:
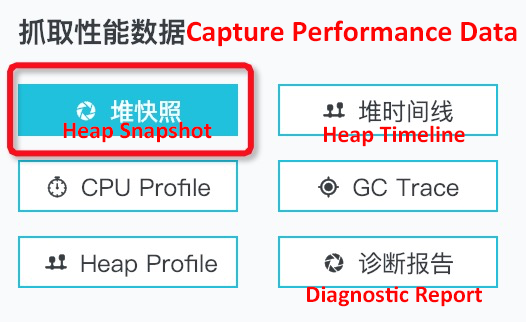
The heap snapshot file generated is also displayed on the File page. You can click Dump to upload the heap snapshot to the cloud for analysis later:

Similarly, the Analyze button with (DevTools) under it performs analysis with Chrome DevTools described before. Now let's see how to perform custom analysis with AliNode. Click the first Analyze button and you can see the following information on the new page.

First, I want to explain the information in the top section:
The preceding metrics provide an overview of the analysis. To thoroughly understand some specific information, you need to perform in-depth analysis of heap snapshot files. It does not matter much if you cannot understand some of these metrics, because it does not have any impact on locating the problematic code.
Now that you have had a basic understanding of the overview information, let's see some metrics that are of great importance to locating problematic Node.js application code snippets. The first metric is Suspicious Object. The preceding screenshot shows that the @15249 object uses 97.41% of the heap memory space. Therefore, this object may be an object that causes memory leaks. This may further fall into two possible cases:
To determine which of the two cases is true and locate the corresponding code snippets, you need to click Cluster View to make further observation:
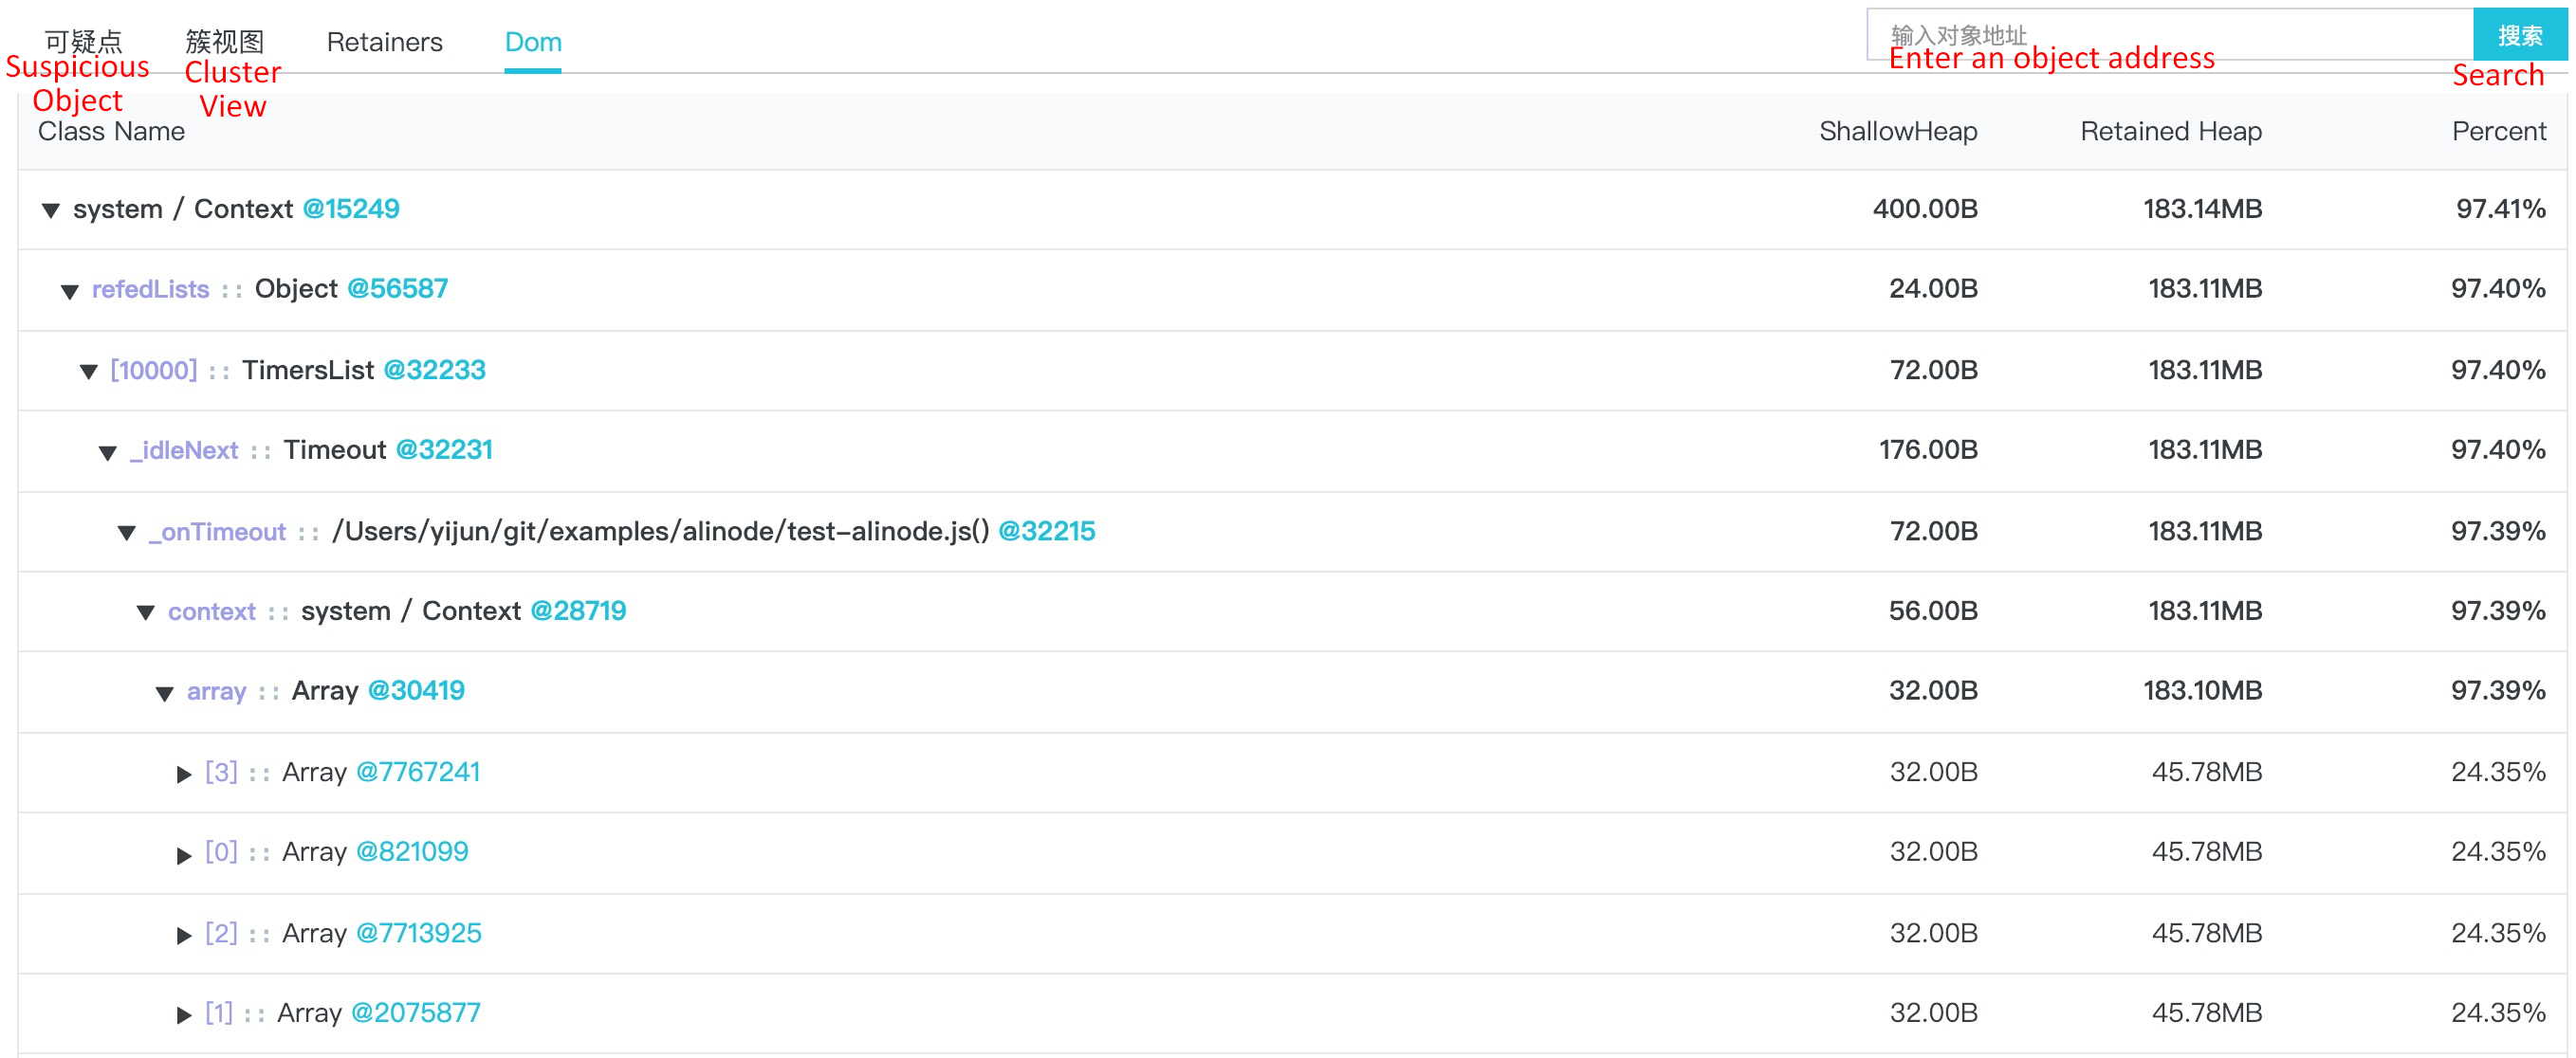
Let's review the cluster view concept: A cluster view is in fact an alias of a dominator tree. What you see under a cluster view is the dominator tree view starting from objects that suspiciously experience memory leaks. Under the cluster view, the Retained Size of the parent node is the sum of the Retained Size of its child nodes and the Shallow Size of the parent node itself. In other words, you can expand each object and see which nodes occupy memory for objects that possibly experience memory leaks.
As described in the previous section, the parent node and child nodes in a dominator tree do not necessarily have the corresponding parent-child object relationship in the real heap space. However, for cluster nodes that feature the parent-child node relationship both in the heap space and the dominator tree, the real edges are marked in light purple. These edges are helpful to find the problematic code snippets. In this simple example, you can obviously see that the problem is caused by an array variable where four 45.78 MB arrays are stored in test-alinode.js under the suspicious object @15249. Then the problematic code can be found and optimizations can be performed accordingly.
For the heap snapshot analysis in actual production scenarios, the parent-child relationship in the cluster view does not exist in the real heap space. Accordingly, no edges are displayed in purple. In this case, if you want to know how a suspicious leak object refers to the object that actually occupies a lot of heap space through the object reference relationship generated in JavaScript (for example, the 40+ MB Array object in the preceding figure), you can click the link to the suspicious node itself:

At this point, you are in the real object reference relationship view starting from that object: the Search view.

Because this view reflects the real reference relationship between heap objects in the heap space, the Retained Size of the parent object cannot be obtained by summing up the Retained Size of its child nodes. This is the biggest difference between the Search view and the cluster view. As shown in the preceding red box, the sum of the three child nodes exceeds 100%. In the Search view, the relationship between objects and edges allows you to find which part of your JavaScript code actually causes the suspicious memory leak object.
I believe that some of you may have already recognized that the Search view is similar to the Containment view in Chrome DevTools described before, except that the Search view starts from the object that you select.
Finally, let's move on to the Retainers view. This view is similar to the Retainers on the heap snapshot analysis result page in Chrome DevTools described before. It represents the parent reference relationship between objects:

In this example, the clearImmediate property of the object global@1279 points to timers.js()@15325, and the context property of timers.js()@15325 points to the suspicious memory leak object system / Context@15249.
In most cases, you can use the Search view and the Retainers together to find where a specified object is generated in the JavaScript code. In the cluster view, it is easy and convenient to find out which objects are using heap space. You can then further analyze online memory leaks and find the problematic code accordingly.
When you receive a core dump alert generated on the server, it means that your process unexpectedly failed to respond. If your Agenthub is properly configured, the core dump file generated will be automatically shown in File -> Coredump File:

Similarly, to see the server-side analysis and results, first you need to dump the core dump file generated on the server to the cloud. However, unlike CPU Profile and heap snapshots, you need to provide the corresponding startup execution file of a Node.js process, that is, the AliNode runtime file. In this example, you only need to set the runtime version:

Click Set Runtime Version to set a version of the format alinode-v{x}.{y}.{z}, for example, alinode-v3.11.5. The configured version will be verified. Make sure to enter the AliNode runtime version that your application is using. After entering a correct version, click Dump to dump the file to the cloud:

Apparently, Chrome DevTools does not provide the parsing function for core dump files. Therefore, only one Analyze button for AliNode analysis is provided. Click this Analyze button and you will obtain the analysis result:
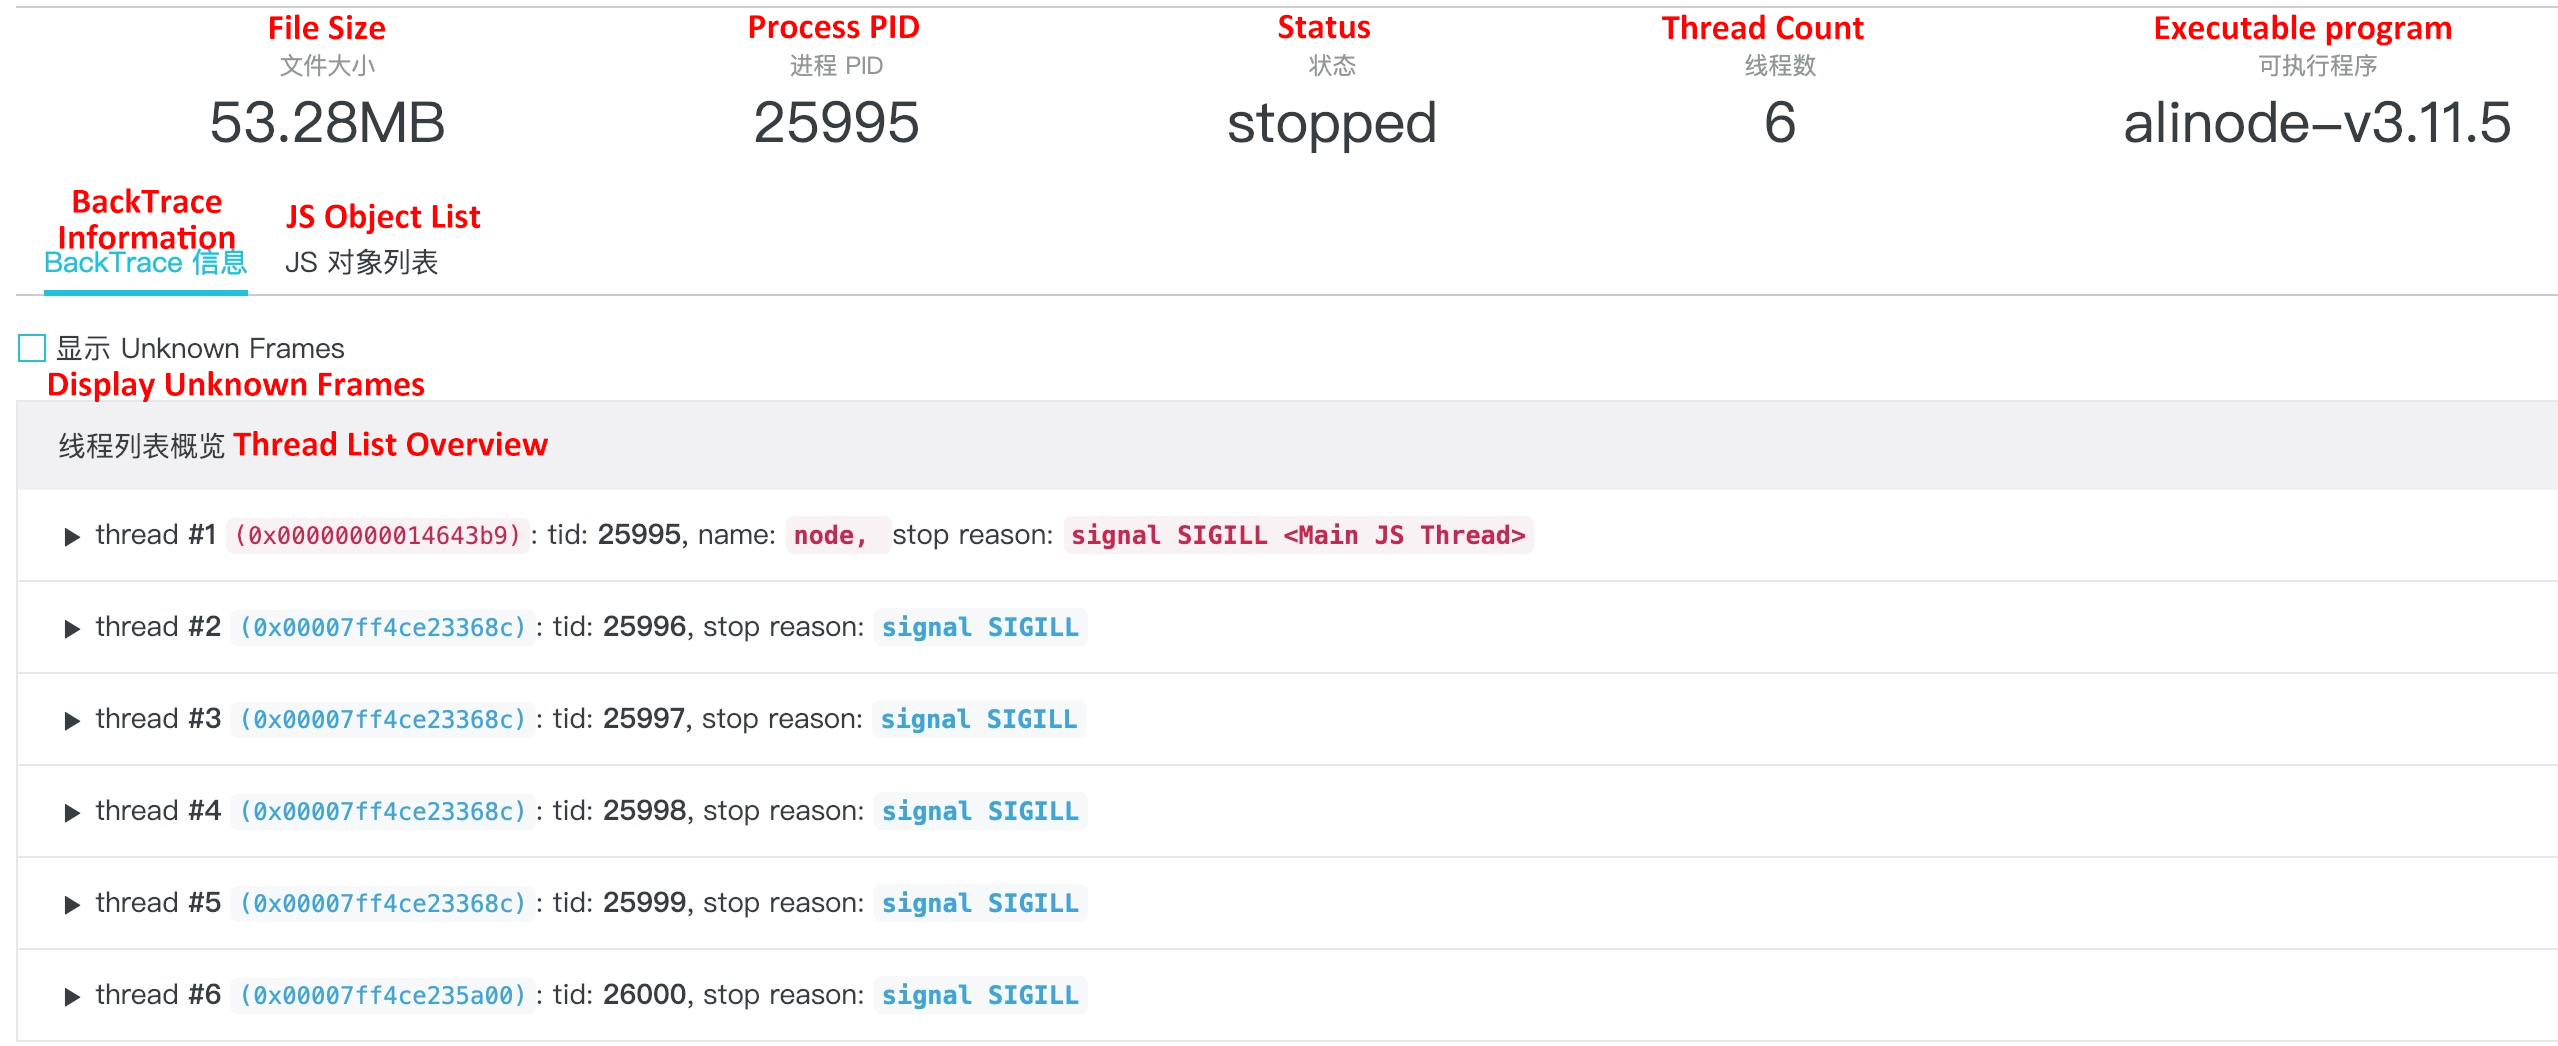
The overview information in the first row is as simple as what these metric names indicate and will not be explained further. Now let's see an important default view: BackTrace Information. This view displays thread information when a Node.js application fails to respond. Many developers tend to think that Node.js is a single-thread running model. Although they are not totally wrong, to be more accurate, it is a single-primary JavaScript worker thread, because Node.js also enables some background threads to process tasks such as GC.
In most cases, application crashes are caused by the JavaScript worker thread, so we only need to focus on this thread. This JavaScript worker thread is marked in red and put at the top of the list in the BackTrace Information view. After expanding the information, you can see the error stack information when the Node.js application crashed:
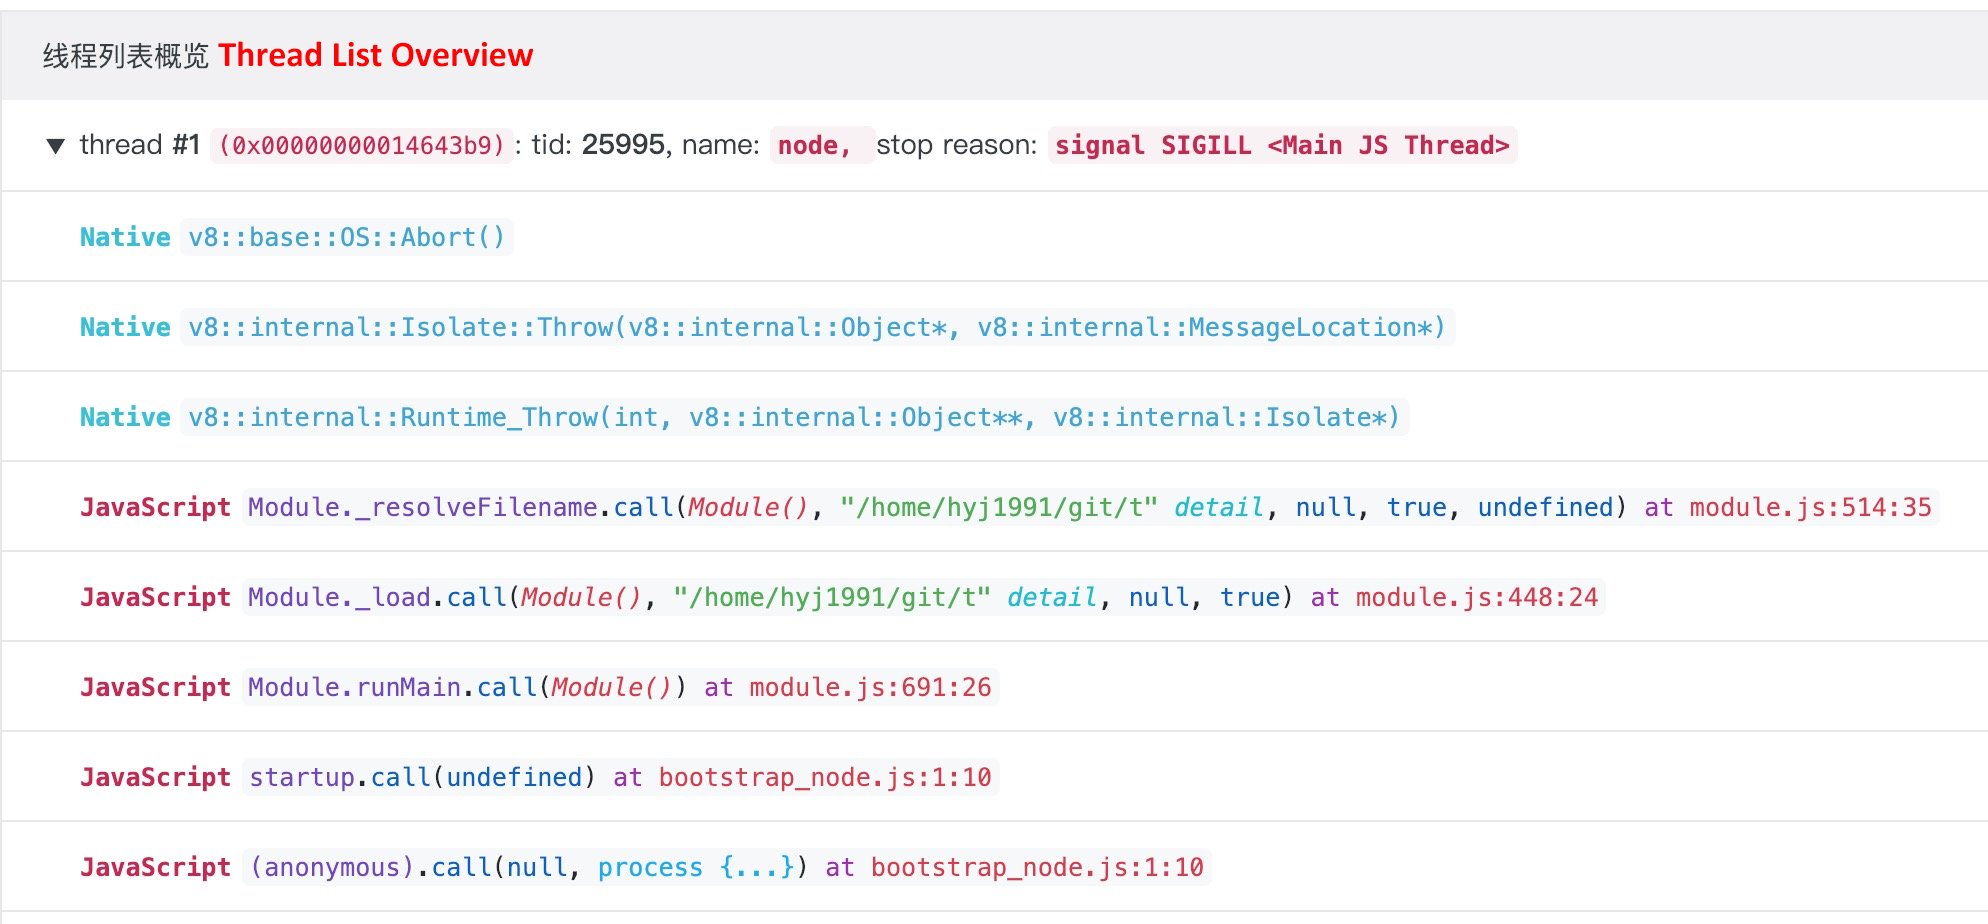
Mutual calls between JS and Native C/C++ may also exist in a JavaScript worker thread. However, often you only need to check the JavaScript stack information marked in red during troubleshooting. In this example, the crash is caused by the attempt to start a JS file that does not exist.
It is worth mentioning that the core dump analysis is extremely powerful. As mentioned in the preliminary chapter, core dump files can be generated by the system kernel at the time of an Node.js application crash or by manually using the gcore command. This section also shows that the core dump analysis allows you to see the JavaScript stack information and the input parameters. Therefore, you can directly use gcore to generate the core dump file when an application has problems like an endless loop mentioned in the CPU Profile section. Then you can upload the core dump file to the cloud platform for thorough analysis. By doing this, you cannot only see which line of JavaScript code blocks your application, but also obtain all the parameters that cause the blocking. This significantly helps in locating local problems.
This chapter describes the monitoring, alerting, analysis, and troubleshooting solutions and best practices of Node.js Performance Platform for Node.js application. I hope it has given you an overall and comprehensive understanding of the platform capabilities and you can learn how to use this platform to serve your specific projects better.
Due to the length of this article, examples of CPU Profiles, heap snapshots, and core dumps in the best practices section are very simple. This chapter is provided to help you understand the platform tools and how to use them for analyzing metric data. The third chapter in this manual will show some real cases in actual production scenarios to help you understand how to use the aforementioned tools in Node.js Performance Platform. I hope that you are now more confident about using Node.js applications in production after reading this chapter.
Node.js Application Troubleshooting Manual - Comprehensive GC Problems and Optimization
Node.js Application Troubleshooting Manual - OOM Caused by Passing Redundant Configurations
Alibaba Clouder - August 13, 2020
hyj1991 - June 20, 2019
hyj1991 - June 20, 2019
Alibaba Clouder - November 25, 2019
hyj1991 - June 20, 2019
hyj1991 - June 20, 2019
 ECS(Elastic Compute Service)
Elastic and secure virtual cloud servers to cater all your cloud hosting needs.
Learn More Mobile Testing
Provides comprehensive quality assurance for the release of your apps.
Learn More Web App Service
Web App Service allows you to deploy, scale, adjust, and monitor applications in an easy, efficient, secure, and flexible manner.
Learn More Elastic Desktop Service
A convenient and secure cloud-based Desktop-as-a-Service (DaaS) solution
Learn MoreMore Posts by hyj1991