By Yijun
The previous chapter uses one real stress testing case to explain how to use CPU Profile files generated in Node.js Performance Platform to implement performance optimization during stress testing. Compared with CPU problems, memory problems due to improper usage in Node.js applications are disastrous. In addition, these problems are difficult to reproduce by using local stress tests because they usually occur in the production environment. In fact, many Node.js developers are not courageous enough to use Node.js in the backend mainly due to memory concerns.
This chapter uses an OOM (out of memory) example in production often ignored by developers to show how to discover and analyze Node.js application OOM, locate the problematic code and fix OOM problems. I hope that this chapter can help you.
This manual is first published on GitHub at https://github.com/aliyun-node/Node.js-Troubleshooting-Guide and will be simultaneously updated to the community.
Note: At the time of writing, the Node.js Performance Platform product is only available for domestic (Mainland China) accounts.
Because memory leaks are different from the high CPU usage problem, it may be more intuitive to combine the problematic code and troubleshooting description. Therefore, the beginning of this chapter has minimum code snippets. You may find more by running the code and combining analysis steps described later. The sample is based on Egg.js:
'use strict';

const Controller = require('egg'). Controller;

const DEFAULT_OPTIONS = { logger: console };

class SomeClient {
  constructor(options) {
    this.options = options;
  }
  async fetchSomething() {
    return this.options.key;
  }
}

const clients = {};

function getClient(options) {
  if (! clients[options.key]) {
    clients[options.key] = new SomeClient(Object.assign({}, DEFAULT_OPTIONS, options));
  }
  return clients[options.key];
}

class MemoryController extends Controller {
  async index() {
    const { ctx } = this;
    const options = { ctx, key: Math.random().toString(16).slice(2) };
    const data = await getClient(options).fetchSomething();
    ctx.body = data;
  }
}

module.exports = MemoryController;
Add a Post request router to app/router.js:
router.post('/memory', controller.memory.index);The following is the demo of the problematic Post request:
'use strict';

const fs = require('fs');
const http = require('http');

const postData = JSON.stringify({
  // A relatively large string (around 2 MB) can be put in body.txt
  data: fs.readFileSync('./body.txt').toString()
});

function post() {
  const req = http.request({
    method: 'POST',
    host: 'localhost',
    port: '7001',
    path: '/memory',
    headers: {
      'Content-Type': 'application/json',
      'Content-Length': Buffer.byteLength(postData)
    }
  });

  req.write(postData);

  req.end();

  req.on('error', function (err) {
    console.log(12333, err);
  });
}

setInterval(post, 1000);
After running the demo server with minimum code reproduction, run this Post request on the client and initiate a Post request every second. In the platform console, you can see that the heap memory usage keeps increasing.
After receiving a process memory alert from Node.js Performance Platform, log on to the console, access the application homepage and find the problematic process in the corresponding instance based on the alert.

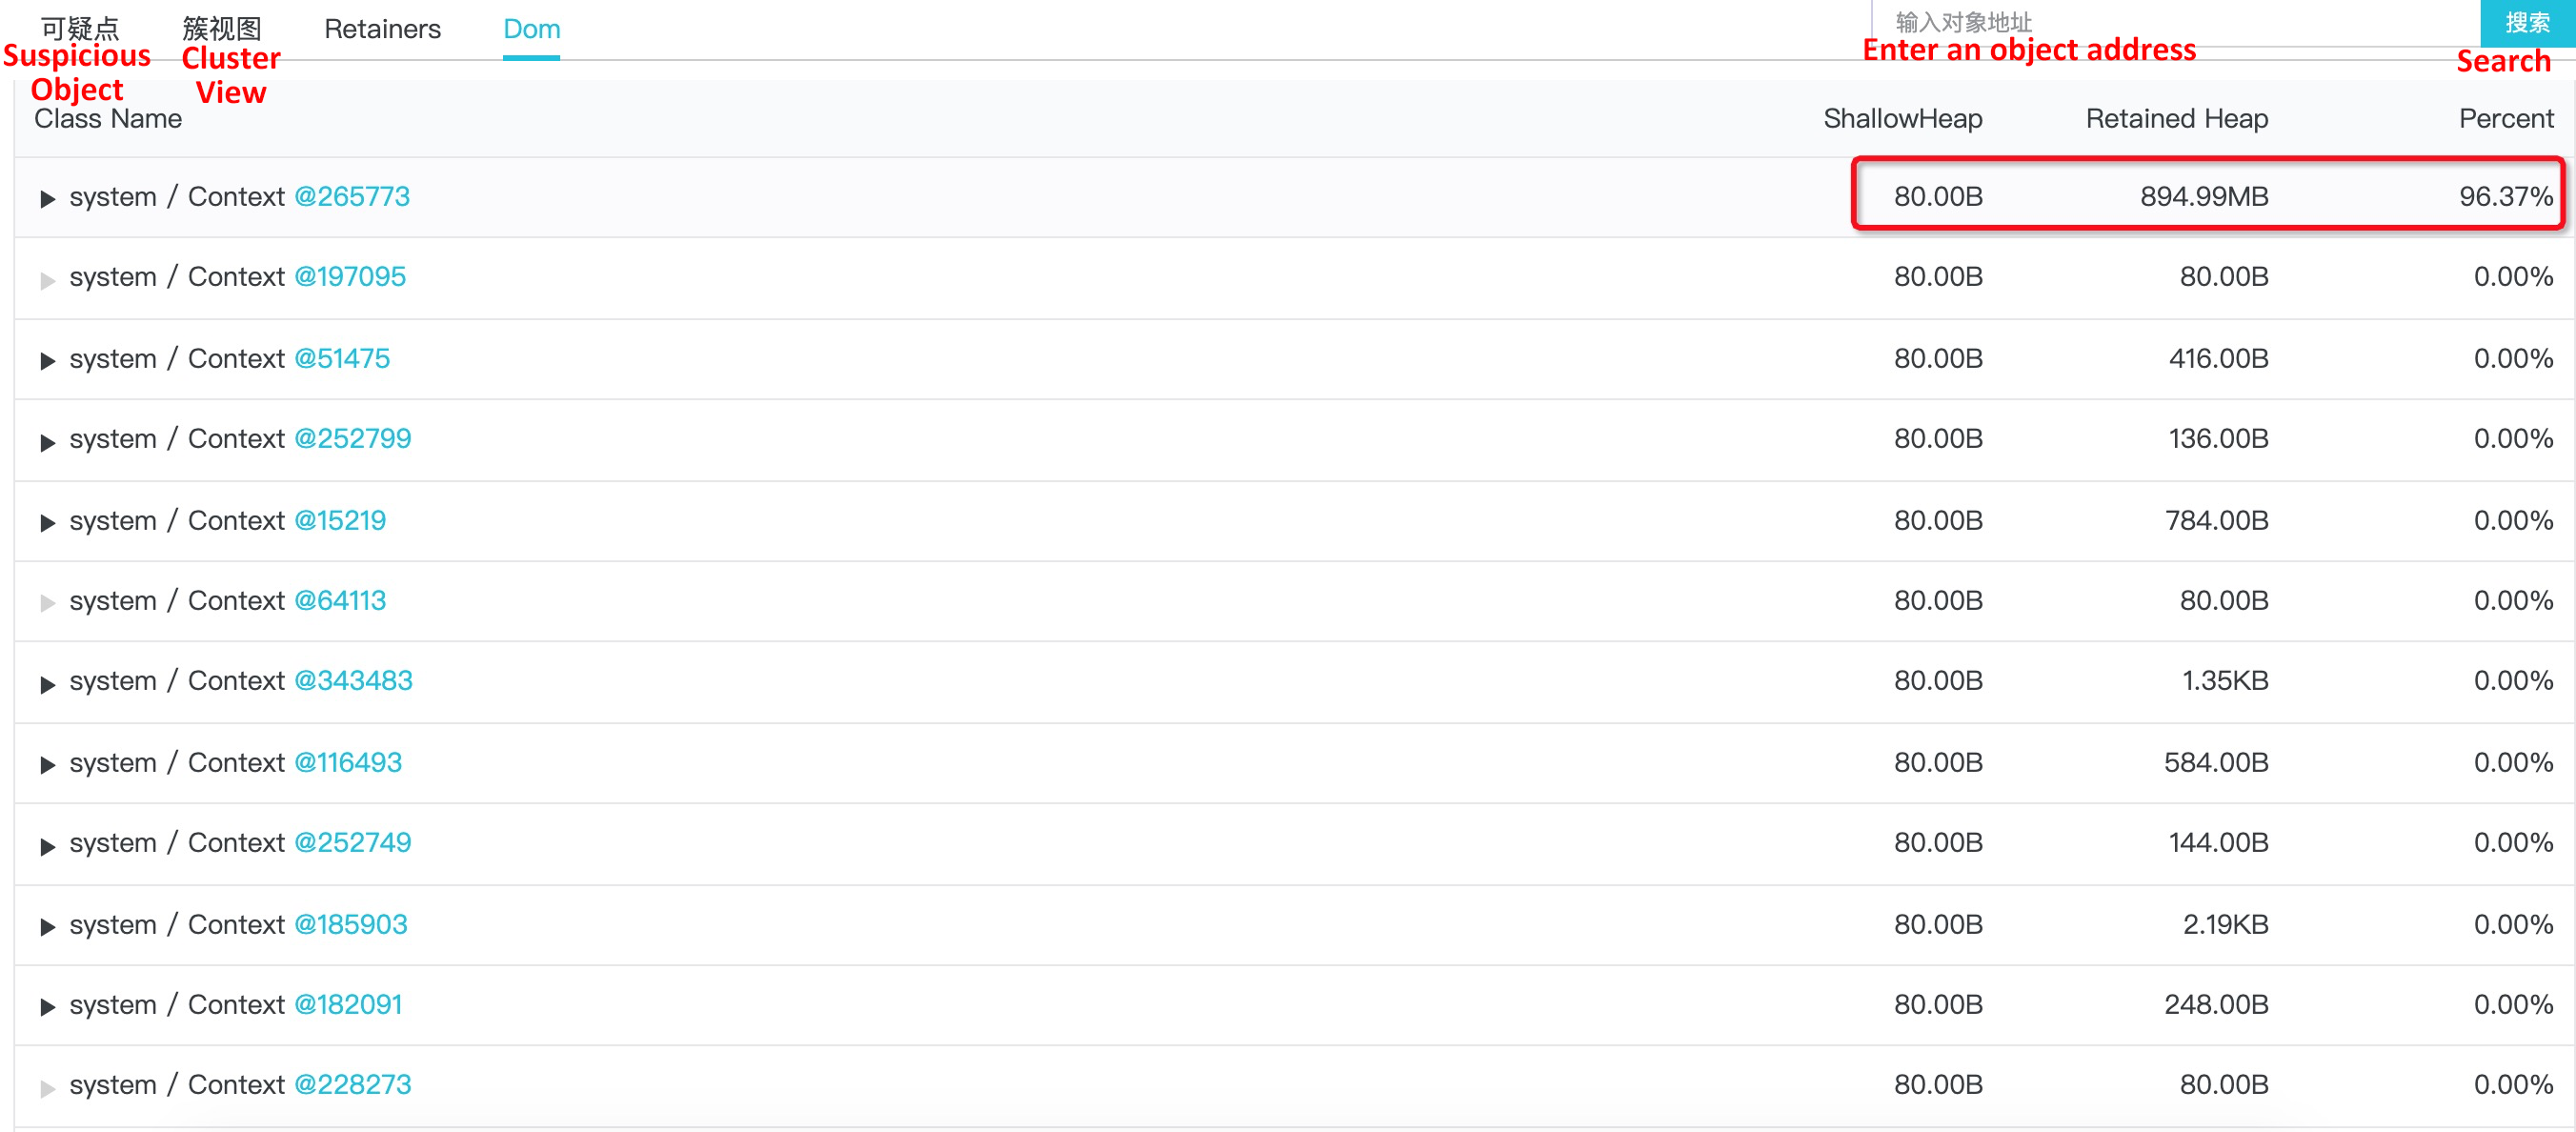
The default information at the top of the report has been explained before and will not be described here again. Now, let's look at some information about the suspicious node: The result shows that 18 objects occupies 96.38% of the heap size. Obviously, it is necessary to further check these objects. By clicking Object Name, you can see the detailed information about these 18 system/Context objects:

In this example, we access the dominator tree in which these 18 system/Context objects are root nodes. After expanding each object, you can see the actual memory usage for each object. In the preceding figure, the problem is obviously caused by the first object. Let's further expand and see relevant information:

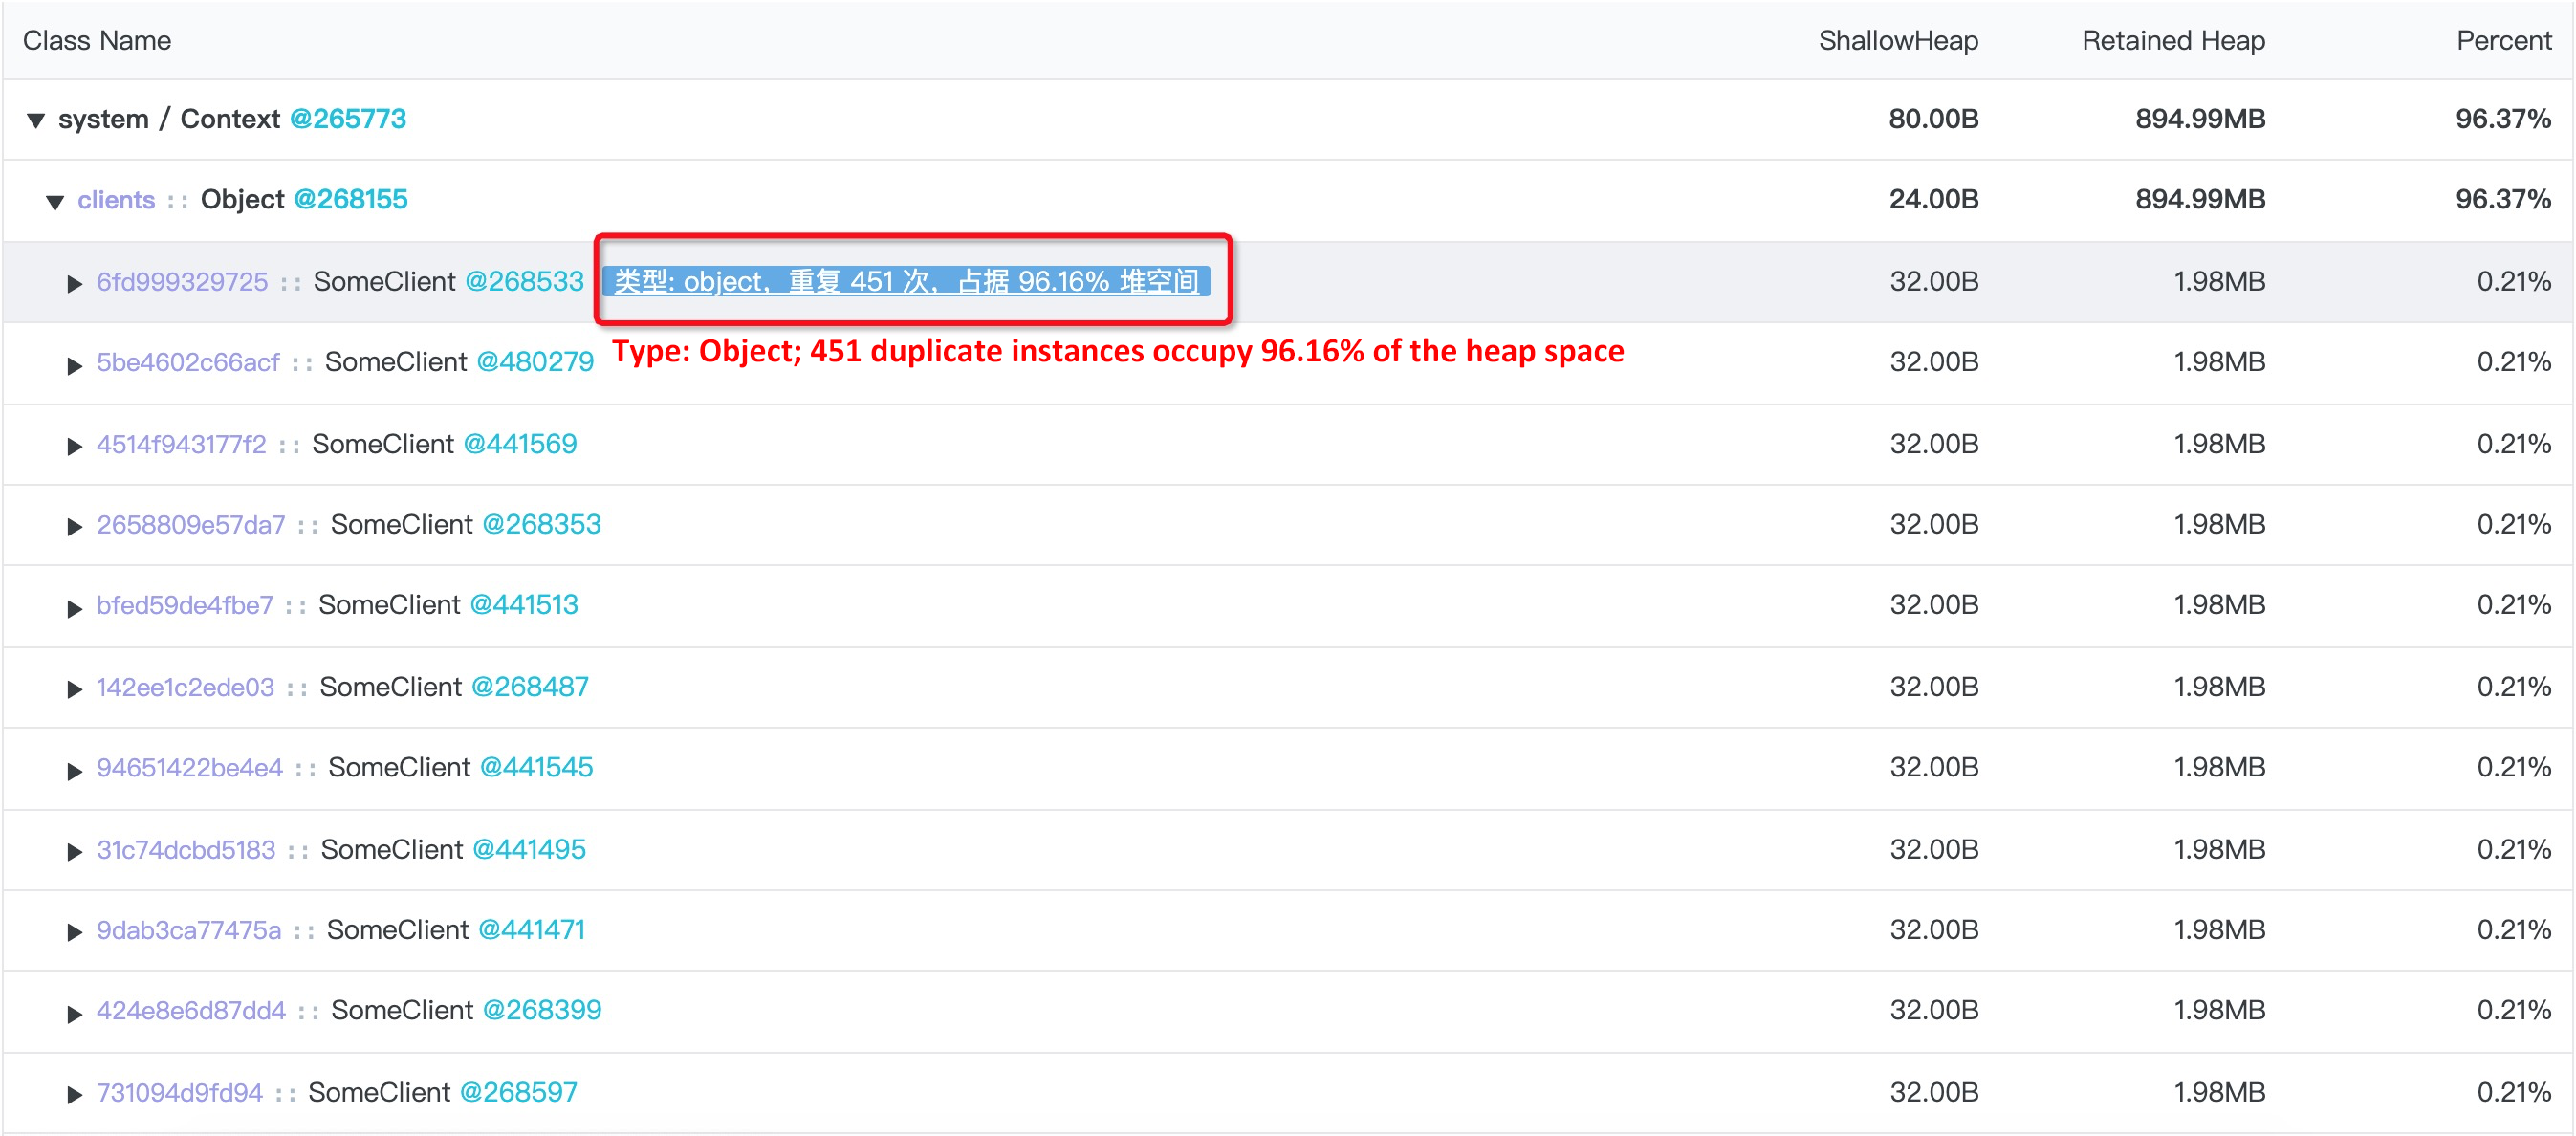
Obviously, what actually consumes too much heap space is 451 SomeClient instances. At this point, you need to determine if this is really the cause of the memory exceptions from two perspectives:
For the first question, we have re-confirmed the code logic in the real production scenario and found that this many Client instances are actually necessary. So the focus is mainly to determine if it is reasonable that each instance uses 1.98 MB space. If it is reasonable, the default 1.4 GB maximum heap size for a single process in a Node.js application is not applicable in this scenario. In this case, it is required to enable Flag to increase the maximum heap space.
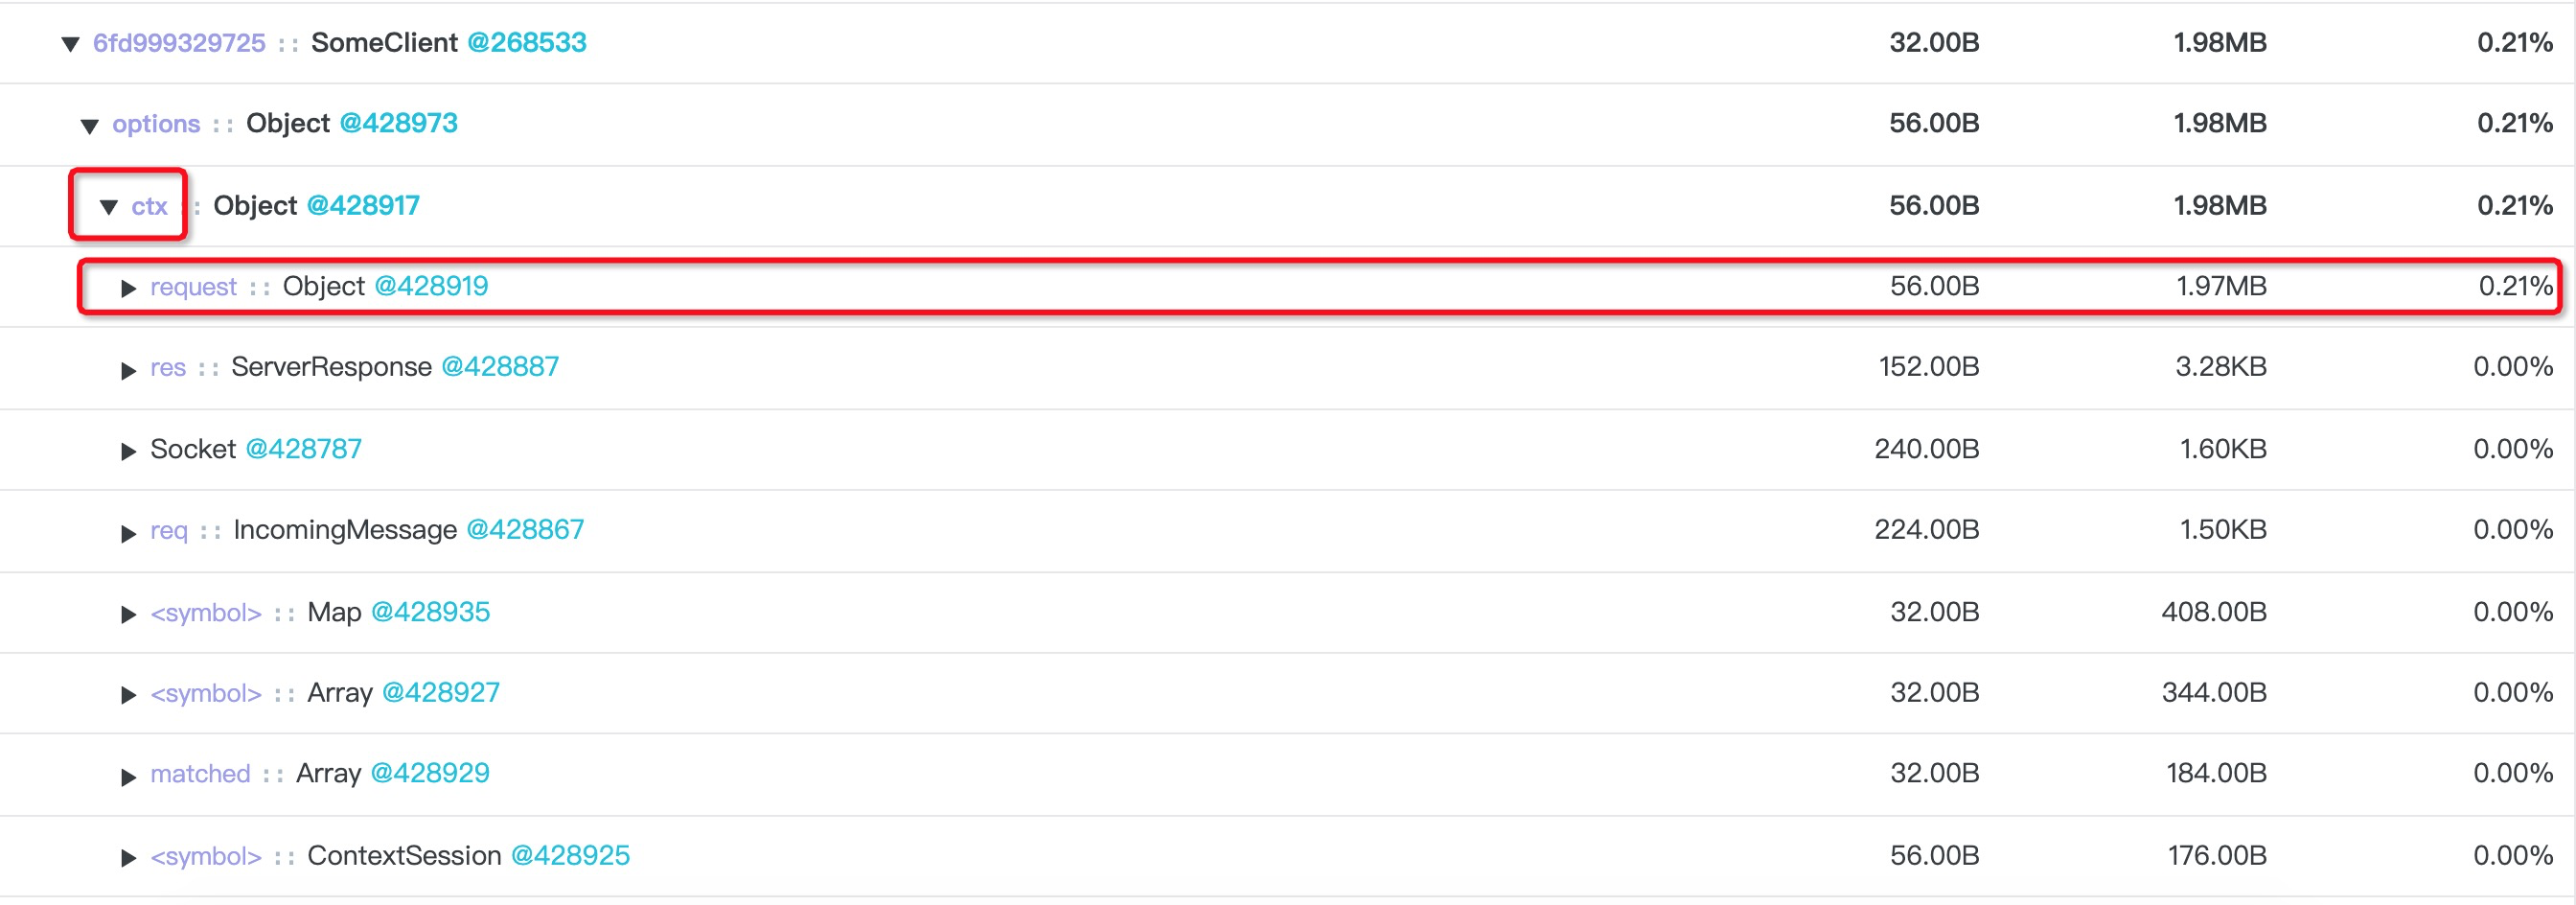
Click to further expand these SomeClient instances and view object information:

The SomeClient itself is only 1.98 MB. However, Object@428973 (the options property) under it occupies 1.98 MB. After expanding this Object@428973 object, you can see Object@428919 (the ctx property) is the reason why the SomeClient instance occupies too much heap space.
You can further see that this is true for any other SomeClient instances. At this point, you need to check the code to determine if it is also reasonable to mount the options.ctx property to the SomeClient instance. Click this problematic object:

Go to the relation graph of this object:

The Search view is different from the Dom view. The Search view displays the original object diagram resolved from the heap blocks, so the edge information is definitely present. By using the edge name and the object name, it is easy to judge the code that corresponds to this object.
However, in this example, the original memory diagram starting with Object@428973 alone cannot allow you to find the corresponding code. After all, both Object.ctx and Object.key are common JavaScript objects. Therefore, try to switch to the Retainer view:

You can see the following information:

The Retainer here is the same as the Retainer in Chrome DevTools. The Retainer represents the original parent reference relationship in the heap memory. Like in this example, if a suspicious object and detailed information obtained after expanding this object isn't enough to find the problematic code, you can expand the Retainers view for that object and view its parent node path to easily locate the problematic code.
By using the parent reference link of this problematic object in the Retainers view, you can easily find the code that creates this object:
function getClient(options) {
  if (! clients[options.key]) {
    clients[options.key] = new SomeClient(Object.assign({}, DEFAULT_OPTIONS, options));
  }
  return clients[options.key];
}
By combining the SomeClient, you can see that only the key property is actually used in the options parameter that is used for initialization. Other properties are redundant configuration and not required.
It is relatively simple to fix a problem when you know what actually causes that problem. You can separately generate the options parameter for the SomeClient and obtain the required data from the options input parameter to ensure that no redundant data exists:
function getClient(options) {
  const someClientOptions = Object.assign({ key: options.key }, DEFAULT_OPTIONS);
  if (! clients[options.key]) {
    clients[options.key] = new SomeClient(someClientOptions);
  }
  return clients[options.key];
}
After re-publishing and running this application, the heap memory drops to only dozens of MB. At this point, the memory exception problem has been perfectly solved.
This chapter describes how to troubleshoot memory leaks in online applications by using Node.js Performance Platform. Strictly speaking, the problem described in this chapter is not a real memory leak. Developers may encounter this problem more or less if they directly adopt full assignment while passing configuration. We can learn a lesson from this problem: Never trust the input parameters from users when writing a public component module; only keep and pass along parameters that we need to avoid many problems.
Node.js Application Troubleshooting Manual - Node.js Performance Platform User Guide
Node.js Application Troubleshooting Manual - Optimizing Throughput by Performing CPU Analysis
hyj1991 - July 22, 2019
Alibaba Clouder - November 26, 2019
hyj1991 - June 20, 2019
hyj1991 - June 20, 2019
hyj1991 - June 20, 2019
hyj1991 - June 20, 2019
 ECS(Elastic Compute Service)
Elastic and secure virtual cloud servers to cater all your cloud hosting needs.
Learn More Container Compute Service (ACS)
A cloud computing service that provides container compute resources that comply with the container specifications of Kubernetes
Learn More Mobile Testing
Provides comprehensive quality assurance for the release of your apps.
Learn More Web App Service
Web App Service allows you to deploy, scale, adjust, and monitor applications in an easy, efficient, secure, and flexible manner.
Learn MoreMore Posts by hyj1991