By Yijun
After years of development, Node.js has been widely used in a variety of applications, including the separation of front-end and backend in a Building-a-Backend-for-Frontend (BFF) application, and for the development of full stack development and client tools.
However, compared with the rapid development of the application layer of Node.js, the improvements in runtime have been relatively slow for most people who work as front-end developers. Insufficient runtime improvements also hinder the application and popularity of Node.js in businesses.
As one of the members of the Alibaba AliNode team, over the past few years I have experienced many online exceptions. Of these, the following points pose the greatest challenge to developers and are the most difficult to troubleshoot.
For the first exception type, when the memory gradually increases until OOM occurs, we have enough time to capture the heapsnapshot file to analyze the heap snapshot and locate the memory leaks. (See the previous article: Locate Online Node.js Memory Leaks)
For the second exception type, if the while loop termination condition fails, long regular expression execution causes a process to experience apparent death or exceptional requests cause applications to rapidly OOM, we usually do not have time to capture heapsnapshot files and cannot solve this issue efficiently. This article describes a method for analyzing and locating online application exceptions based on core dumps.
Let's first look at the core dump. A core dump is an auxiliary file that is provided for debugging and includes critical information like memory allocation, program counter, and stack pointer. A core dump is very helpful for developers to diagnose and debug applications. It is sometimes difficult to reproduce some application errors.
The core dump file can be generated using one of two methods:
1. When an application fails to respond unexpectedly, a core dump file is generated automatically.
For this method, we first need to use ulimit -c unlimited to enable the kernel restriction or add the --abort-on-uncaught-exception parameter when starting a Node application to automatically generate a core dump for uncaptured exceptions.
Note: this operation is not very secure because Guard tools that have the automatic restart feature like pm2 are generally applied online to guard processes. This means that if our application frequently stops responding or restarts, a lot of core dump files will be generated and may even use up the disk space on the server. If this option is enabled, make sure to monitor and alert on the server disk.
2. The core dump file can be generated by manually invoking gcore .
This method is generally used for in vivo verification, which locates problems if a Node.js process experiences apparent death. After obtaining the core dump file for the problematic process, we need to consider how to perform proper analysis.
Generally, tools such as mdb, gdb, and lldb can be used to diagnose crash causes. However, these tools can only help us track the stack information at the C++ level:
// crash.js
const article = { title: "Node.js", content: "Hello, Node.js" };

setTimeout(() => {
  console.log(article.b.c);
}, 1000);
After we enable the ulimit parameter and run node --abort-on-uncaught-exception crash.js, a file of the format core.<pid> is generated in the current directory (or under the /cores/ directory on Mac). Next, we try to use lldb to perform analysis:
$ lldb node -c core.<pid>The prompt in the command line "Core file xxx was loaded" suggests that the file has been loaded. Next, run bt to track the stack information regarding the application crash. The result is as follows:
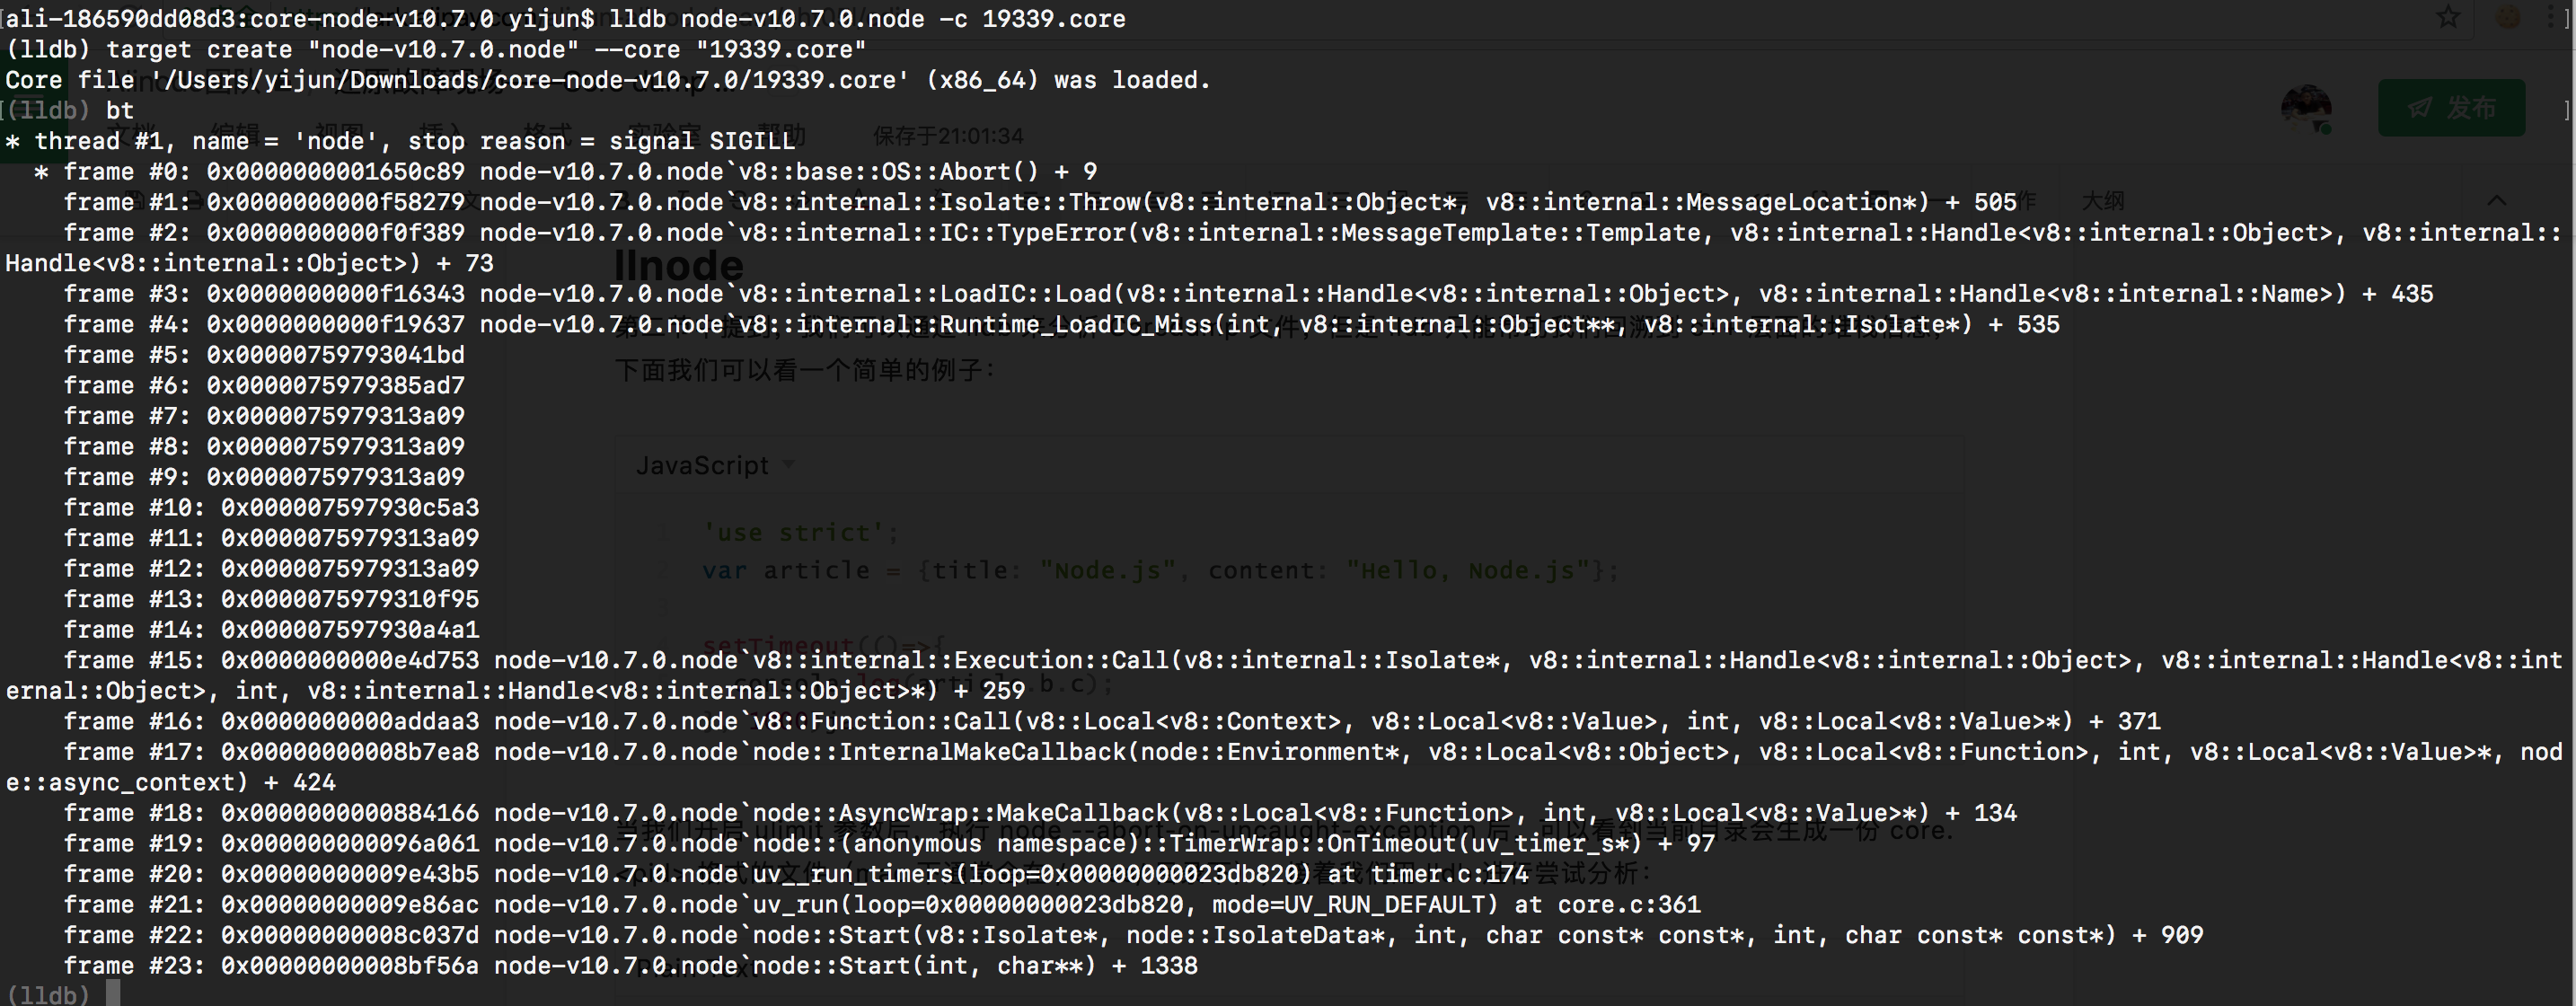
If you are familiar with Node.js source code, you will find that node::Start -> uv_run -> uv__run_timers is the code currently entering libuv. In this example, a timer running in the JS layer should be the cause of the crash. This analysis result is indeed consistent with our problematic code. However, C++ stack information alone cannot allow us to find which JS code actually triggers the crashed process due to the complexity of code in real scenarios.
In fact, llnode is a plug-in in lldb. With the APIs exposed in lldb, llnode can restore JS stacks and V8 objects after conversion. Is lldb similar to sourcemap?
$ # Install llnode
$ npm install llnode -g
$
$ # Perform analysis
$ llnode node -c core.<pid>
Run v8 bt to track information. The result is as follows:
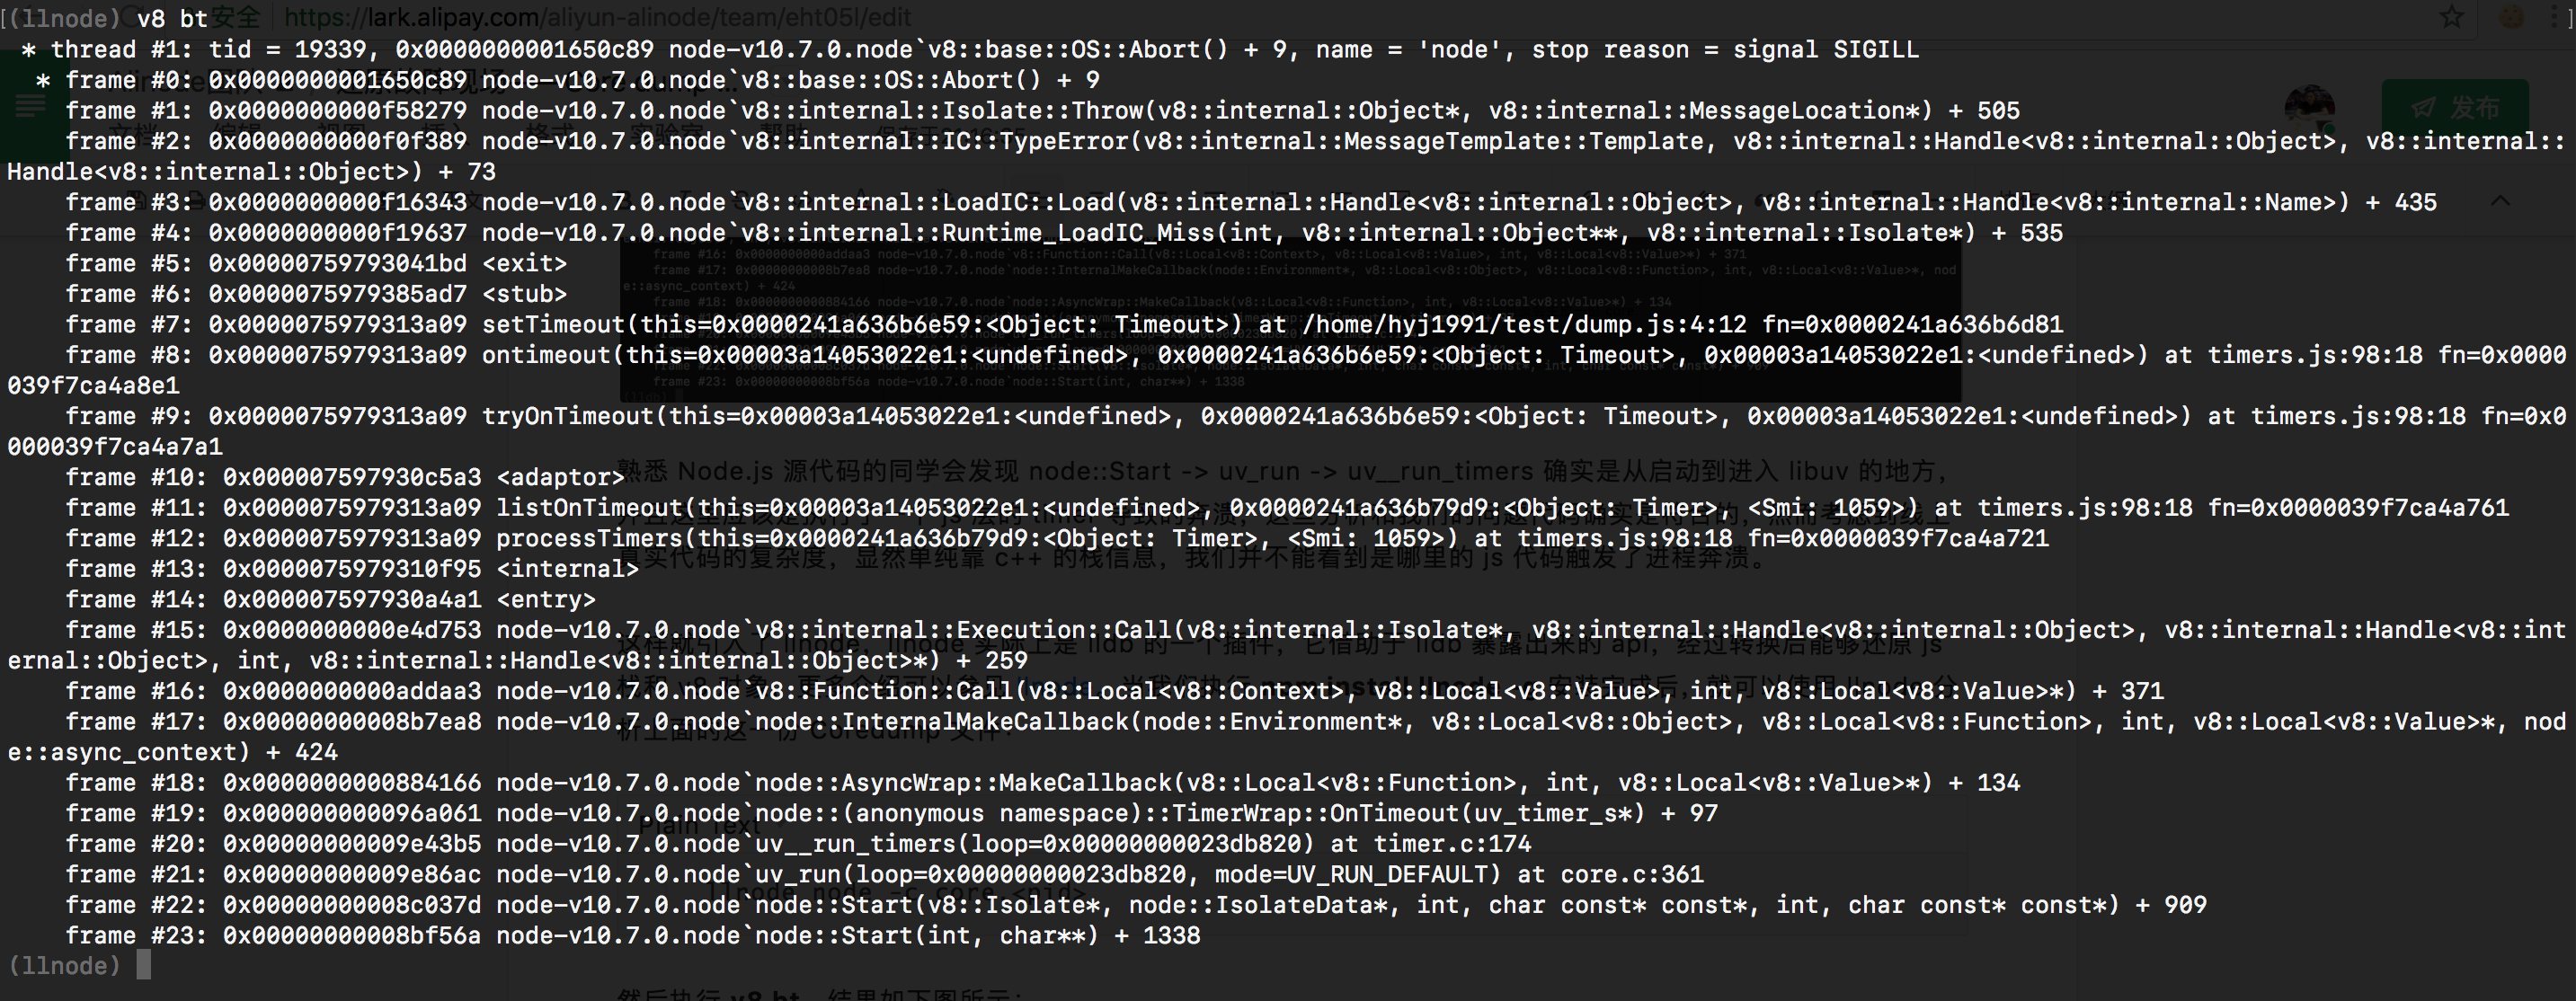
Now that we have obtained the more complete JS stack information, we can locate the problem function.
It seems that discussion on this topic should end here. After all, using llnode and core dumps can solve the problem.
However, in practice, llnode on clients have the following problems:
1. Complex installation and configuration:
2. Insufficiently automated and smart analysis:
Coredump Analysis Service is a free service provided in Node.js Performance Platform (Alinode). We have made some tailored development and in-depth customization to solve the aforementioned problems, reduce the threshold for developers to use this service and allow them to have a smarter tool for analyzing and locating online exceptions.
In the next sections, I will use two real cases to show how this service can solve faults.
First, let's see how to upload Coredump files and executable node files for analysis. Access the console homepage and open the File option in any application.
By default, the file list shows original analysis files such as Heapsnapshot, CPU Profile, and GC Trace. Now the Coredump analysis file list has been added. You can see the added content simply by moving the cursor to the File button on the left-side panel:
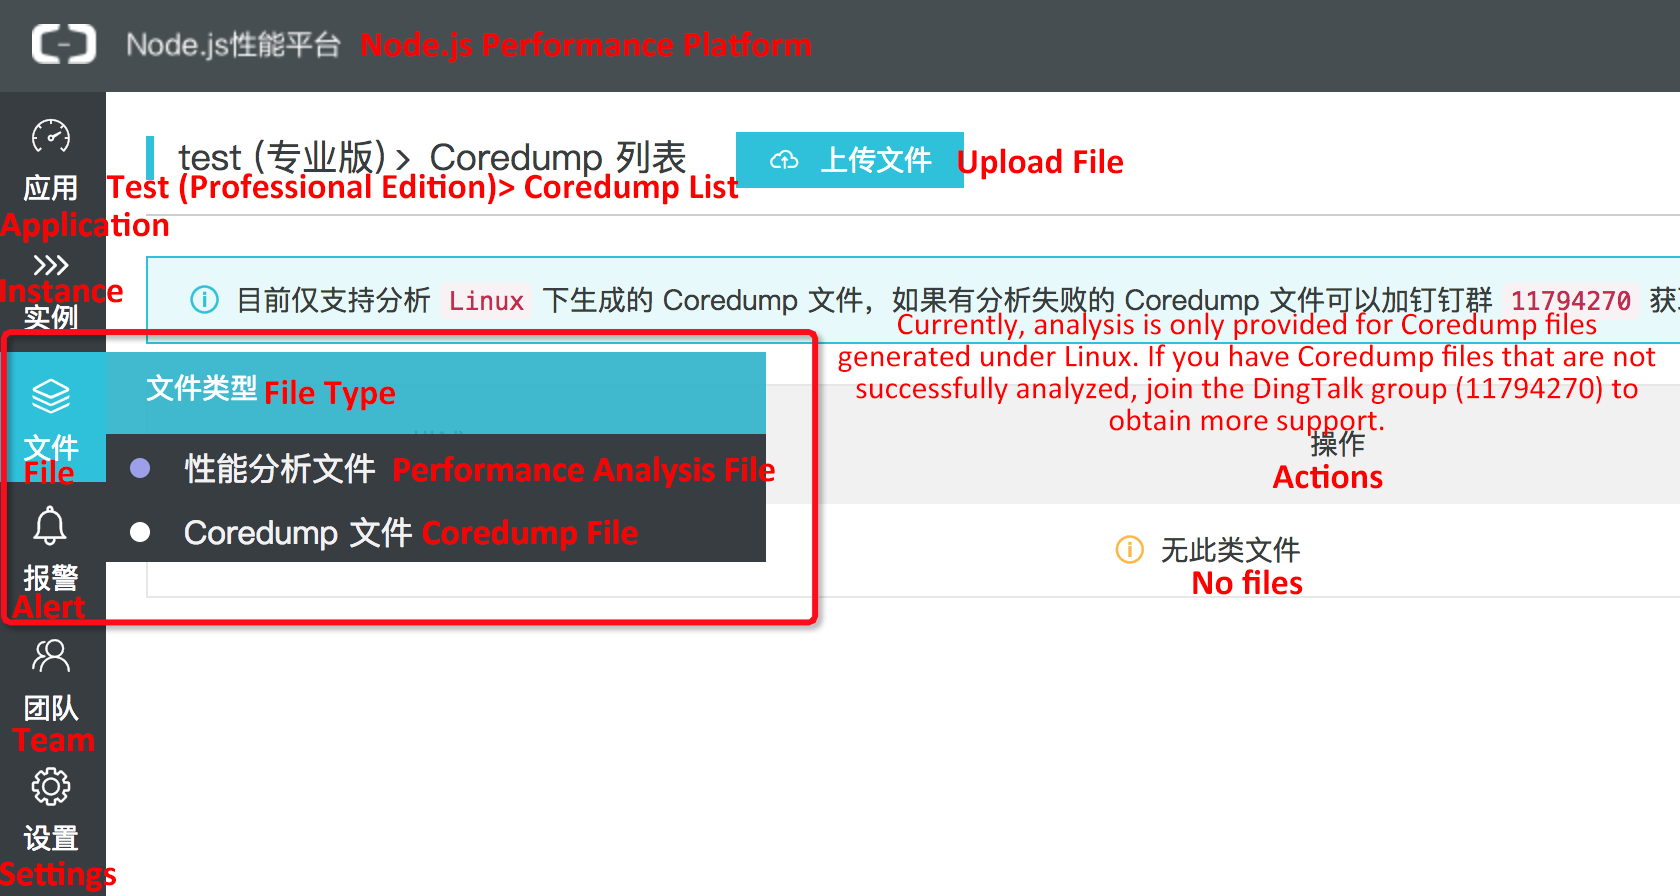
Select Coredump File to access the Coredump file list. Click the Upload File option shown in the preceding screenshot to upload the corresponding Coredump file and node executables to the server as prompted from the pop-up window.
Note: In this step, a Coredump file needs to be given a new name ending with .core and a Node executable file needs to be given a new name ending with .node. The recommended naming format is <os info>-<alinode/node>-<version>.node (for example, centos7-alinode-v4.2.2.node) to facilitate easy and convenient future use. Finally, the Coredump file and the node executable file must have one-to-one correspondence. The one-to-one correspondence here indicates that the Coredump file must be generated by the process started by the corresponding Node executable file. If there is no one-to-one correspondence, the analysis results are usually invalid.
The sample is built in Egg.js. Let's first see the following snippet of egg controller code:
'use strict';
const Controller = require('egg'). Controller;

class RegexpController extends Controller {
  async long() {
    const { ctx } = this;
    let str = '<br/>                                             ' +
      'Plan your activities as you wish after breakfast, gather together at the specified time and check out of the hotel on your own.' ;
    str += '<br/>                                      <br/>' +
      '                                        <br/>           ' +
      '                         <br/>';
    str += '                                    <br/>' +
      '                                                        ' +
      '                                                        ' +
      '        <br/>';
    str += '                                                <br/>                                                                                                                <br/>';
    str += '                                                     ' +
      '                                                        ' +
      'Go to the Siem Reap Airport according to the flight departure time by yourself and return to China. <br/>';
    str += 'If airport transportation services are needed, you will be charged an extra ¥280 per order. <br/>';
    const r = str.replace(/(^(\s*? <br[\s\/]*? >\*?) +|(\s*? <br[\s\/]*? >\s*?) +? $)/igm, '');
    ctx.body = r;
  }
}

module.exports = RegexpController;
In Node.js applications, regular expression matching is a common operation. In addition, regular expression matching strings usually come from users and internal interfaces. This means that matching strings are not very controllable. If some exceptional input triggers disastrous backtracking in regular expressions, it takes several years or even decades to run the task. In either case, the single-primary worker process model will cause our Node.js applications to experience apparent death, which means that the process still exists but cannot process new requests.
The preceding code snippet simulates this backtracking status. When we access the controller, we find that the Node.js server immediately gets stuck. At this point, we use gcore to generate a Coredump file for the current process. Follow the steps in the previous section to rename and upload the Coredump file and its corresponding node executable file, and wait patiently. When these files are successfully loaded, we can see this:

Click the Analyze button to start analysis. The analysis result is as follows:
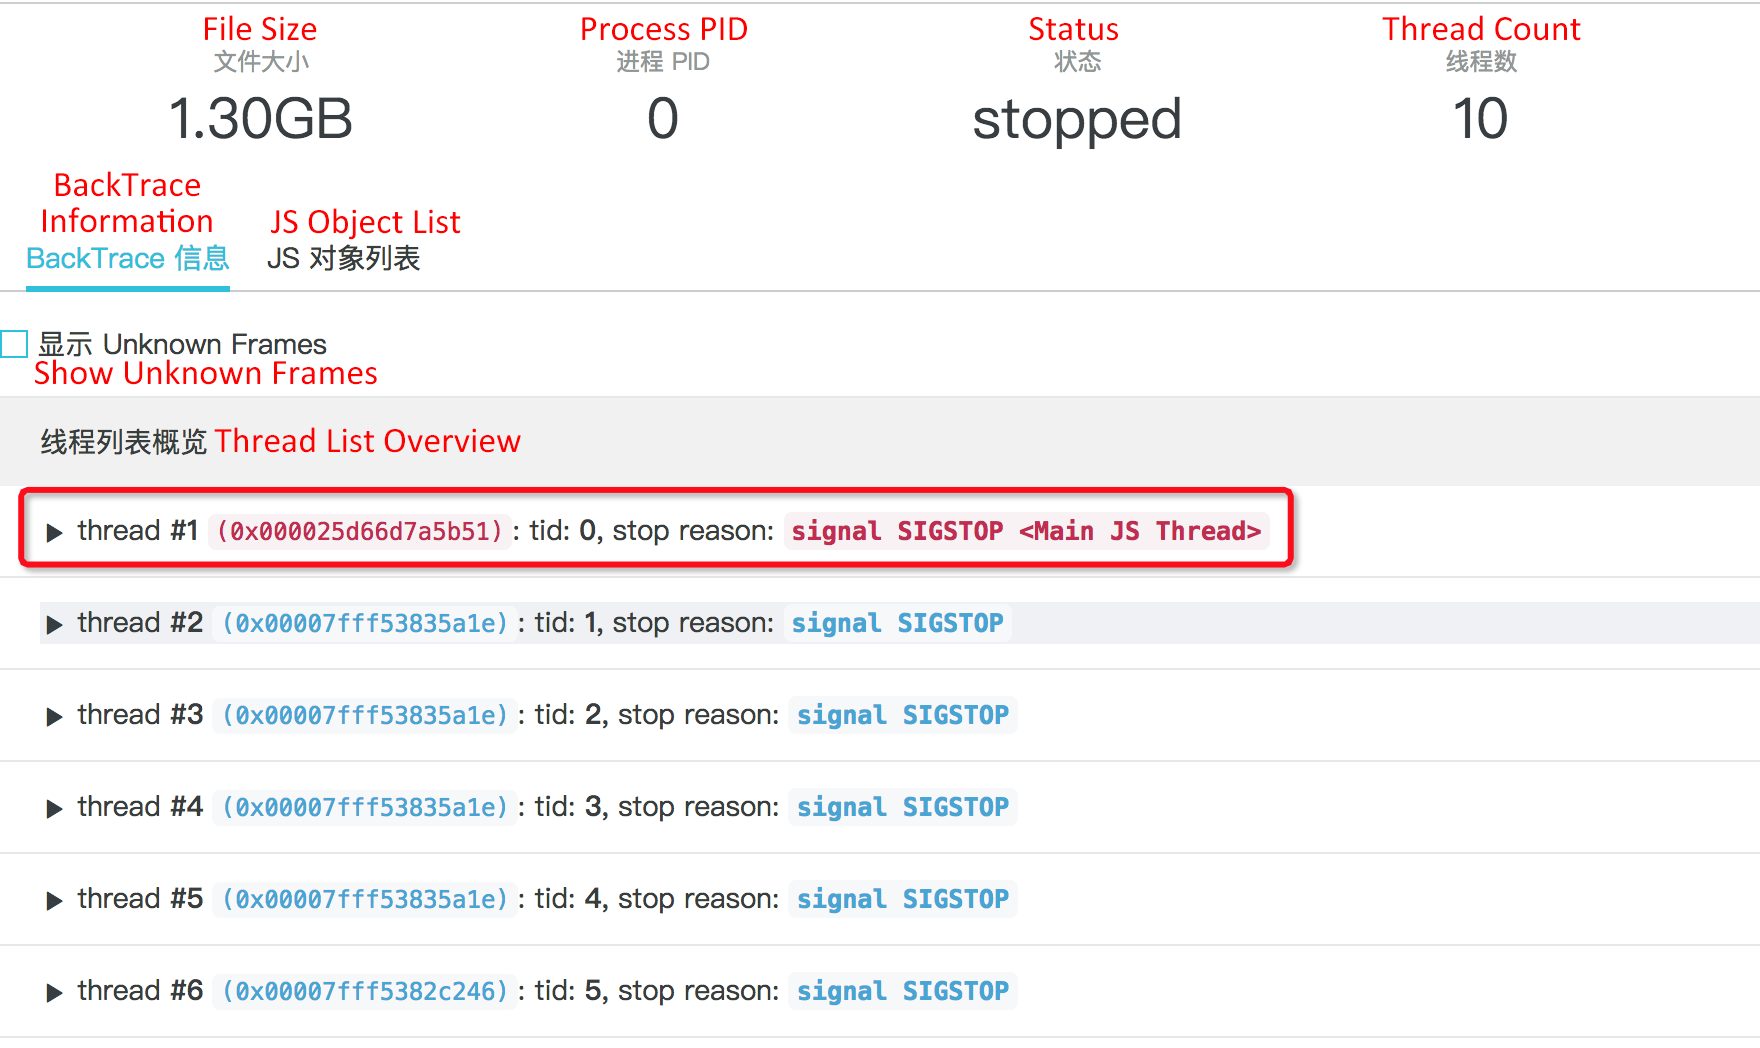
In llnode, the default thread 1 is not necessarily the main thread. In this example, we filter the thread that contains JS stack information, mark it in red and put it to the top of the list. After clicking Main JS Thread, we can see the details of the current frame:
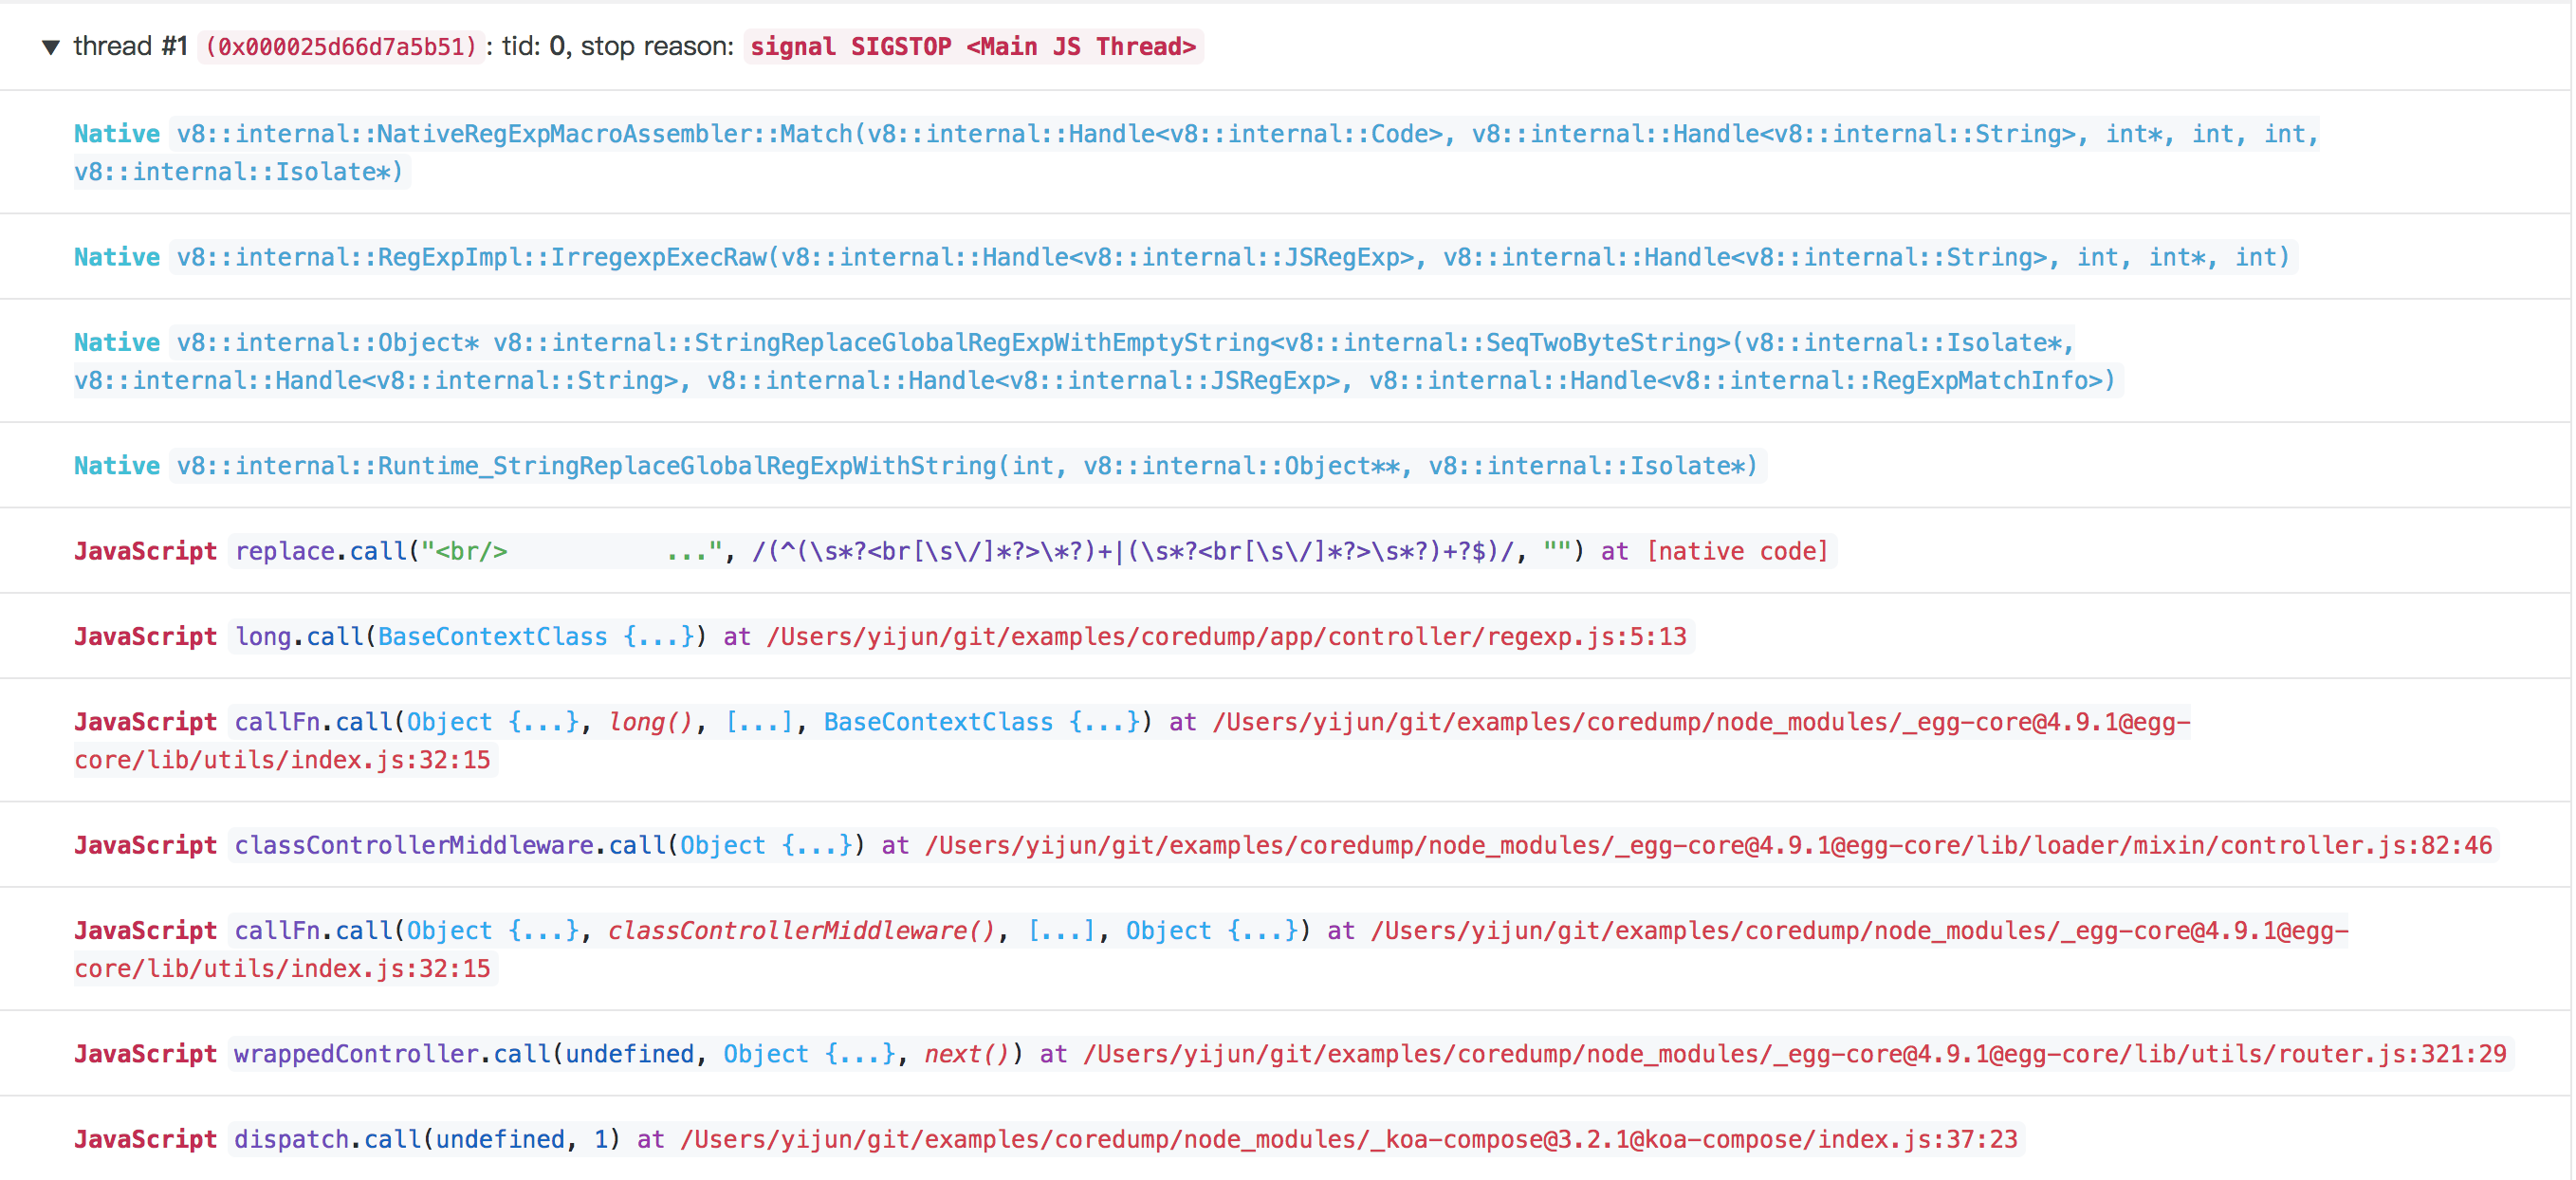
We can easily see that the process is performing a replace operation and find what the content of this regular expression is and which function is performing this replace operation. The regular expression matching string is omitted on the page. If you want to see more information, simply move your cursor to the "..." string and click the string:

We can see that the strings are completely consistent with those in the simulation code that triggers long-term backtracking. We also provide a relatively lightweight solution for long-term 100% CPU usage.
Rapid heap memory avalanches are another type of problem that are hard to troubleshoot. When we receive a heap memory alert, the process may have experienced OOM and been restarted due to memory alert latency. In this case, we have no time to capture heap snapshots. Let's see the following example:
'use strict';
const Controller = require('egg'). Controller;
const fs = require('fs');
const path = require('path');
const util = require('util');
const readFile = util.promisify(fs.readFile);

class DatabaseError extends Error {
  constructor(message, stack, sql) {
    super();
    this.name = 'SequelizeDatabaseError';
    this.message = message;
    this.stack = stack;
    this.sql = sql;
  }
}

class MemoryController extends Controller {
  async oom() {
    const { ctx } = this;
    let bigErrorMessage = await readFile(path.join(__dirname, 'resource/error.txt'));
    bigErrorMessage = bigErrorMessage.toString();
    const error = new DatabaseError(bigErrorMessage, bigErrorMessage, bigErrorMessage);
    ctx.logger.error(error);
    ctx.body = { ok: false };
  }
}

module.exports = MemoryController;
This is a real online exception. When we use egg-logger to generate logs, we often directly generate logs without making some parameter restrictions, just like this example. In egg-logger, if the first parameter that we pass in is an erroneous instance, the inspect method in the core Node.js library util will be invoked to implement formatting. This is where the problem occurs. If some of the error object properties have large strings, overflow will occur during the inspection, causing OOM. In this example, a large string is added in the resource/error.txt to simulate this situation.
At this point, if we have enabled the ulimit parameter as described in the second section, a Coredump file will be automatically generated when heap memory avalanches happen. We can upload the Coredump file and its corresponding node executable file to Node.js Performance Platform and click Analyze. After the analysis completes, we click to open the main JS thread marked as red. We can see the following information:
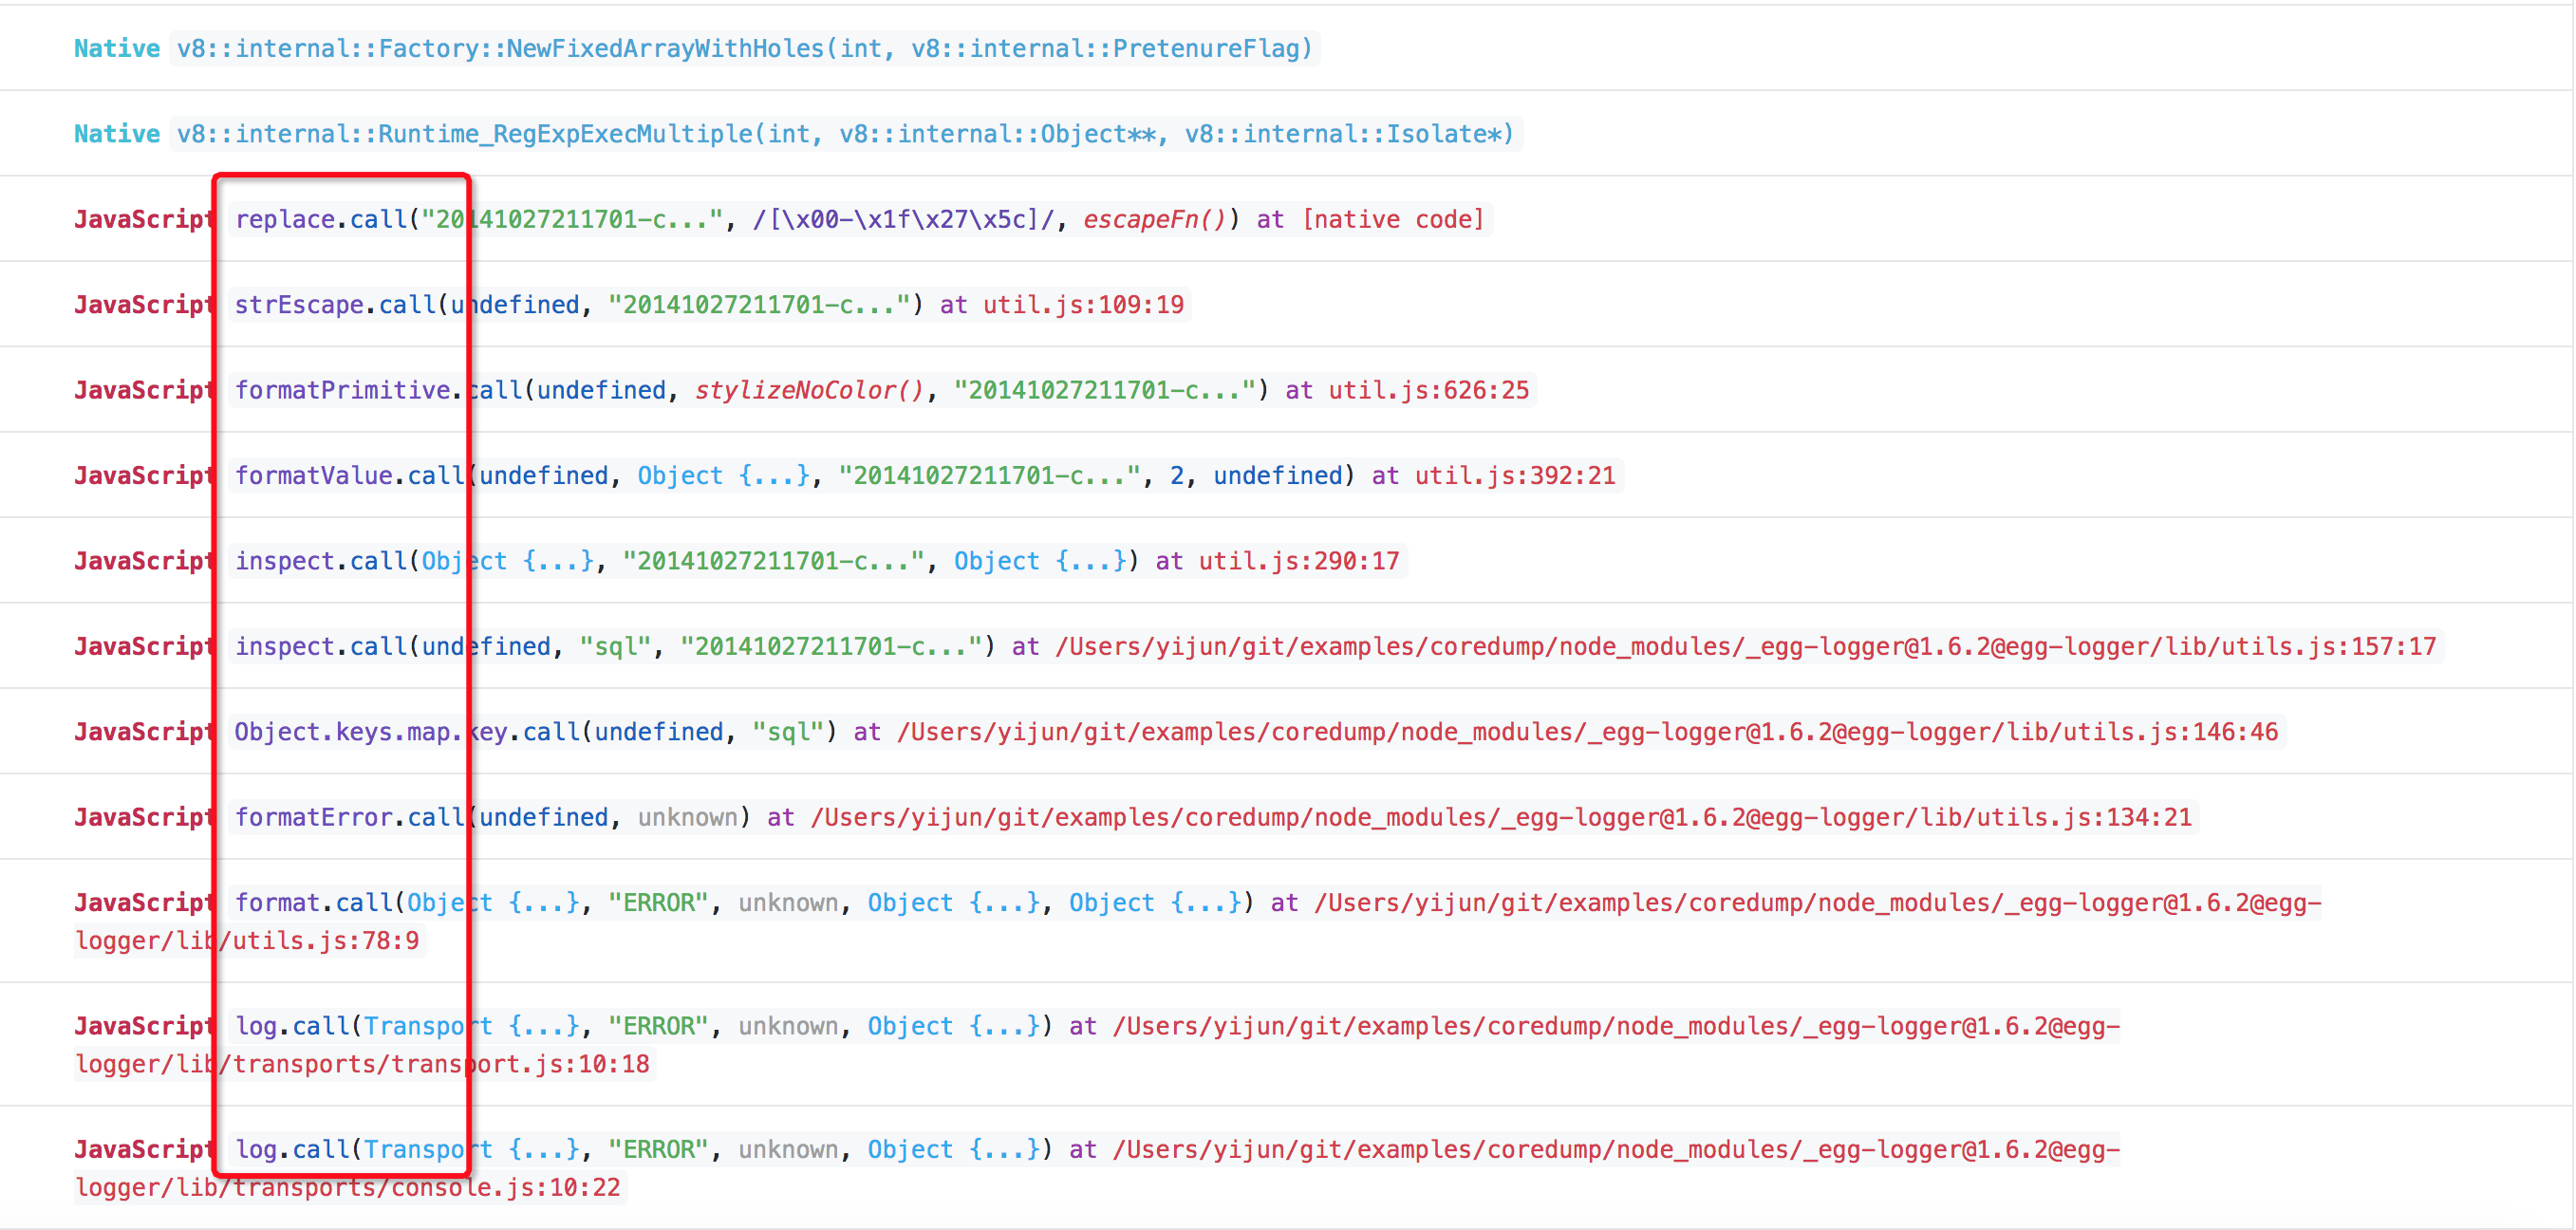
The JS call stacks are completely the same as what we mentioned before. Moreover, we can see the size of the problematic string simply by moving the cursor onto that string:
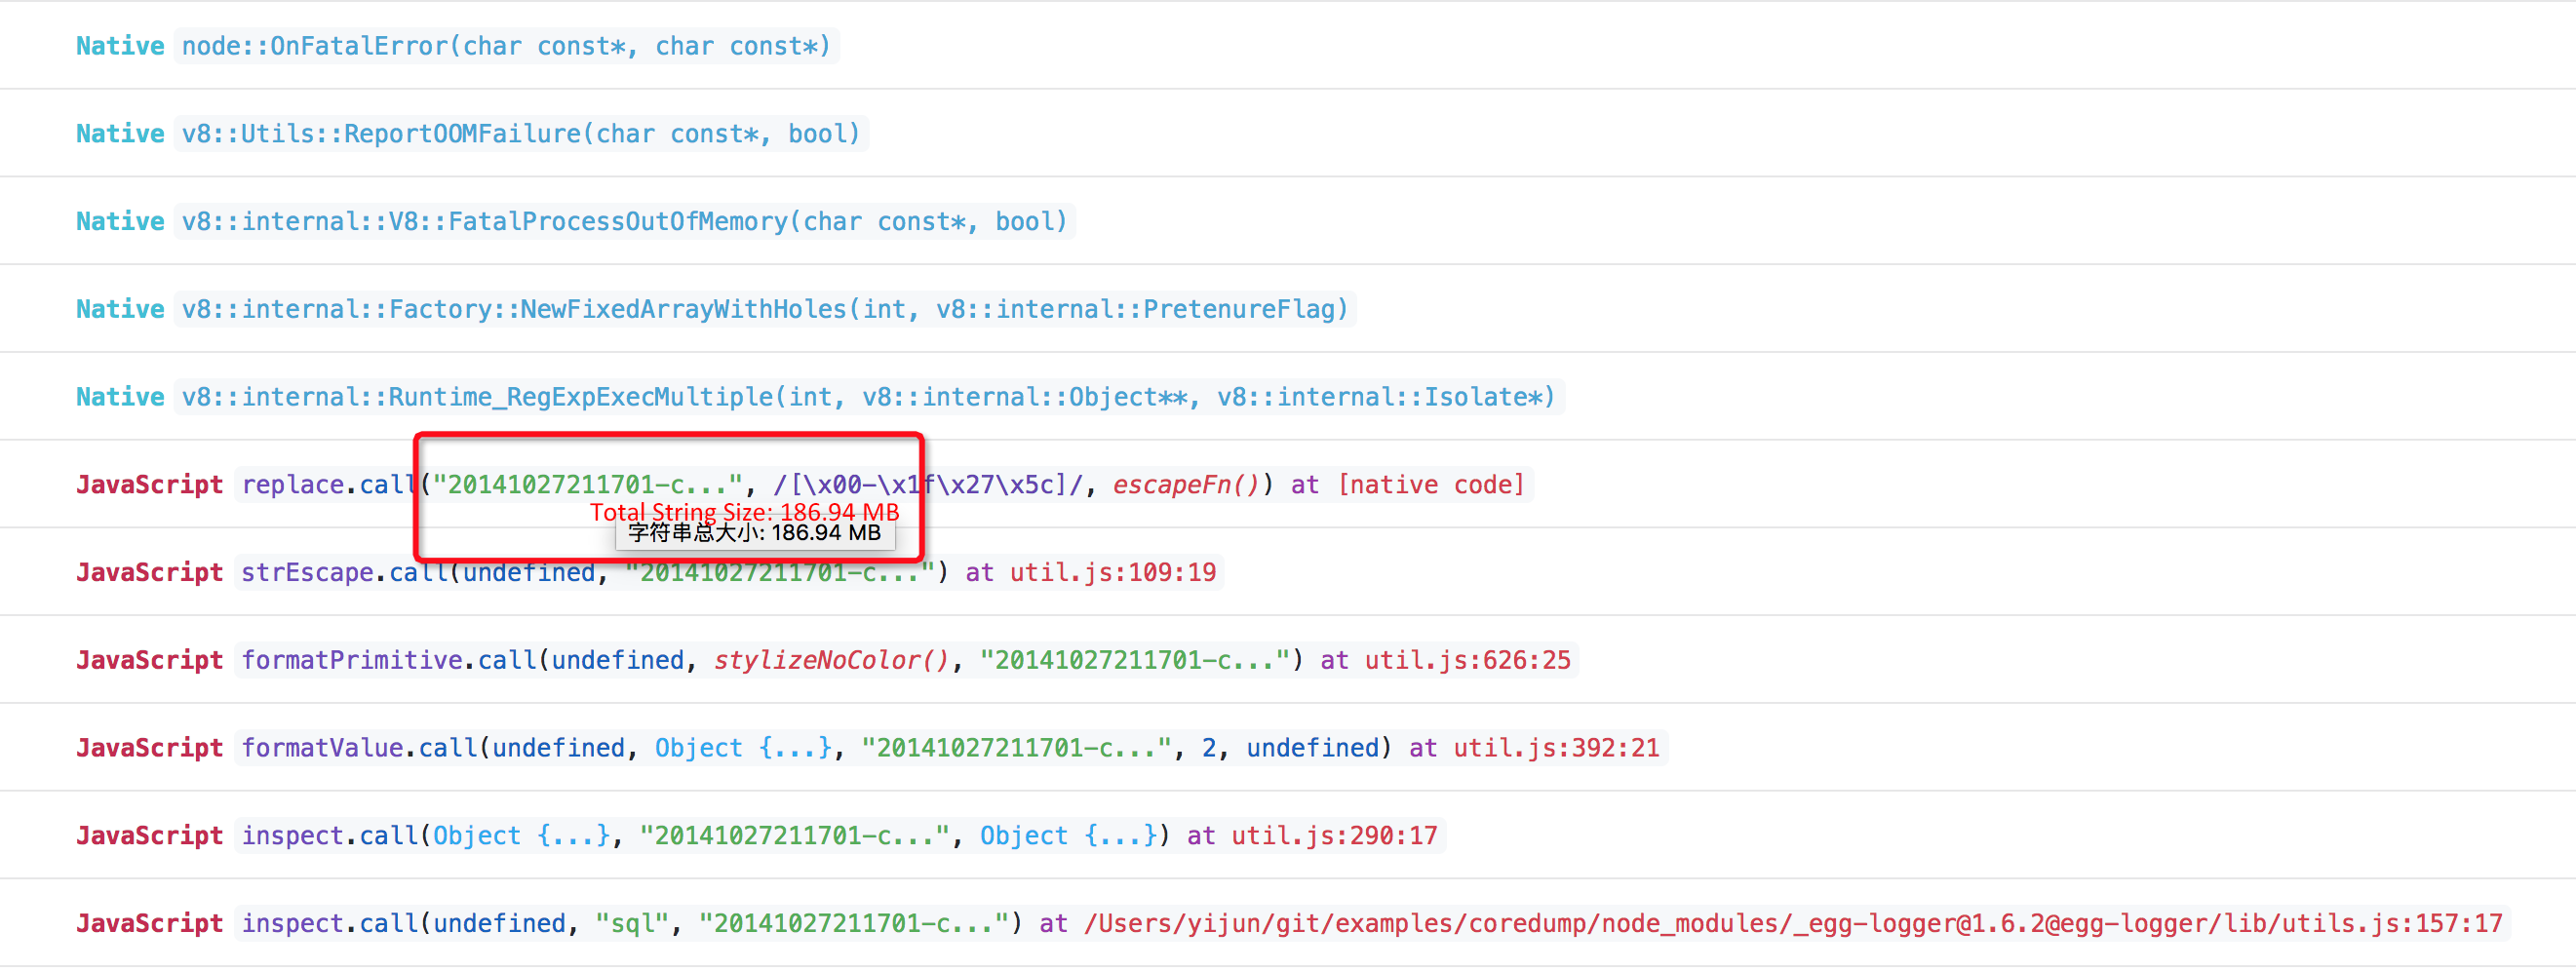
In this example, the 186 MB string causes OOM during inspection. The real online exception described before was caused by the joined SQL statement being too large (about 120 MB). This large string first causes a database operation failure. After this failure, the generated DatabaseError object brings the whole problematic SQL statement to the property, causing a heap memory avalanche when the ctx.logger.error(error) occurs.
Since I started Node.js-related development in 2014, I have written business code and worked on some basic architecture. Now I am committed to more underlying guarantees. Although I am not among the first Node.js developers in China, I have witnessed the development of this young technology, which has faced many doubts. I often hear many people in the community say that Node.js is not stable enough and can only be used to write some script tools, but not large projects.
However, I think that developers should recognize the following:
In this process, Mr. Park Ling set up the Alinode team to focus on protecting thousands of Node applications in Alibaba and solving various Node problems.
We are now at the early stages. We need to fill many gaps and provide more services in the future. If you are interested, send a message and join us!
hyj1991 - June 20, 2019
hyj1991 - June 20, 2019
Alibaba Clouder - November 25, 2019
hyj1991 - June 20, 2019
Alibaba Clouder - August 13, 2020
hyj1991 - June 20, 2019
 Web Hosting Solution
Explore Web Hosting solutions that can power your personal website or empower your online business.
Learn More YiDA Low-code Development Platform
A low-code development platform to make work easier
Learn More mPaaS
mPaaS
Help enterprises build high-quality, stable mobile apps
Learn More Web Hosting
Explore how our Web Hosting solutions help small and medium sized companies power their websites and online businesses.
Learn MoreMore Posts by hyj1991