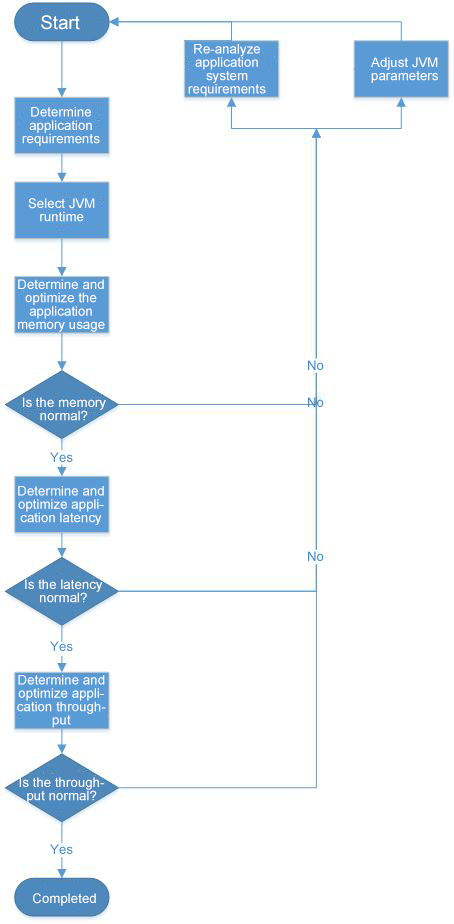
JVM tuning is a systematic and complex task. At present, the automatic adjustment under JVMs is very excellent and basic initial parameters can ensure that common applications runs stably. For some teams, application performance may not take a high priority. In this case, the default garbage collector is usually adequate enough to meet the desired requirement. Tuning should be based on your own situation.
JVM tuning mainly involves optimizing the garbage collector for better collection performance so that applications running on VMs can have a larger throughput while using less memory and experiencing lower latency. As what we said above, less memory/lower latency does not necessarily mean that the less/lower the memory/latency is, the better the performance is. It is about the optimal choice.
Performance Tuning Principles
During the tuning process, the three following principles can help us implement easier garbage collection tuning to meet desired application performance requirements.
JVM tuning involves continuous configuration optimizations and multiple iterations based on the performance test results. Before each desired system metric is met, each of the previous steps may experience multiple iterations. In some cases, to meet a specific metric, the previous parameters may need to be tuned many times, requiring all the previous steps to be tested again.
In addition, tuning generally starts with meeting the memory usage requirement of applications, then latency and throughput. Tuning should follow this sequence of steps. We cannot invert the sequence of these tuning steps.

For the details for each tuning step, please go to How to Properly Plan JVM Performance Tuning.
The application monitoring function of Application Real-Time Monitoring Service (ARMS) provides the Java Virtual Machine (JVM) monitoring function. It monitors heap metrics, non-heap metrics, direct buffer metrics, memory-mapped buffer metrics, garbage collection (GC) details, and the number of JVM threads. This topic describes the JVM monitoring feature and how to monitor JVM metrics.
Multiple consumers are started on different JVMs. For consumer instances under the same group ID, different topics are configured, or topics are the same but tags are different. As a result, the subscription relationships are inconsistent, and messages do not meet the expectations.
When the same group ID is used to start multiple consumer instances on different JVMs, ensure that the topics and tags configured for these consumer instances are consistent.
Data centers have become the standard infrastructure for supporting large-scale Internet services. As they grow in size, each upgrade to the software (e.g. JVM) or hardware (e.g. CPU) becomes costlier and riskier. Reliable performance analysis to assess the utility of a given upgrade facilitates cost reduction and construction optimization at data centers, while erroneous analysis can produce misleading data, bad decisions, and ultimately huge losses.
This article introduces the challenges and practices of performance monitoring and analysis of Alibaba's large-scale data center.
For example, we might observe different performance influences of a JVM feature on different Java applications and different performance results of the same application on difference hardware. Cases like this are far from uncommon. Since it is infeasible for us to run tests for every application and every piece of hardware, we need a systematic approach to estimating the overall performance impact of a new feature on various applications and hardware.
Nowadays, open-source big data frameworks (such as Hadoop, Spark and Storm) all employ JVM, and Flink is one of them. JVM-based data analysis engines all need to store a large amount of data in the memory, so they have to address the following JVM issues:
Therefore, an increasing number of big data projects choose to manage JVM memory on their own, such as Spark, Flink, and HBase, with an aim to achieve as high performance as the C language and prevent the OOM error. This article introduces the measures Flink adopts to address the above-mentioned issues, including memory management, customized serialization tool, buffer-friendly data structures and algorithms, off-heap memory and JIT compilation optimization.
Application Real-Time Monitoring Service (ARMS) is an end-to-end Alibaba Cloud monitoring service for Application Performance Management (APM). You can quickly develop real-time business monitoring capabilities using the frontend monitoring, application monitoring, and custom monitoring features provided by ARMS. You can also monitor the Java Virtual Machine (JVM) with ARMS.
Alibaba Cloud Elastic Compute Service (ECS) provides fast memory and the latest Intel CPUs to help you to power your cloud applications and achieve faster results with low latency. All ECS instances come with Anti-DDoS protection to safeguard your data and applications from DDoS and Trojan attacks.
How to Deploy a LEMP Stack on CentOS with Alibaba Cloud Starter Package

2,593 posts | 793 followers
FollowAlibaba Clouder - June 20, 2017
OpenAnolis - January 26, 2026
Alibaba Clouder - April 8, 2019
Alibaba Cloud Community - May 9, 2024
Data Geek - May 9, 2023
Apache Flink Community China - August 22, 2023

2,593 posts | 793 followers
Follow Realtime Compute for Apache Flink
Realtime Compute for Apache Flink offers a highly integrated platform for real-time data processing, which optimizes the computing of Apache Flink.
Learn MoreMore Posts by Alibaba Clouder