By Zhang Cheng, nicknamed Yuanyi at Alibaba.
Independently developed by the Apsara team, Alibaba Cloud Log Service serves more than 30,000 customers both on and off the cloud and also provides the computing infrastructure needed for processing log data on several of Alibaba Group's e-commerce platforms including Taobao. Log Service withstood the huge traffic spikes seen during the Double 11 Shopping Festival, the world's largest online shopping event, as well as the smaller Double 12 Shopping Festival, and several online promotions during Chinese New Year over the past several years.
During 2019's Double 11 Shopping Festival, Log Service served more than 30,000 applications on Alibaba's e-commerce platforms and various other online systems, serving a lot of 15,000 unique customers. The peak rate during the event was 30 TB/min, with the peak rate per cluster being 11 TB/min, the peak rate per log being 600 GB/min, and the peak rate per business line being 1.2 TB/min. Besides these amazing feats, Log Service also supported the full migration of logs to the cloud form Alibaba's core e-commerce business operations, as well as Alibaba's marketing platform Alimama, financial services hub Ant Financial, smart logistics network Cainiao, smart groceries brand Hema Fresh, community video platform Youku, mobile map and navigation platform Amap, and other teams to the cloud. Log Service seamlessly interoperated with more than 30 data sources and more than 20 data processing and computing systems, shown below.
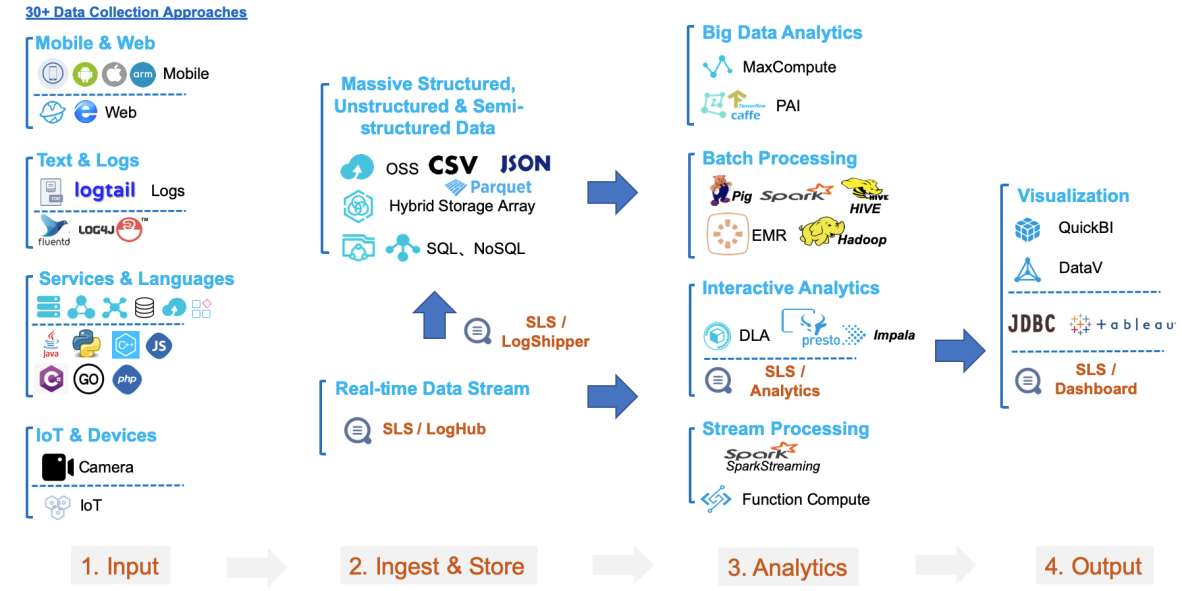
Operating under this large business volume and user scale, Log Service proved its robust functions, superior experience, and high stability and reliability. Thanks to the unique environment and challenges of the Alibaba's various services and e-commerce platforms, our team of engineers and developers have continuously tested and refined Log Service and related technologies over the past five years.
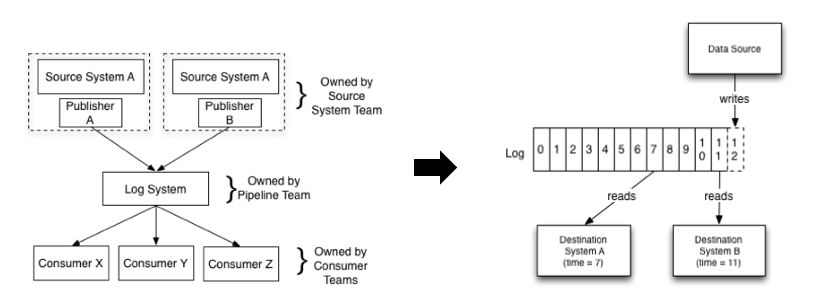
The concept of a data pipeline was proposed by Jay Kreps in 2009. Jay Kreps is an engineer at LinkedIn, the CEO of Confluent, and one of the co-creators of Apache Kafka. In his article "The Log: What every software engineer should know about real-time data's unifying abstraction" published in 2012, Jay Kreps stated that pipeline design is intended to:
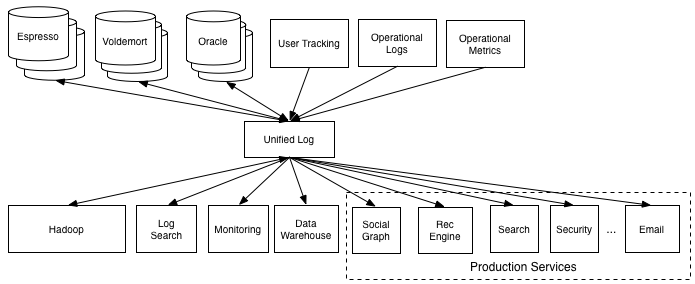
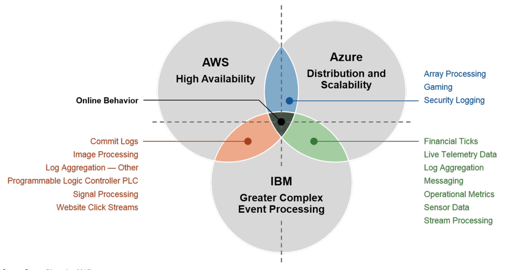
With the emergence of real-time systems, a large number of Apache Kafka products have been developed over several years to solve these two pain points. This promoted the widespread use of Apache Kafka. As enterprises increasingly use data analysis systems, manufacturers have started to provide data pipeline products as services on the Internet. Typical data pipeline services include AWS Kinesis, Azure EventHub, and IBM BlueMix Event Pipeline.
Data pipelines are a type of carrier used to migrate data between systems. They involve such operations as data collection, transmission links, storage queues, consumption, and dumping. In Log Service, LogHub encompasses all functions related to data pipelines. LogHub provides more than 30 data access methods and real-time data pipelines and supports interconnection with downstream systems.
Data pipelines operate at the underlying layer and serve the important businesses of an enterprise during the digitization process. This requires data pipelines to be reliable, stable, and able to ensure smooth data communication and flexibly deal with traffic changes.
Now, let's take a look at the challenges we have encountered over the past five years.
The pipeline concept is simple. A pipeline prototype can be written in just 20 lines of code.
In reality, it is challenging to maintain a pipeline that serves tens of thousands of users with tens of billions of reads and writes and processes dozens of petabytes of data every day. For example:
The following describes how to develop pipelines to deal with the preceding situations.
The first version of Log Service supported data sources that were log files in the Apsara format. Support has been added for more data sources over the past five years, such as SDKs in various languages, mobile terminals, embedded chips, Internet of Things (IoT) devices, and cloud-native environments.
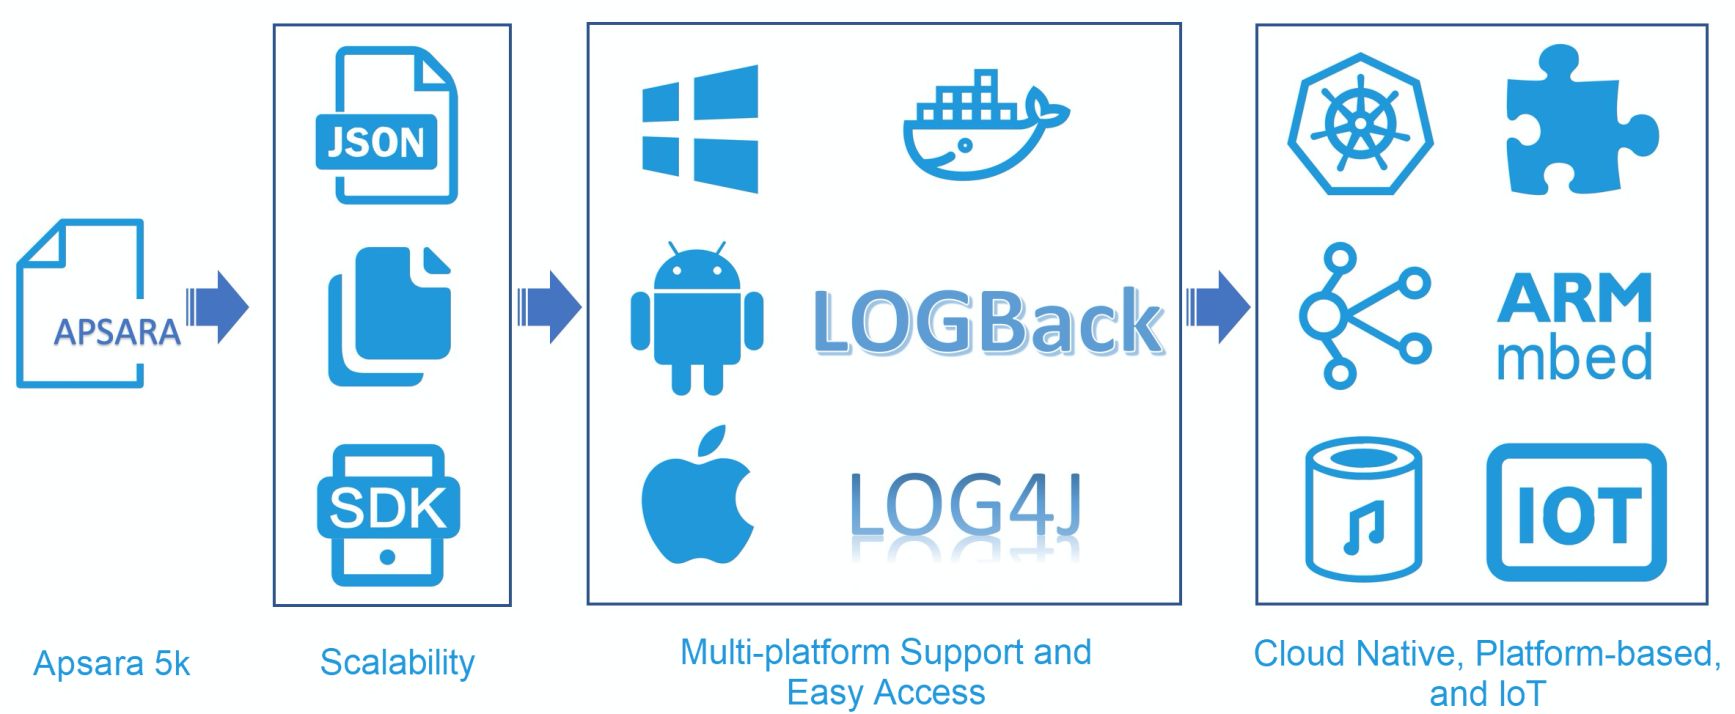
Log Service originated from the Apsara project of Alibaba Cloud. At that time, Apsara provided a basic log module, which was used by many systems to print logs. Therefore, we developed Logtail to collect Apsara logs. Logtail was initially an internal tool of the Apsara system.
To adapt to the use habits of non-Alibaba Cloud teams, we extended Logtail to support general log formats, such as regular expressions, JSON, and delimiters. For applications that do not want to integrate Logtail, we provide SDKs in various languages to integrate the code for log uploading.
With the rise of the smartphone and the mobile Internet, we have developed SDKs for mobile terminals that use the Android and iOS operating platforms to enable fast log access. At the same time, Alibaba began to transform microservices and launched Pouch, which is compatible with Logtail. We provide the Log4J and LogBack appenders for Java microservices, as well as the direct data transmission service.
We also adapted log access modes to clients that use the Advanced RISC Machine (ARM) platform, embedded systems, and systems developed in China.
In early 2018, we added the plugin function to Logtail to meet the diverse requirements of our users. Users can extend Logtail by developing plugins to implement custom functions. Logtail also supports data collection in emerging fields, such as cloud native, smart devices, and IoT.
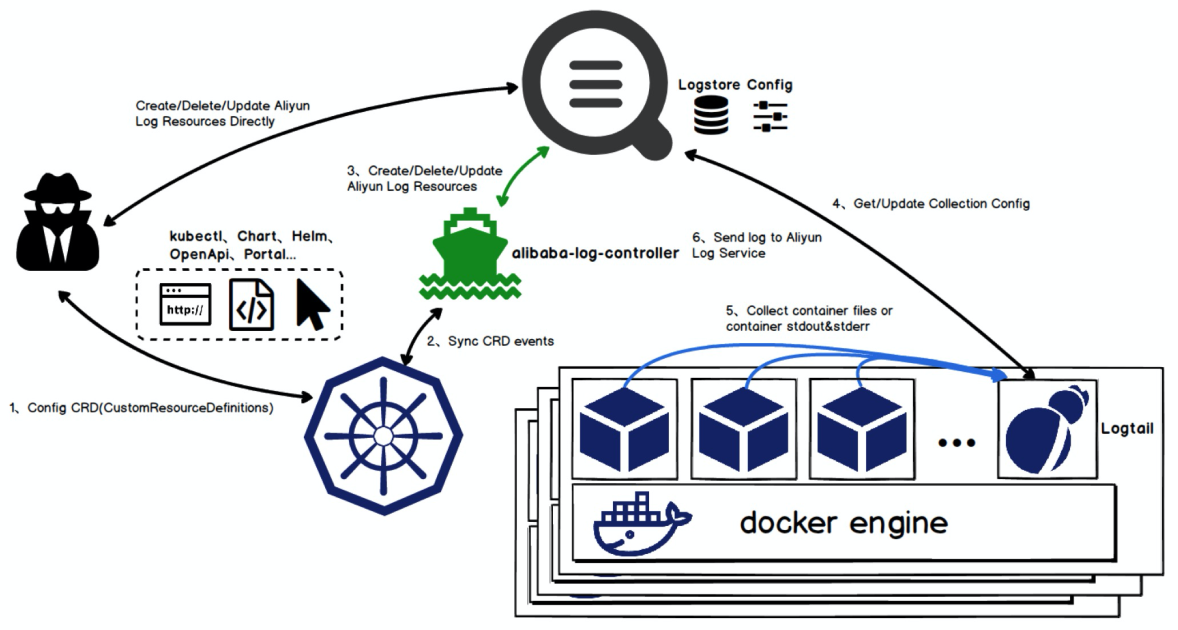
With the implementation of cloud native, Logtail has fully supported data collection in Kubernetes since the beginning of 2018. It provides CustomResourceDefinition (CRD) to integrate logs and Kubernetes systems. Currently, this solution is applied to thousands of clusters in Alibaba Group and on the public cloud.
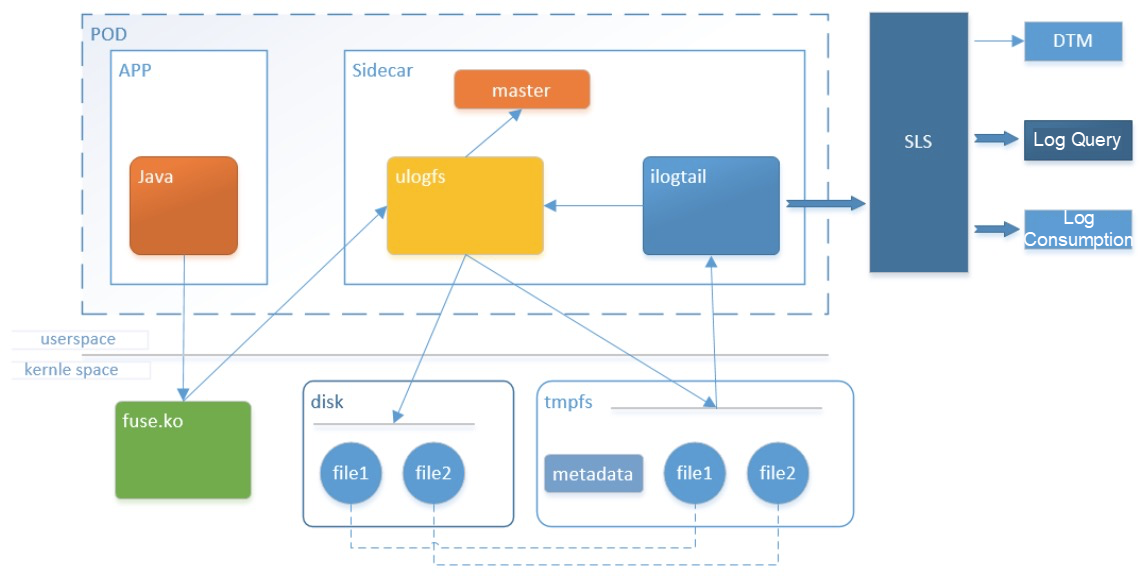
In Alibaba's highly virtualized scenarios, a physical machine may run hundreds of containers. In conventional log collection, logs are flushed into a disk. This intensifies the contention for the disk resources of physical machines, affects the log write performance, and indirectly affects the response time of applications. Each physical machine reserves disk space to store the logs of each container, causing serious resource redundancy.
Therefore, we cooperated with the systems department of Ant Financial to develop a diskless log project to virtualize a log disk for applications based on a user-state file system. The log disk is directly connected to Logtail through the user-state file system and logs are directly transferred to Log Service. This accelerates the log query speed.
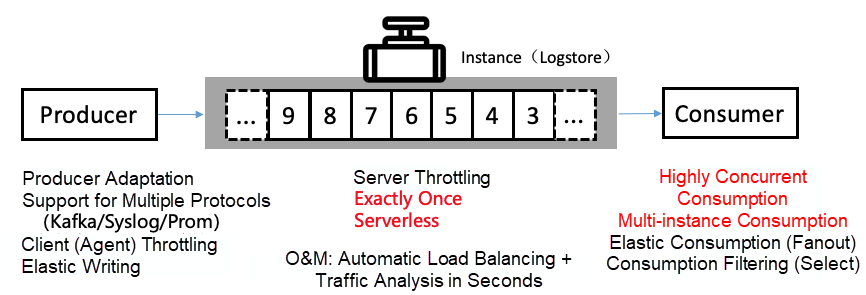
The Log Service servers support HTTP-based writing and provide many SDKs and agents. However, there is still a huge gap between the server and data sources in many scenarios. For example:
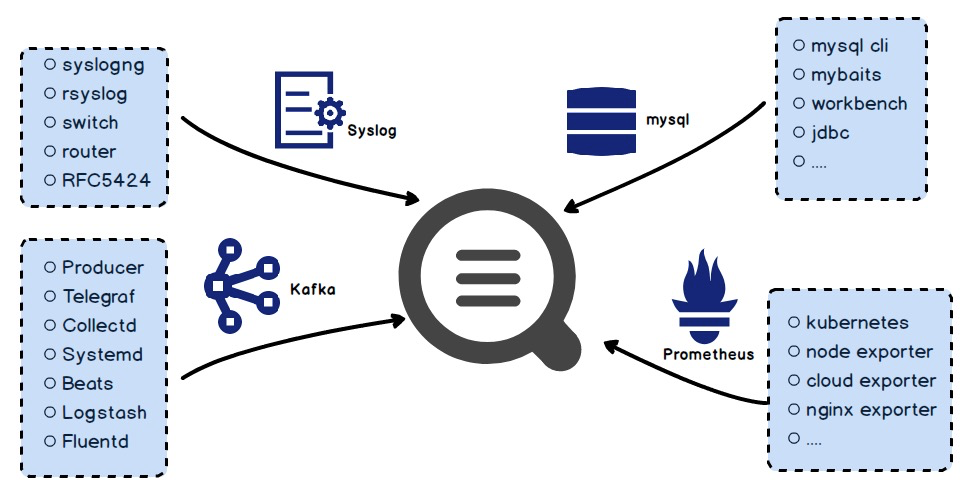
We have launched a general protocol adaptation plan to enable compatibility between Log Service and the open-source ecosystem, including the Syslog, Apache Kafka, Prometheus, and JDBC protocols, in addition to HTTP. As such, a user's existing system can access Log Service simply by modifying the write source. Existing routers and switches can be configured to directly write data to Log Service, without proxy forwarding. Log Service supports many open source collection components, such as Logstash, Fluentd, and Telegraf.
In 2017, we had to deal with multitenancy throttling on single-host agents. For example:
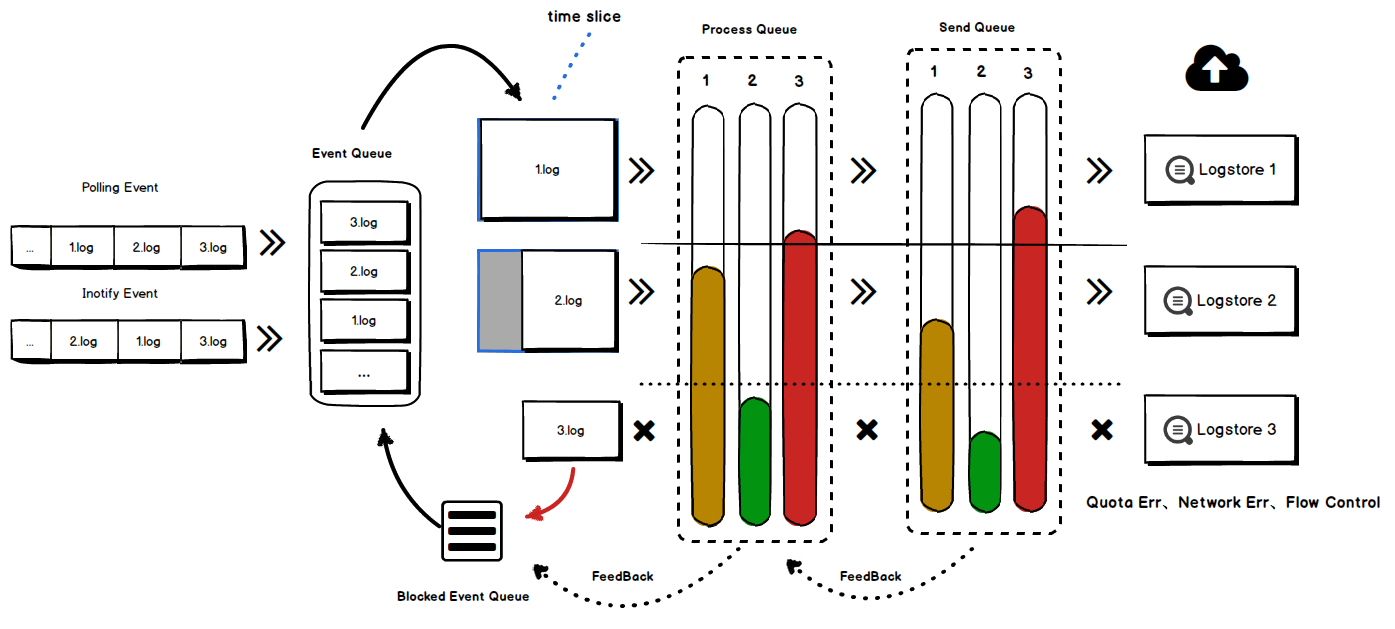
We optimized the Logtail agent to improve multitenancy isolation:
Logtail has been continuously optimized to guarantee fair distribution to multiple data sources (tenants) on a single host.
The Log Service servers support throttling through back pressure at the project and shard levels to prevent a single abnormal instance from affecting other tenants at the access layer or backend service layer. We developed the QuotaServer module to provide project-level global throttling and shard-level throttling. This ensures tenant isolation and second-level synchronous throttling among millions of tenants and prevents cluster unavailability due to traffic penetration.
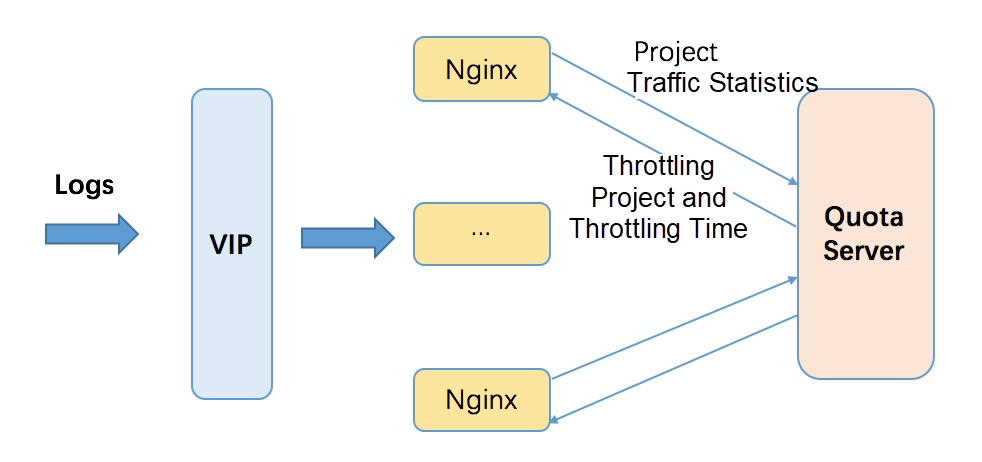
Project-level global throttling is intended to limit a user's overall resource usage. It allows frontends to deny excessive requests to prevent cluster crashes when the traffic of user instances reaches the backend. Shard-level throttling implements fine-grained throttling with clearer semantics and better control.
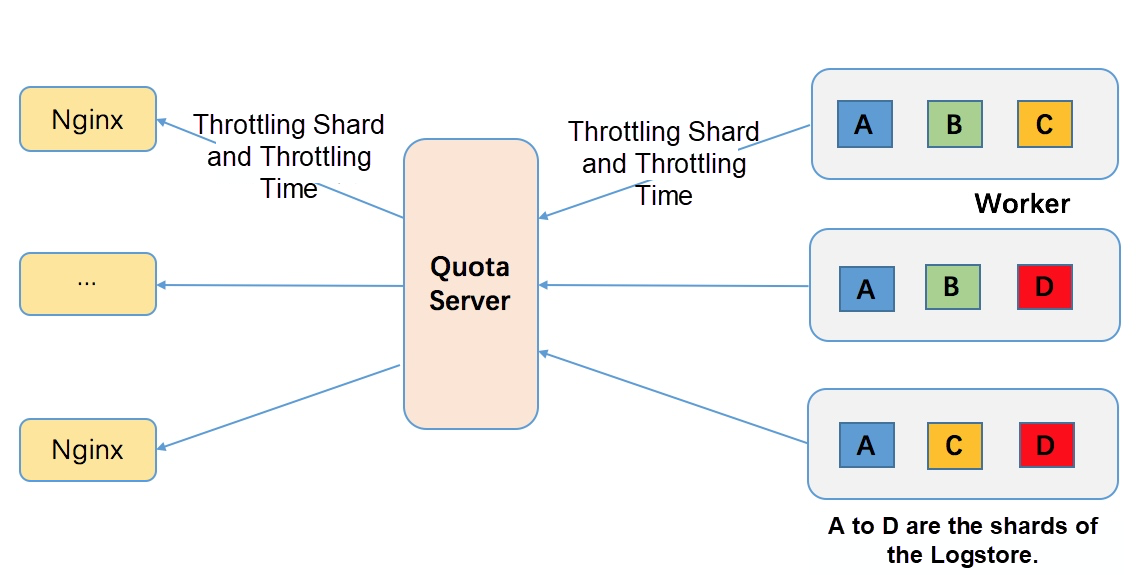
Shard-level throttling provides the following benefits:
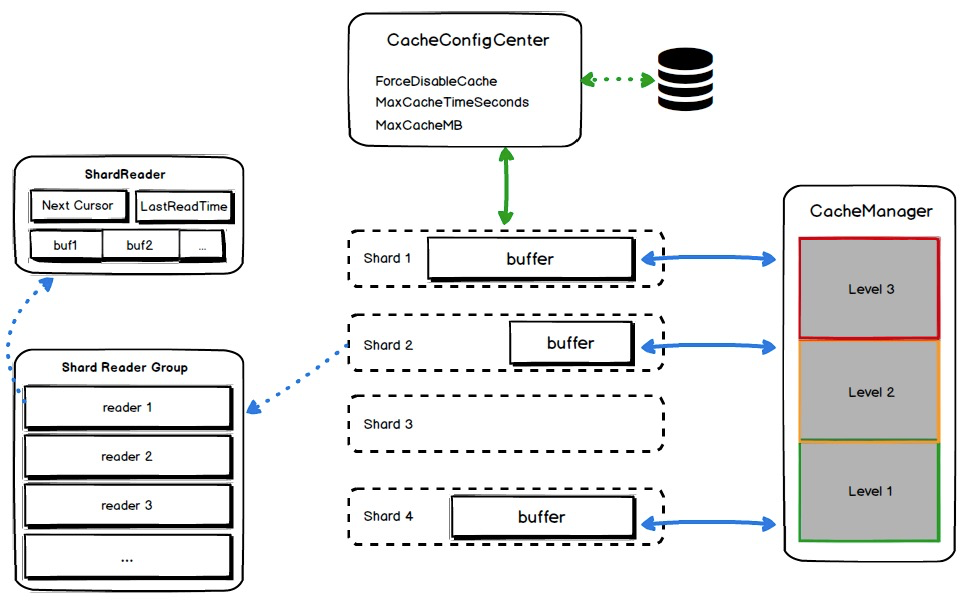
To solve the log consumption problem, we need to consider specific scenarios. Log Service serves as a real-time pipeline and most consumption scenarios involve real-time consumption. Log Service provides a cache layer for consumption scenarios, but the cache policy is simple. As consumers increase and the data volume expands, the cache hit ratio decreases and the consumption latency increases. The cache module was redesigned as follows:
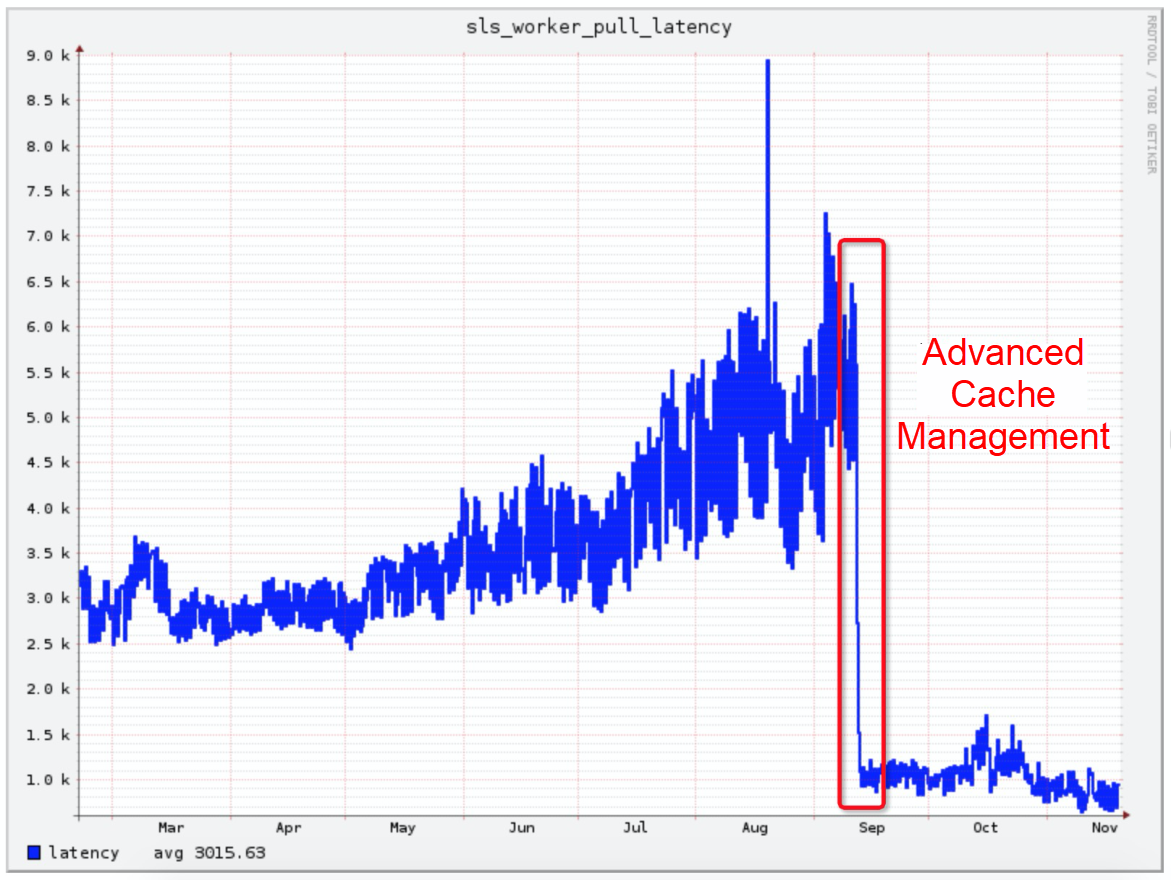
After the preceding optimizations were implemented, the average log consumption latency of clusters was reduced from 5 milliseconds to less than 1 millisecond, effectively reducing the data consumption pressure during the Double 11 shopping Festival.
With the emergence of microservices and cloud native, applications are increasingly fine-grained, the entire process becomes more complex, and more logs of diverse types are generated. In addition, logs have become increasingly important. The same log may be consumed by several and even a dozen of businesses.
Using traditional collection methods, the same log may be repeatedly collected dozens of times. This wastes many client, network, and server resources.
Log Service prevents the repeated collection of the same file. After logs are collected to Log Service, users are provided with ConsumerGroup for real-time consumption. However, Log Service's data consumption mode encounters the following two problems as more logs types are used in a wide variety of scenarios:
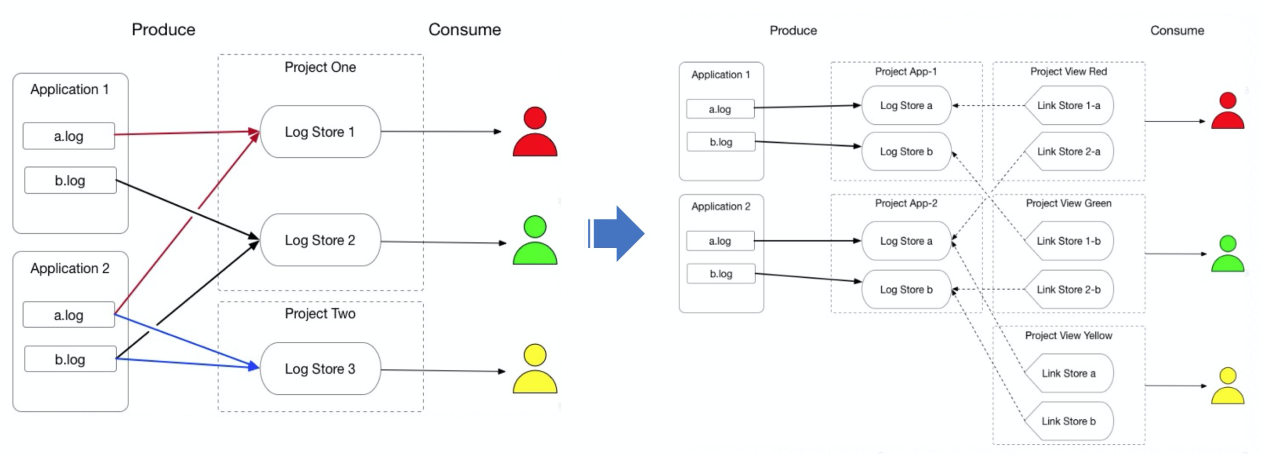
In response to resource mapping and permission ownership management in scenarios with specific log types, we cooperated with the log platform team at Ant Financial to develop the view consumption mode based on the view concept of databases. The resources of different users and Logstores can be virtualized into a large Logstore. Therefore, users only need to consume logs from a virtual Logstore, whose implementation and maintenance are transparent to users. The view consumption mode has been officially launched in Ant Financial clusters. Currently, thousands of instances run in view consumption mode.
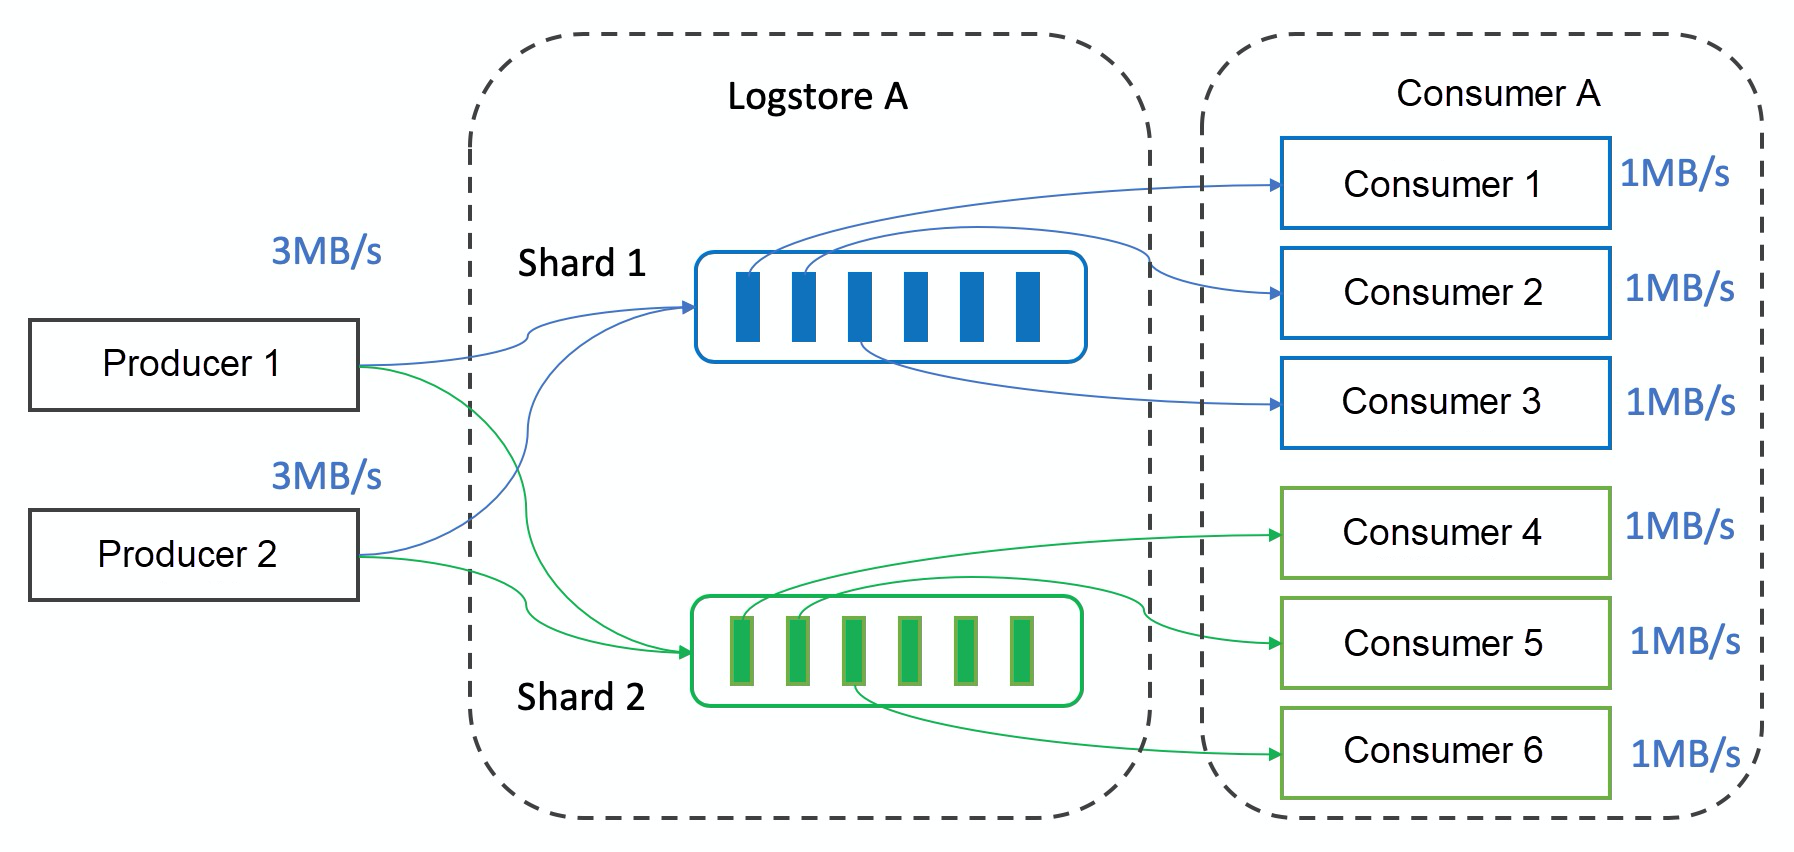
To improve the capabilities of single consumers, we enhanced ConsumerGroup and developed the Fanout consumption mode. In this mode, data in a shard can be processed by multiple consumers. Shards are decoupled from consumers to solve the capability mismatch between producers and consumers. Consumers do not need to concern themselves with checkpoint management, failover, and other details, which are managed by the Fanout consumer group.
The external service-level agreement (SLA) of Log Service promises 99.9% service availability and actually provides more than 99.95%. At the beginning, it was difficult for us to reach this level of service availability. We received many alerts every day and were often woken up by phone calls at night. We were tired of handling various problems. There were two main reasons for our difficulties.
1. Hotspot: Log Service evenly schedules shards to each worker node. However, the actual load of each shard varies and changes dynamically over time. Some hotspot shards are located on the same instance, which slows down request processing. As a result, requests may accumulate and exceed the service capability.
2. Time-consuming problem locating: Online problems are inevitable. To achieve 99.9% reliability, we must be able to locate problems in the shortest time and troubleshoot them in a timely manner. It takes a long time to manually locate problems even with the help of extensive monitoring and logs.
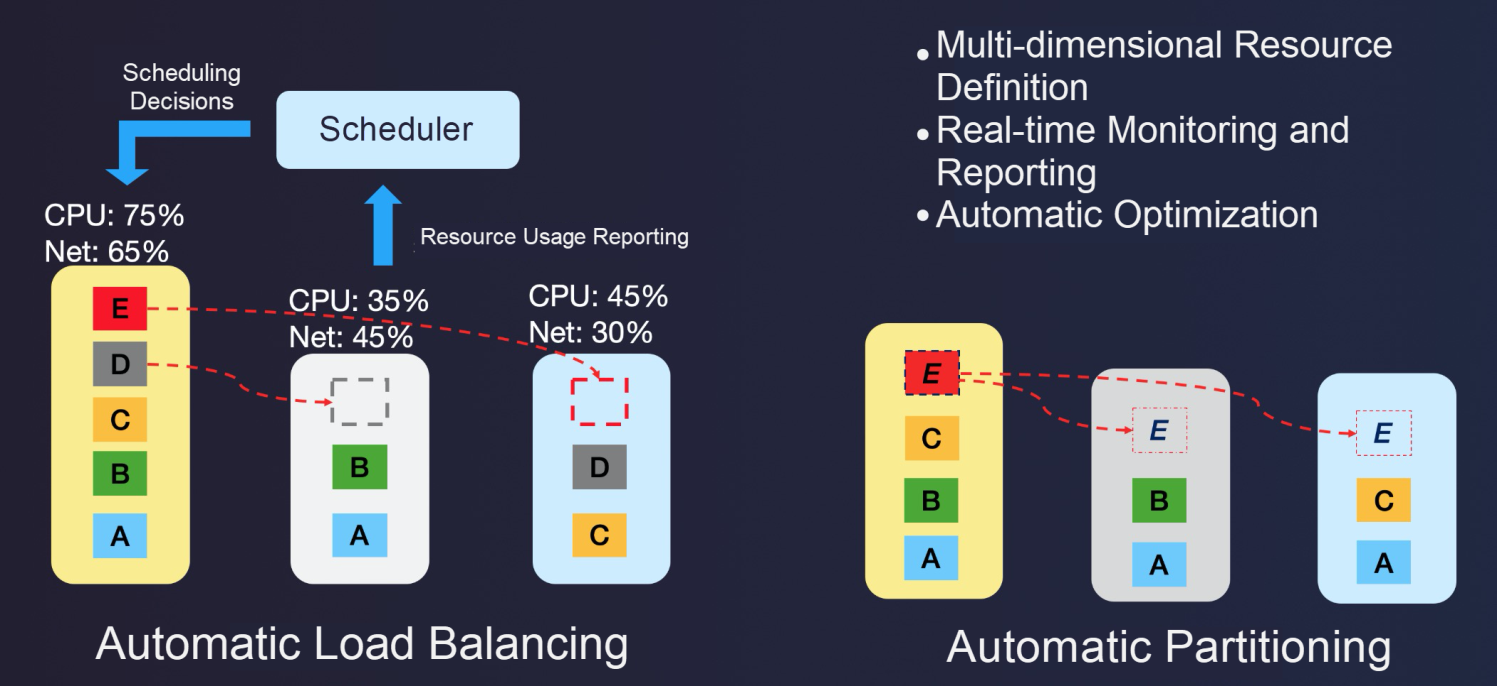
To address the hotspot problem, we added a scheduling role in the system, which automatically makes adjustments to eliminate hotspots after real-time data collection and statistics. The following two methods are used:
We also consider special scenarios such as the negative impacts of traffic spikes, heterogeneous models, concurrent scheduling, and migration, which are not described here.
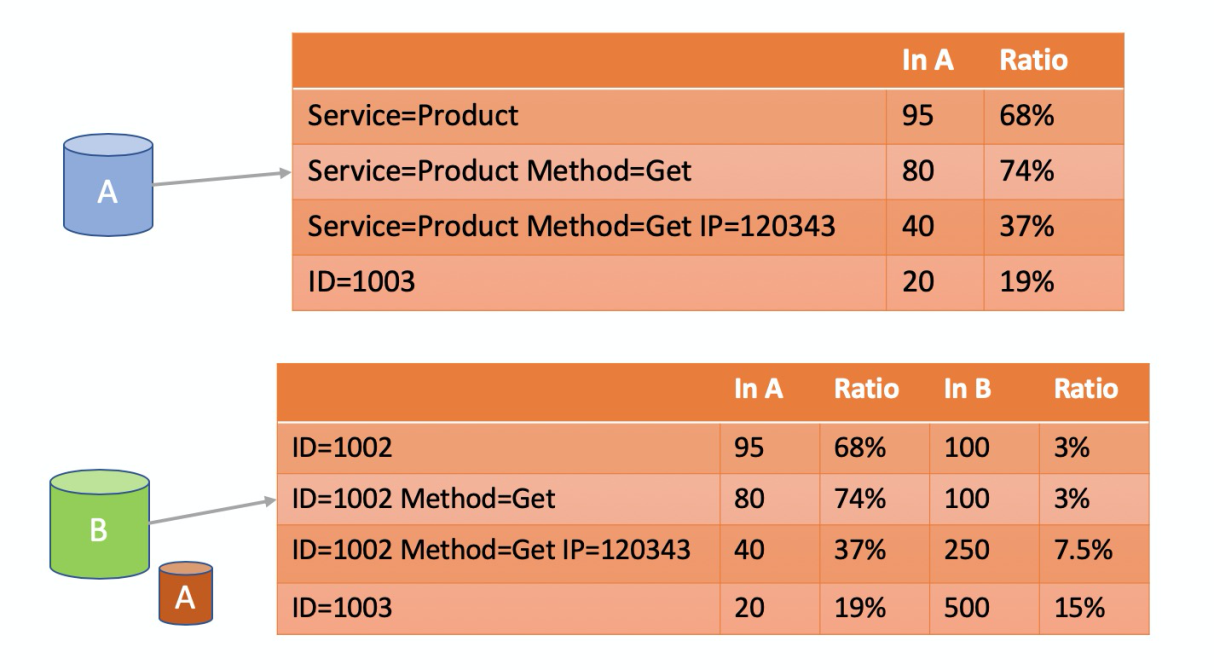
Currently, Log Service collects thousands of real-time metrics online, with hundreds of billions of access logs per day. Therefore, it is difficult to perform manual investigation when problems occur. We developed cause analysis algorithms to quickly locate the dataset most relevant to exceptions through frequent patterns and differential patterns.
In this example, the access dataset with an error with a HTTP status code of a format of 500 range is defined as abnormal Dataset A. 90% of the requests found in this dataset come from ID 1002. Therefore, the current error is related to ID 1002. To reduce misjudgment, we check the proportion of requests from ID 1002 in normal Dataset B with a HTTP status of a format below the 500 range and find that the proportion is low. This further supports the preceding judgment that the current error is highly related to ID 1002.
This method greatly reduces the time required for problem investigation. The root cause analysis results are automatically included when an alert is triggered. This allows us to identify the specific user, instance, or module that causes the problem right away.
To facilitate horizontal scaling, we introduced the concept of shards, similar to Kafka partitions, allowing users to scale resources by partitioning and merging shards. However, this requires users to understand the concept of shards, estimate the number of shards required for traffic distribution, and manually partition shards to meet quota limits.
Excellent products expose as few concepts as possible to users. In the future, we will weaken or even remove the concept of shards. As such, from the user perspective, after a quota is declared for the data pipeline of Log Service, we will provide services based on the quota. As a result, the internal shard logic will be completely transparent to users, making the pipeline capability truly elastic.
Like Apache Kafka, Log Service currently supports At-Least-Once writing and consumption. However, many core scenarios such as transactions, settlement, reconciliation, and core events require Exactly-Once writing and consumption. For many services, we have to encapsulate the deduplication logic at the upper layer to implement the Exactly-Once model. This is expensive and consumes a great deal of resources.
Soon we will support the semantics of Exactly-Once writing and consumption, together with the capabilities of ultra-high traffic processing and high concurrency.
Similar to Apache Kafka, Log Service supports full consumption at the Logstore level. Even if the business only needs a portion of the data, it must consume all the data during this period. All data must be transmitted from the server to the compute node for processing. This method wastes a lot of resources.
In the future, we will push down computing to the queue, where invalid data can be directly filtered out. This will greatly reduce the network transmission of invalid data and upper-layer computing costs.
Are you eager to know the latest tech trends in Alibaba Cloud? Hear it from our top experts in our newly launched series, Tech Show!
Alibaba Cloud Announces New SLA for OSS, up to 99.995% for Cross-zone Redundancy

57 posts | 12 followers
FollowAlibaba Cloud Big Data and AI - October 27, 2025
Apache Flink Community China - September 27, 2020
Alibaba Clouder - July 18, 2018
zjffdu - October 24, 2019
Alibaba Clouder - December 31, 2020
Xiangguang - January 11, 2021

57 posts | 12 followers
Follow Simple Log Service
An all-in-one service for log-type data
Learn More Log Management for AIOps Solution
Log into an artificial intelligence for IT operations (AIOps) environment with an intelligent, all-in-one, and out-of-the-box log management solution
Learn More Black Friday Cloud Services Sale
Get started on cloud with $1. Start your cloud innovation journey here and now.
Learn MoreMore Posts by Alibaba Cloud Storage