By Yemo
Databases are the data core of any enterprise business, and the weak security of database systems has become a source of data leaks and tampering in the traditional environment. Therefore, the imperative is to audit the operation behavior of the database system, especially the audit log of the entire SQL execution record.
Alibaba Cloud Log Service (SLS) cooperates with RDS to launch the RDS SQL audit function, which delivers RDS SQL audit logs to SLS in real time. SLS provides real-time query, visual analysis, alarm, and other functionalities.
RDS SQL audit log records all the operations performed on a database. It obtains the information through the network protocol analysis performed by the system, which consumes minimal CPU resources of the system and does not affect the efficiency of SQL execution. RDS SQL audit log includes, but is not limited to, the following operations:
In addition, SLS also monitors the operation compliance of RDS to detect abnormal configurations of RDS and ensure database security.
At present, there are two ways to collect SLS logs from RDS SQL audit logs.
Advantages:
Disadvantages:
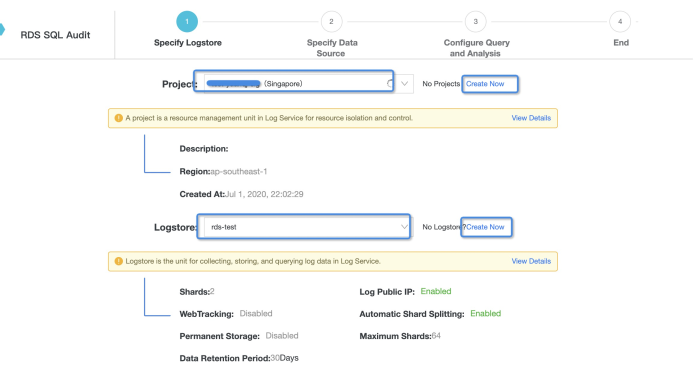
In the "Import Data" area on the home page of the SLS console, select "RDS SQL Audit". The following is an example of ap-southeast-1.

As the collected instance is located in ap-southeast-1, you need to create a new project or select an existing project and logstore in ap-southeast-1.
Note: In this method, you can only collect RDS audit logs in the same region.
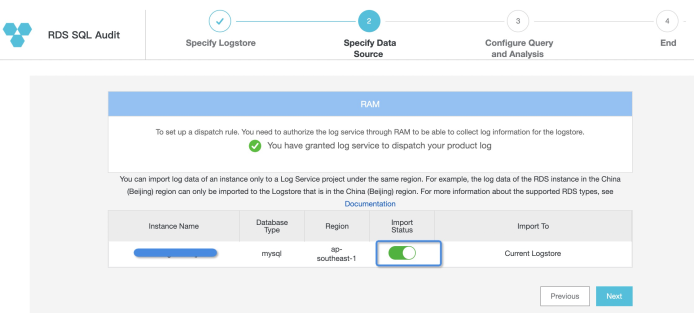
"Specify Data Source" page: You can view all the information of RDS instances in ap-southeast-1. By default, "Import Status" is turned off. After completing the RAM authorization, you can open the "Import Status" button to open the log delivery according to the log collection requirements.
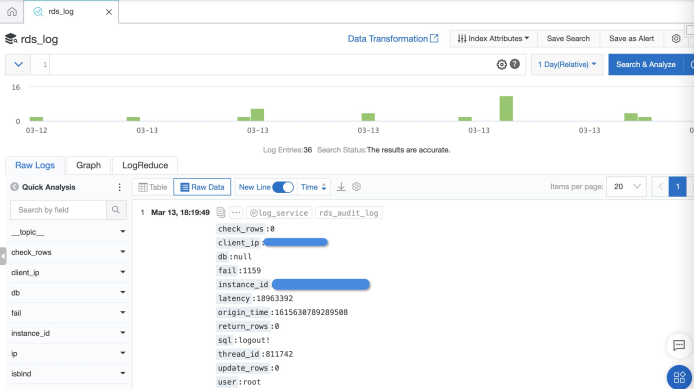
Now the collection of SQL audit logs is completed. You can go to the logstore configured above to view the RDS audit logs.
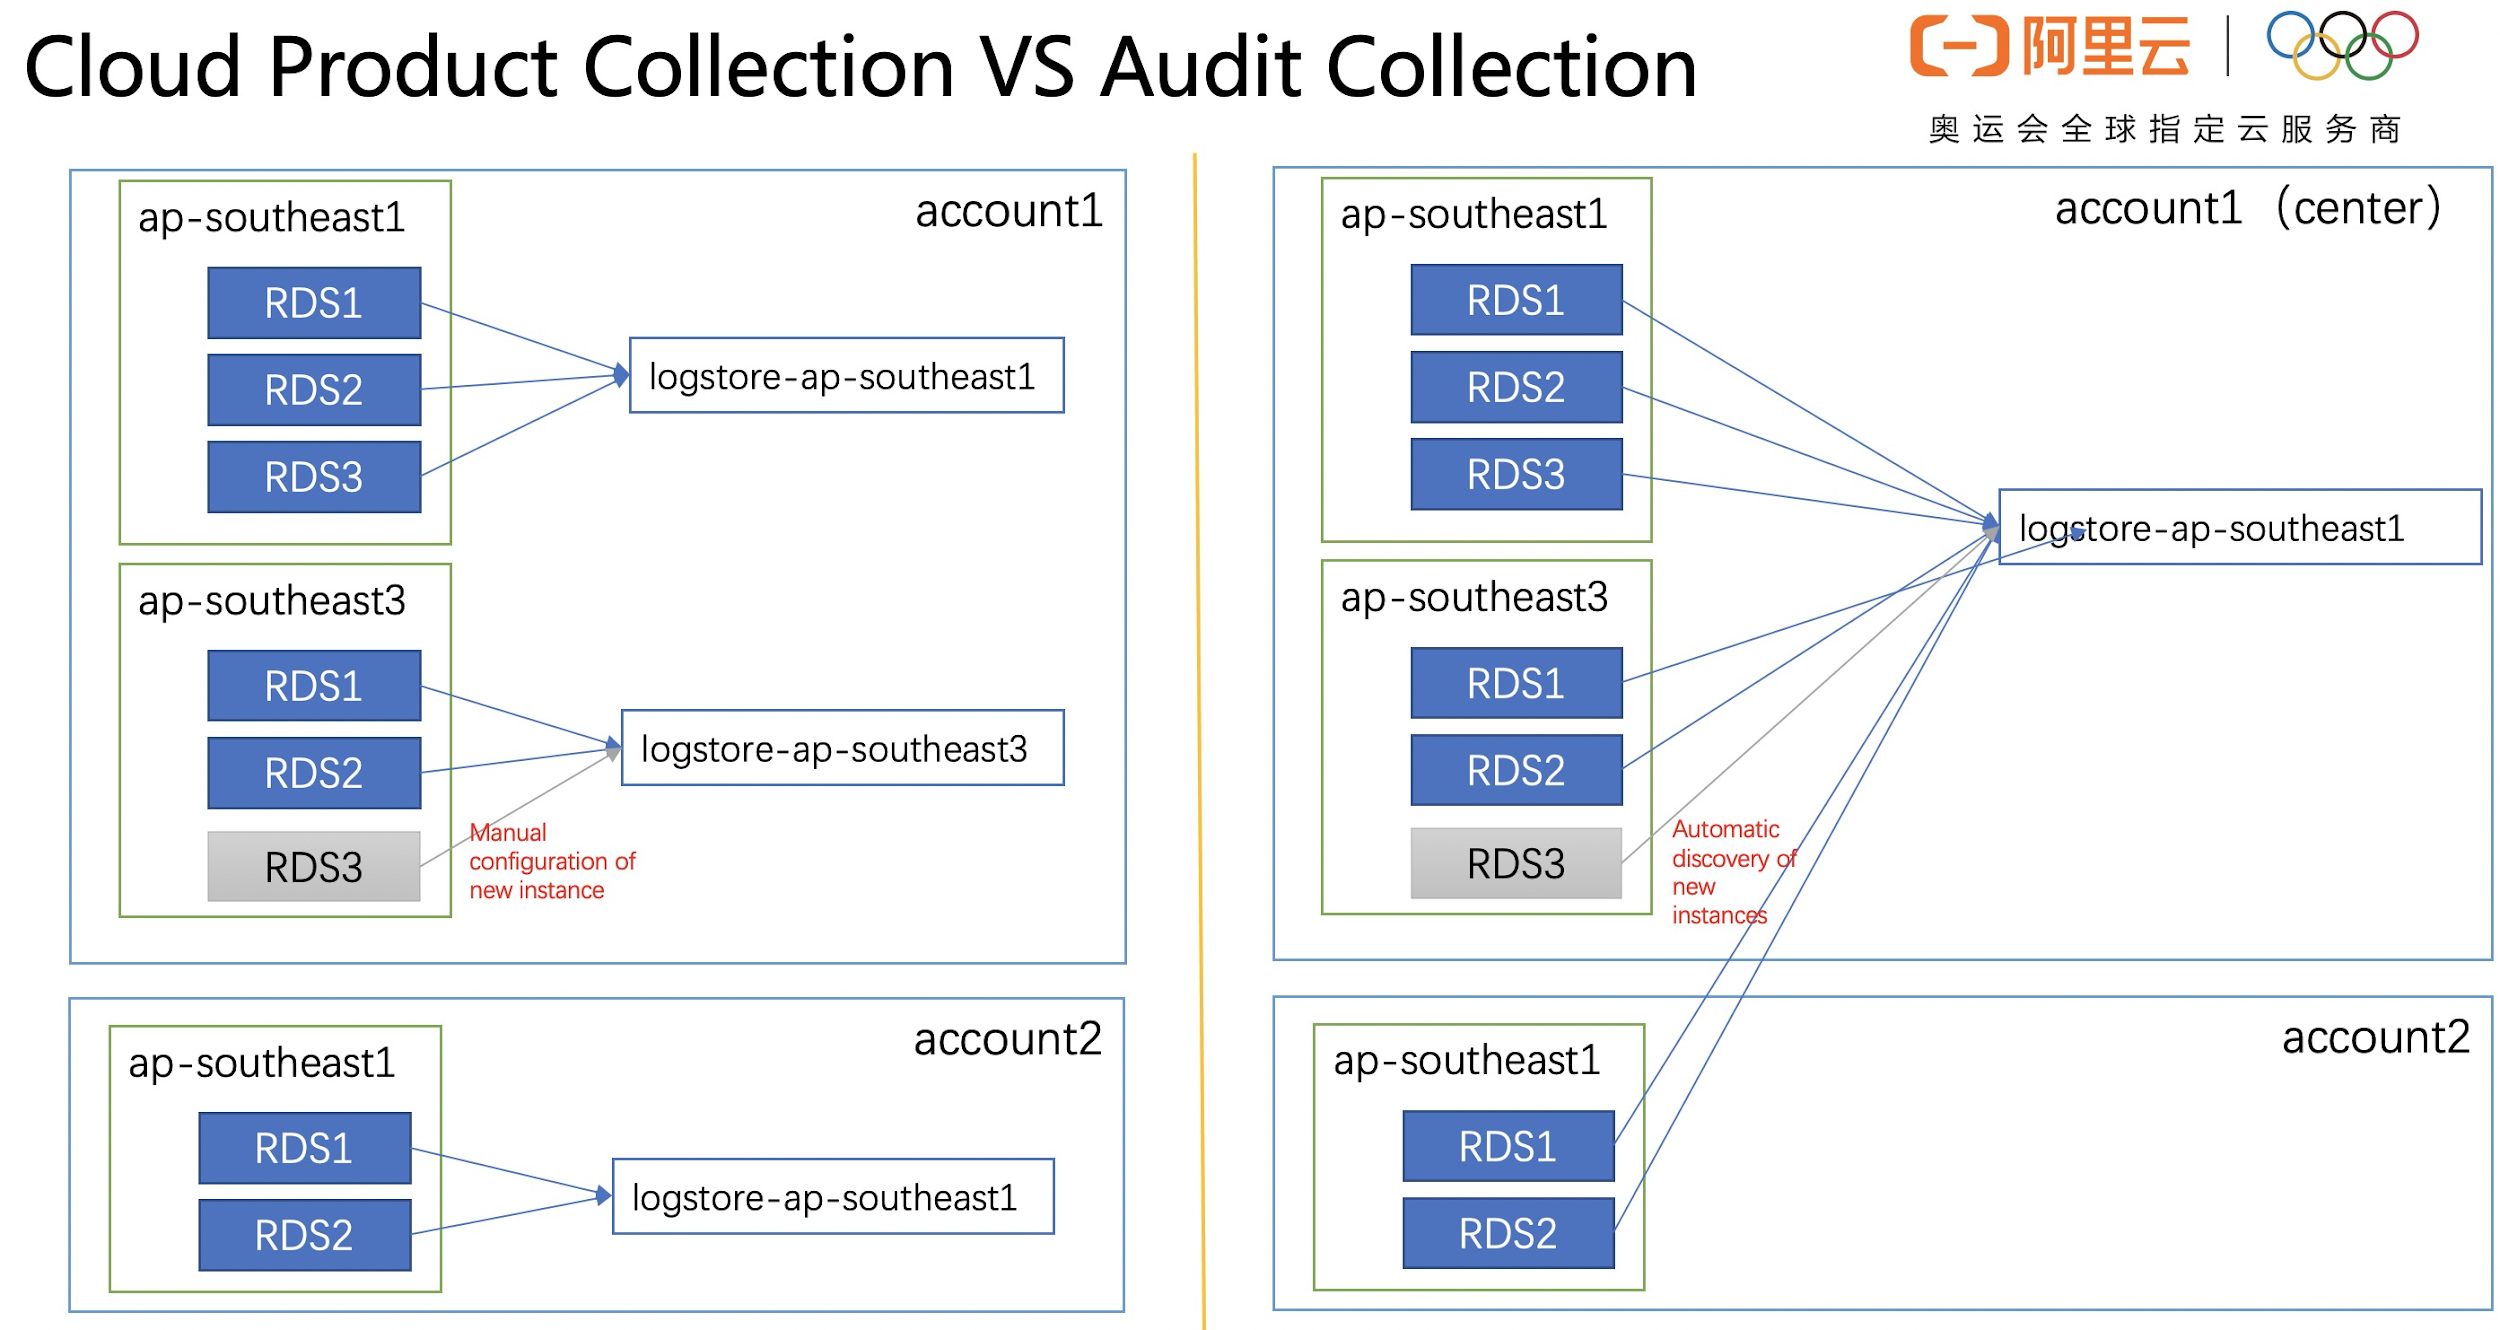
The collection channel of cloud products has the limitation that you can only collect RDS audit logs to the logstore in the same region. In order to break this limitation and realize cross-account and cross-region collection, it is necessary to build data processing tasks for the cross-domain or cross-account.
As self-built data processing tasks need more complex authorization, we will not describe it in detail here. If necessary, please refer to:
The cloud product collection channel only has the advantage of convenient collection in a simple collection scenario. But when dealing with cross-region and cross-account collection, the data synchronization link is long, and a relatively complex authorization process is required. Moreover, when the instance changes (or the new instances are created), you need to maintain the synchronization link manually, leading to high maintenance costs. The audit channel can solve the issues of cross-region, cross-account collection and high maintenance cost of instance change.
We recommend using Alibaba Cloud RAM for user operation. Create an Aliyun RAM user, give the RAM user "aliyunramfullaccess" and "aliyunlogfullaccess" permissions, and create an AK.
Log in to the RAM user and select "Log Audit Service" in the SLS console.

For the first time, you should configure authorization for log collection. Enter the AK created in the first step and select the central project region to store the audit logs.

If the following page appears, the authorization has been completed. After that, you can open the corresponding cloud product logs according to the needs of collecting logs. For example, you need to collect RDS SQL audit logs here.
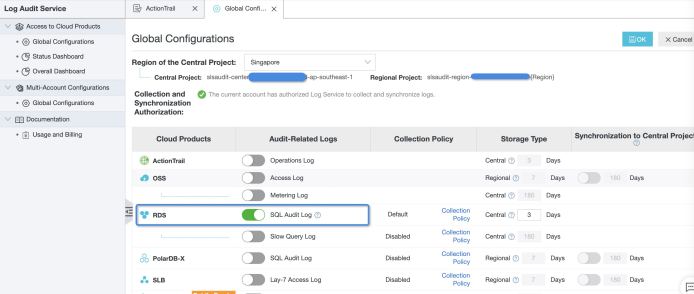
If you require cross-account collection, you can configure multiple accounts for log collection.
This chapter focuses on opening the RDS SQL audit log and managing the log collection scope through the collection policy. The first step to start the SQL audit log is configuring the collection policy. See the collection policy document for a complete syntax description. Here are some common policies.
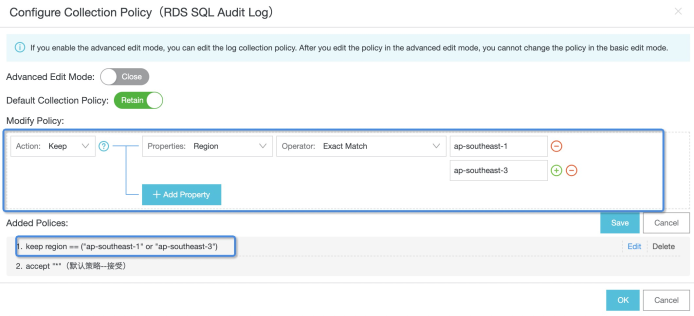
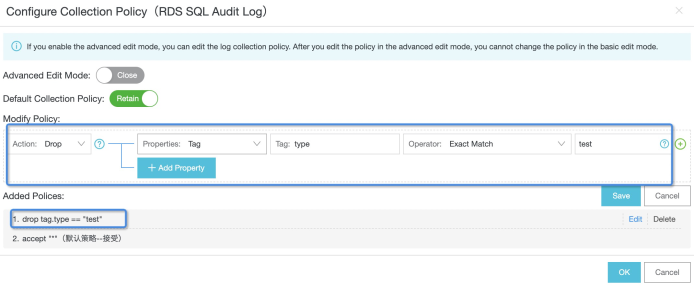
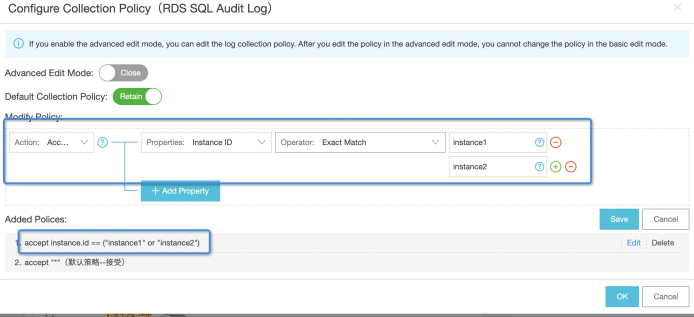
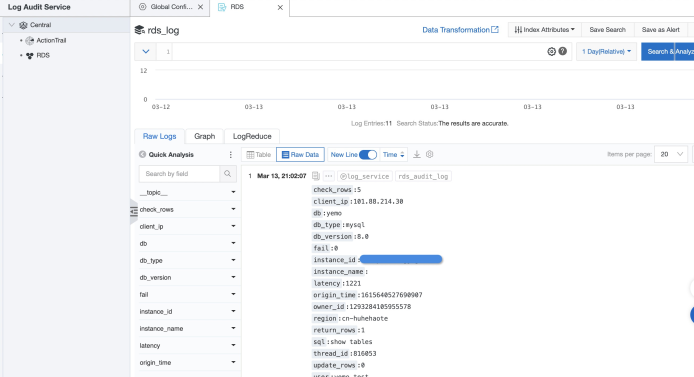
The SQL audit log based on SLS provides three audit reports.
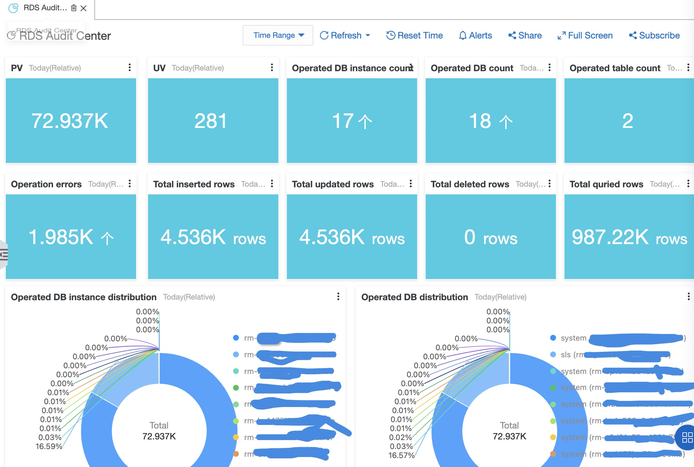
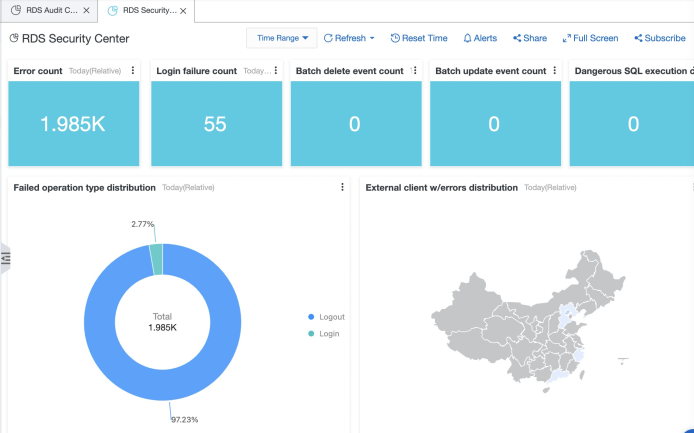
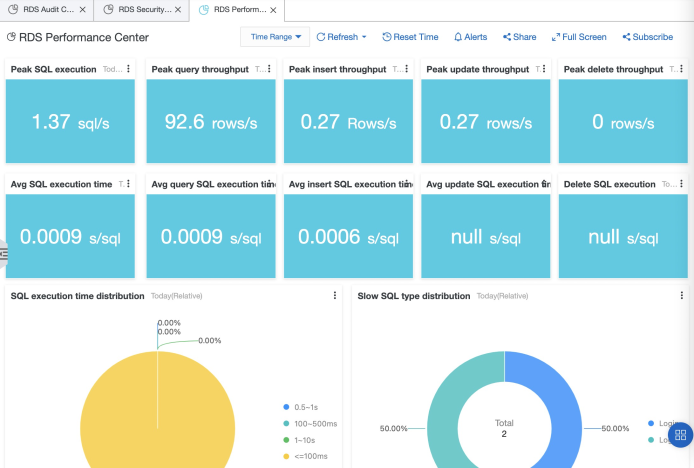
SLS log audit has newly released built-in alarm rules, including 19 built-in rules for RDS SQL audit (which we will expand in the future).
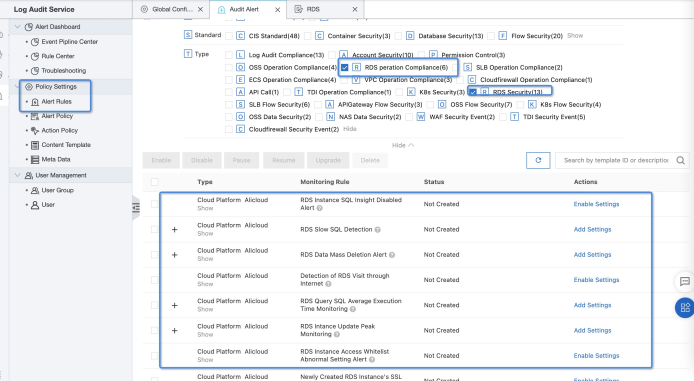
Through "SLS Home Page" —> "Log Audit Service" —> "Audit Alert" on the left side of the console —> "Policy Settings" —> "Alert Rules", you can enter the audit alert rules configuration page. There are two main types of rules:
SQL Audit Rules (RDS Security): These are mainly for SQL execution exception monitoring. For example, slow SQL or batch deletion.
RDS Operation Compliance Rules: Mainly based on CIS rules, they monitor the operation configuration of RDS.
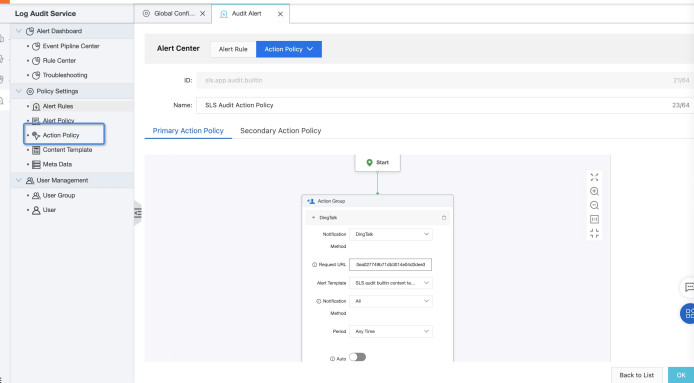
Set up an action policy to send alarm notifications. At present, it supports Ding, mailbox, and other channels.
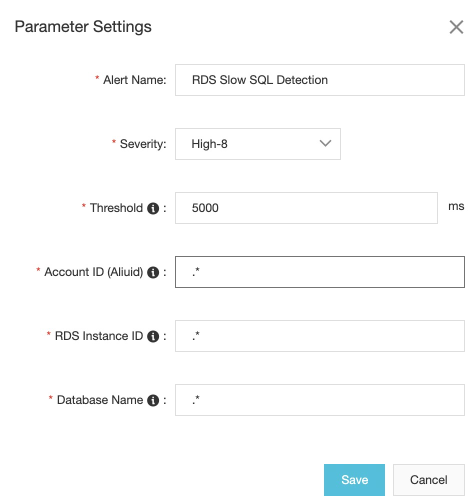
Set alert parameters according to your needs. For example, slow SQL detection threshold, white list, and so on.
# table desc mysql> desc test;
+-----------------+------------------+------+-----+---------+----------------+
| Field           | Type             | Null | Key | Default | Extra          |
+-----------------+------------------+------+-----+---------+----------------+
| id              | int(10) unsigned | NO   | PRI | NULL    | auto_increment |
| title           | varchar(100)     | NO   | MUL | NULL    |                |
| author          | varchar(40)      | NO   |     | NULL    |                |
| submission_date | date             | YES  | MUL | NULL    |                |
+-----------------+------------------+------+-----+---------+----------------+
4 rows inset (0.04 sec)

# mysql> select * from test limit 5;
+----+--------+---------+-----------------+
| id | title  | author  | submission_date |
+----+--------+---------+-----------------+
|  1 | title1 | author1 | 2021-01-12      |
|  2 | title1 | author1 | 2021-01-12      |
|  3 | title1 | author1 | 2021-01-12      |
|  4 | title1 | author1 | 2021-01-12      |
|  5 | title1 | author1 | 2021-01-12      |
+----+--------+---------+-----------------+

# Use index to group by
# mysql> select title, count(1) as cnt from test where submission_date='2021-01-12' group by title;
+--------+-------+
| title  | cnt   |
+--------+-------+
| title1 | 59392 |
| title2 |  8448 |
+--------+-------+
2 rows inset (0.06 sec)

# makes the index invalid.
# mysql> select title, count(1) as cnt from test where day(submission_date)=12 group by title;
+--------+-------+
| title  | cnt   |
+--------+-------+
| title1 | 59392 |
| title2 |  8448 |
+--------+-------+
2 rows inset (0.58 sec)
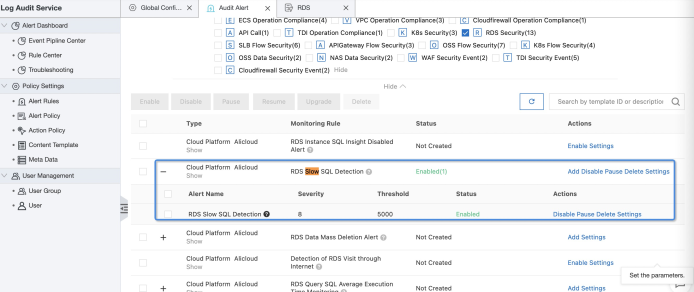
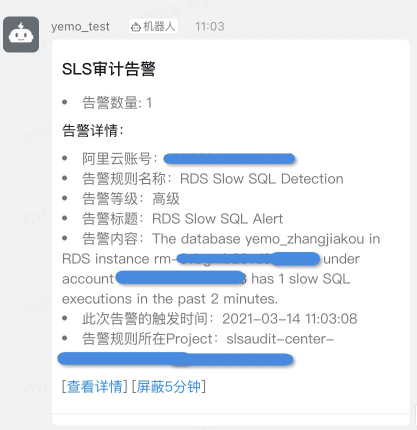
SLS monitors slow SQL and sends an alert notification.
Enable Versioning to Protect Valuable Data in Alibaba Cloud OSS

57 posts | 12 followers
FollowAlibaba Cloud Community - October 19, 2021
Kidd Ip - June 24, 2025
Alibaba Cloud Community - August 12, 2024
Alibaba Cloud Native Community - April 15, 2026
Alibaba Cloud Native Community - March 30, 2026
Alibaba Cloud Native Community - January 4, 2026

57 posts | 12 followers
Follow Simple Log Service
An all-in-one service for log-type data
Learn More Database for FinTech Solution
Leverage cloud-native database solutions dedicated for FinTech.
Learn More ApsaraDB RDS for MySQL
An on-demand database hosting service for MySQL with automated monitoring, backup and disaster recovery capabilities
Learn More ApsaraDB RDS for PostgreSQL
An on-demand database hosting service for PostgreSQL with automated monitoring, backup and disaster recovery capabilities
Learn MoreMore Posts by Alibaba Cloud Storage