Sherlock.IO, eBay's monitoring platform, processes tens of billions of logs, events, and metrics every day. The Flink Streaming job real-time processing system empowers Sherlock.IO to process logs and events. Post Flink implementation, eBay's monitoring team is able to share the processed results with the users on time. Currently, eBay's monitoring team manages eight Flink clusters and the largest cluster has thousands of TaskManagers. Hundreds of jobs are running on these clusters and several jobs have been running stably for more than half a year.
The monitoring team has built a metadata service for the Flink Streaming job real-time processing system to allow users and administrators to quickly create Flink jobs and adjust parameters. This service describes the directed acyclic graph (DAG) of a job in JSON format. Tasks of the same DAG share the same job. This simplifies job creation as it eliminates the effort to call the Flink API. Figure 1 below represents the overall stream processing architecture of Sherlock.IO.
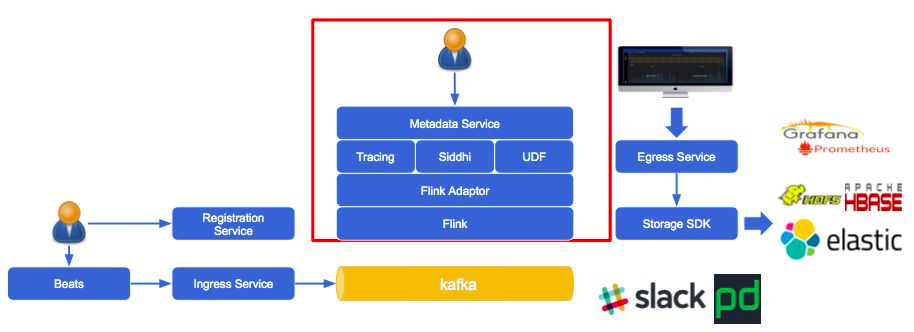
Figure 1 Overall Stream Processing Architecture of Sherlock.IO
Currently, jobs created by using this metadata service only allows employing Kafka as the data source. Kafka allows defining Capability to process the corresponding logic, and data through Flink Streaming.
The metadata service architecture is shown in Figure 2 below. The metadata service provides the Restful API at the top layer. You can call this API to describe and commit jobs. Metadata that describes a job is composed of three parts: Resource, Capability, and Policy. The Flink Adaptor connects the Flink Streaming API and the Restful API and allows you to call the Restful API to create a job according to the job description of the metadata service, eliminating the need to call the Flink Streaming API. This allows you to create Flink jobs without concerning about the Flink Streaming API. To migrate all existing jobs to a new stream processing framework, all you need to do is add an adaptor.
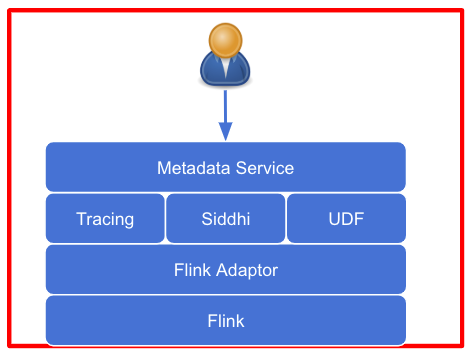
Figure 2 The architecture of the metadata service
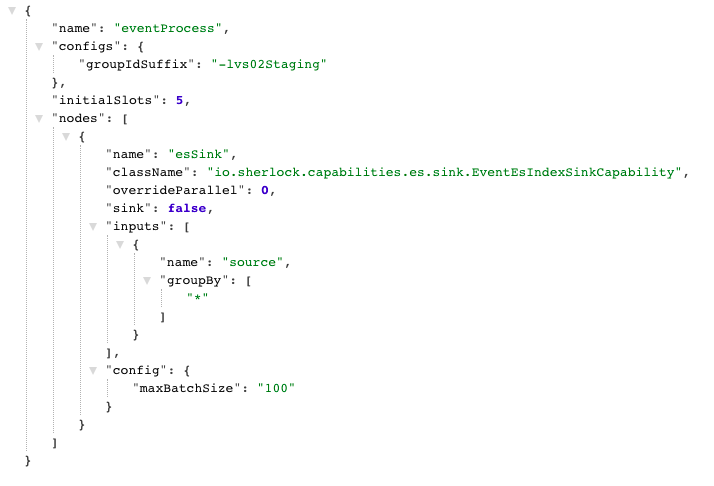
Figure 3 eventESSink Capability

Figure 4 DAG of the created Flink job
A policy can also be used as a simple filter, which allows you to filter out unnecessary data and improve the job's throughput by configuring the JEXL expression. Figure 5 shows a sample code of a Policy in a namespace named "paas". ZooKeeper's regular update mechanism is also implemented to ensure that the job does not need to be restarted after a policy is modified. As long as the policy modification of a namespace falls within the update interval, the modification is automatically applied to the job.
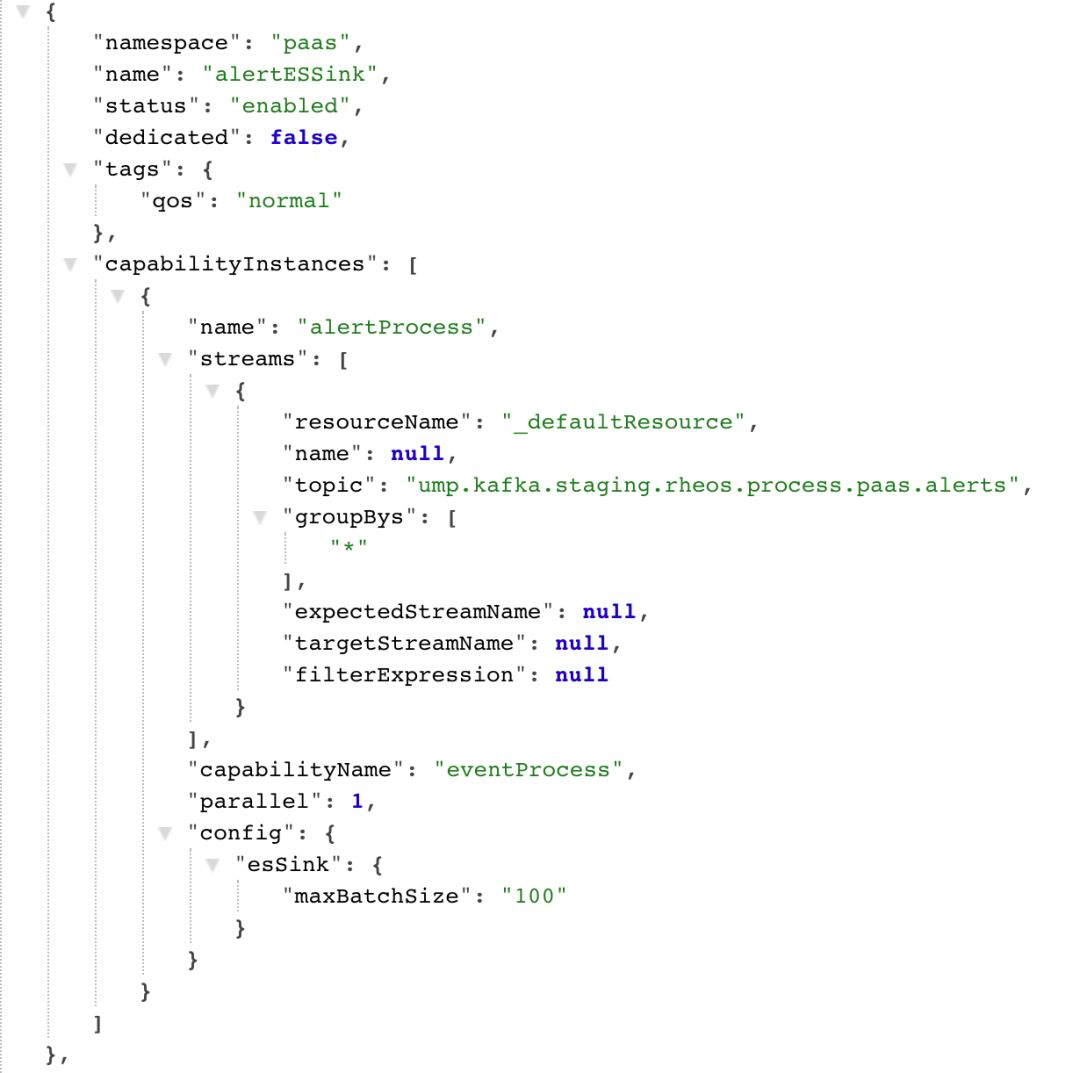
Figure 5 The Paas alertESSink Policy
For better management, the number of jobs needs to be minimized. This is achievable by making tasks of the same DAG share the same job. The same Capability can also be specified for different Policies. In such scenarios, when a specified Capability has sufficient resources, respective policies will be scheduled for the same job.
Let's understand this better with an example of an SQL Capability. The SQL statements of different Policies might differ, and If we create a job for each Policy, Job Managers will have more overhead. Therefore, as a solution, we may configure 20 slots for each SQL Capability, one slot for each policy. This ensures that each job created on the basis of a specific Capability can run 20 Policies. During the job implementation, data read from the source gets labeled with policy labels, and SQL statements defined by the corresponding policies are executed. This allows multiple policies to share the same job, and significantly reduce the total number of jobs.
Shared jobs provide an additional advantage in cases where data is read from multiple namespaces with the same Kafka topic. It ensures that prior to filtering, the data is read just once for all namespaces within the job, instead of once for each namespace. This significantly improves data processing efficiency.
Now, since you have a basic understanding of the metadata-driven architecture, let's understand the various methods used to optimize and monitor Flink jobs.
Monitoring the overall status of running jobs during Flink cluster operations and maintenance is a rather daunting task. Even if a checkpoint is enabled, it is difficult to determine whether any data is lost or how much data is lost, if any. Therefore, we inject heartbeats into each job to monitor the job running status.
Similar to Flink's LatencyMarker, heartbeats flow through the pipeline of each job. But, unlike LatencyMarker, when a heartbeat encounters DAG branches, it splits and flows to every branch instead of flowing to a random branch. Another difference is that heartbeats are not generated by Flink. Instead, heartbeats are generated regularly by the metadata service and consumed by each job.
As shown in Figure 4, when a job starts, a heartbeat data source is added to each job by default. After flowing into each job, a heartbeat flows through each node together with the data and adds labels of the current node. Further, it skips the processing logic of the current node and flows to the next node. When the heartbeat flows to the last node, it is sent to Sherlock.IO in the form of a metric. This metric contains the time when the heartbeat was generated, when it flowed into the job, and when it arrived at each node. Based on this metric, we can determine whether a job has a delay in reading Kafka data, the time required for a data record to be processed by the whole pipeline, and the time that each node takes to process the data. This allows you to determine the specific performance bottlenecks of the job.
Also, since heartbeats are sent regularly, the number of heartbeats that each job receives should be the same. If the final metric is inconsistent with regards to the expected number, you should be able to determine whether data loss has occurred. Figure 6 illustrates the data flow and Heartbeat status of a Flink job.
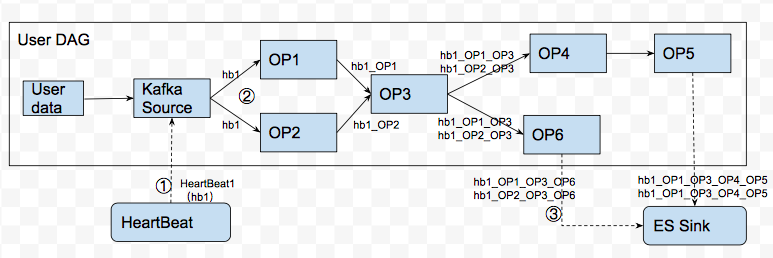
Figure 6. The Running Process of a Heartbeat in a Job
We can use heartbeats to define the availability of the cluster. However, it is imperative to define the conditions in which a job is unavailable:
You can use heartbeats to monitor and calculate the availability of the job in all these three situations. For example, if data is lost during restart, the heartbeats of the corresponding pipeline are lost. Accordingly, we can check whether data is lost as well as estimate the amount of data loss. In the second case, heartbeats will not be processed when a job is terminated. We can easily detect the terminated jobs and request the on-call service team to intervene in a timely manner. In the third case, when back pressure occurs, heartbeats are also blocked. Therefore, the on-call service team can quickly detect the back pressure and manually intervene.
To conclude, we can state that heartbeats are used to help us quickly monitor the running status of Flink jobs. Next, it is critical to ascertain how can we assess job availability? Since heartbeats are sent on a scheduled basis, we can define the transmit interval. For example, we set it to 10s, in this case, we can expect every pipeline of a job to send six heartbeats with the corresponding job information every one minute. Technically, we can expect 8640 heartbeats every day for each job. Therefore, we can define the availability of a job as

A Slot is the smallest unit for running a job on Flink [1]. You can assign one or more slots (as a rule-of-thumb, a good default number of slots to be assigned to a TaskManager would be the number of its CPU cores) to each TaskManager. Based on the parallelism mechanism, a job can be assigned to multiple TaskManagers, and a TaskManager can run multiple jobs. However, a TaskManager is a Java virtual machine (JVM) and when multiple jobs are assigned to the same TaskManager, they may compete for resources.
For example, a TaskManager is assigned three slots (three CPU cores) and an 8 GB heap memory. When the JobManager schedules jobs, it may schedule threads of three different jobs to this TaskManager to compete for CPU and memory resources. In case, one of the jobs consumes the most CPU or Memory resources, the other two jobs are affected. In such a scenario, we can configure Flink to isolate jobs, as shown in Figure 7.
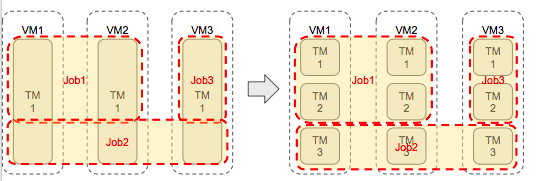
Figure 7. Scheduling Diagram: Before and After Flink Job Isolation
Refer the following description of each configuration Item:
taskmanager.numberOfTaskSlots: 1: assigns only one slot for each TaskManager.cpu_period" and "cpu_quota: specifies the number of CPU cores for each TaskManager.taskmanager.heap.mb: specifies the JVM memory size for each TaskManager.
You can use the above configuration items to specify the CPU and memory resources to be exclusively held by each TaskManager. This implements isolation between jobs and prevents multiple jobs from competing for limited resources.
It is the most commonly experienced problem while maintaining Flink clusters. As mentioned in section 3.2, there are several causes of back pressure and regardless of the causes, data will eventually get blocked in the local buffer of the upstream operator where back pressure occurs.
Each TaskManager has a local buffer pool, where the incoming data of each operator is stored, and its memory is recovered after the data is sent out. However, when back pressure occurs, data cannot be sent out, and the memory of the local buffer pool cannot be released, thus, resulting in a persistent request for buffer.
Heartbeats can only help us determine whether back pressure has occurred and cannot help us further to locate the roots of the problem. Therefore, we decide to print the StackTrace of each operator regularly. Therefore, when back pressure occurs, StackTrace can help to track the operator creating bottlenecks.
Figure 8, clearly shows the Flink jobs where back pressure has occurred, as well as their TaskManagers. By using a Thread Dump, we can also locate the problematic code.
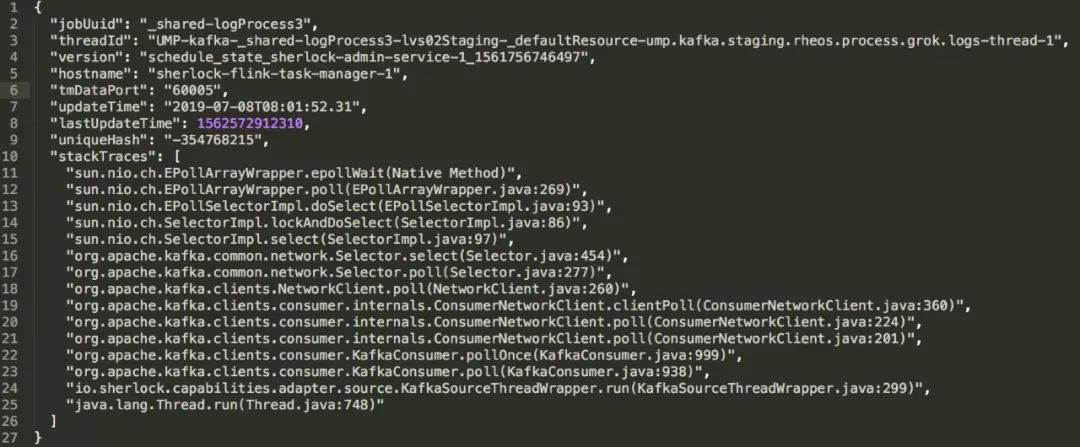
Figure 8 StackTrace with Back Pressure
Considering that Flink provides many useful metrics [2] to monitor the running status of Flink jobs, we have added a few service metrics. We also use the following tools to monitor Flink jobs:
This section outlines several apps that successfully run on the Flink Streaming job real-time processing system of the Sherlock.IO platform.
Currently, the monitoring team performs event alerting based on Flink Streaming. We have defined an alerting operator EventAlertingCapability to process custom rules of each policy. A performance monitoring rule is shown in Figure 9.

An alert is triggered when the performance detector application is "r1rover", the host starts with "r1rover", and the value is greater than 90. The alert will be sent to the specified Kafka topic for downstream processing.
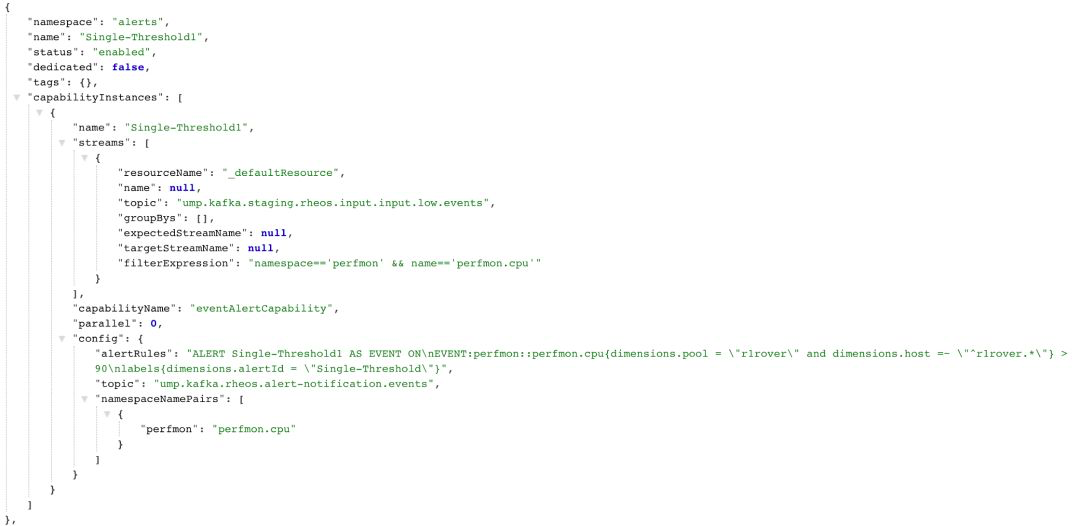
Figure 9 Single-Threshold1 Policy
Serving as the event center of eBay, Eventzon collects events from various applications, frameworks, and infrastructures, and generates alerts in real-time through the monitoring team's Flink Streaming system. As different events have different data sources and metadata, a unified rule cannot be used to describe them.
We have defined a set of jobs to process Eventzon events, which are composed of multiple capabilities, such as the Filter Capability and the Deduplicate Capability, which are respectively used to filter illegal/non-conforming events, and to remove duplicate events. After all Eventzon events are processed by this complete set of jobs, valid alerts are generated and sent to relevant teams through emails, Slack, or Pagerduty according to the notification mechanism.
Netmon (Network Monitoring) is used to monitor the health status of all Network devices of eBay. It reads logs from eBay's network devices such as switches and routers and looks for specific information in error logs, to generate alerts.
Netmon requires every eBay device to be duly "registered". After reading logs from these devices, Netmon queries for information about these devices from the "register" through EnrichCapability, fills the relevant information, such as the IP address, data center, and rack position, into these logs and saves these logs as events. When a device generates some particular error logs, the logs are matched according to the corresponding rules, and then an alert is generated. The alert is saved by the EventProcess Capability to Elasticsearch and then displayed on the Netmon dashboard in real-time. Some temporary errors may occur due to network jitters and are automatically recovered quite quickly.
When the above situation occurs, Netmon will mark the alerts generated during network jitter as "Resolved" according to the corresponding rules. For alerts that require manual intervention, the maintenance personnel can manually click Resolved on the Netmon dashboard to close these alerts.
eBay's monitoring team hopes to alert users in real-time based on the metrics, events, logs, and corresponding alert rules provided by users. Flink Streaming provides a low-latency solution to meet the low-latency requirements and is suitable for complex processing logic.
However, during Flink maintenance, we found problems such as false alerts and missed alerts due to particular reasons such as job restarts. Such problems may mislead customers. Therefore, we will try to ensure high stability and availability of Flink in the future. We also hope to integrate some sophisticated artificial intelligence (AI) algorithms with monitoring metrics and logs to generate more effective and accurate alerts and make Flink a powerful tool for the maintenance and monitoring teams.
Source: eBay Unified Monitoring Platform
Flink 1.9: Using SQL Statements to Read Data from Kafka and Write to MySQL

206 posts | 56 followers
FollowApache Flink Community - March 20, 2025
Apache Flink Community - August 29, 2025
Alibaba Clouder - November 3, 2017
Apache Flink Community - April 30, 2025
Apache Flink Community - February 27, 2025
Apache Flink Community China - January 11, 2021

206 posts | 56 followers
Follow Microservices Engine (MSE)
MSE provides a fully managed registration and configuration center, and gateway and microservices governance capabilities.
Learn More Message Queue for Apache Kafka
A fully-managed Apache Kafka service to help you quickly build data pipelines for your big data analytics.
Learn More Managed Service for Prometheus
Multi-source metrics are aggregated to monitor the status of your business and services in real time.
Learn More Application Real-Time Monitoring Service
Build business monitoring capabilities with real time response based on frontend monitoring, application monitoring, and custom business monitoring capabilities
Learn MoreMore Posts by Apache Flink Community