By Shengdong

Internal defects in operating systems and device driver defects are the most common causes of system downtime (unresponsiveness or unexpected restart). This article will discover the underlying logic and methodology of memory dump analysis and demonstrate the whole process from analysis to conclusion through a real online case. By going through these contents, you can better understand the system and deal with similar problems.
Any frequent computer user has encountered a situation where the system does not respond or suddenly restarts. If this problem occasionally occurs on a client device, such as a mobile phone or laptop, we can easily figure it out by restarting the device as if nothing has happened.
However, if this occurs on a server, such as a virtual machine or physical machine that hosts and runs WeChat or Weibo background programs, it can lead to serious consequences. For example, the business can be interrupted or encounter a long downtime.
As we all know, computers are driven by operating systems that are installed and run on them, such as Windows and Linux. Internal defects in operating systems or device driver defects are the most common causes of system downtime (unresponsiveness or unexpected restart).
To solve this problem radically, we must perform the memory dump analysis on the problematic operating system. The memory dump analysis is an advanced feature of software debugging. It requires engineers with comprehensive knowledge of system-level theories and rich experiences in cracking difficult cases.
The memory dump analysis is a very difficult task that requires professional competence. After we shared cases, we got interesting feedback such as "You have reminded me of Conan" or "You are the real Black Cat Detective! You engage in criminal investigation all day long as an IT engineer."
The memory dump analysis requires multiple basic capabilities such as disassembly, assembly analysis, code analysis in various languages, system-level or even bit-level knowledge of schemas such as the heap, stack, and virtual table.
Now, imagine that a system has been running for a long time. During this period, the system has experienced and accumulated a large number of normal or abnormal states. If the system goes wrong suddenly, this probably has something to do with the accumulated states.
Analyzing the memory dump is actually analyzing the "snapshot" generated by the system upon the failure. Then, the engineer must trace back the runtime history starting from the snapshot to identify the source of the failure. This is a bit like reasoning the case from the crime scene.
By looking at the nature of problems to be solved, we can divide memory dump analysis methods into deadlock analysis and exception analysis. The deadlock analysis starts with analyzing the overall system, whereas the exception analysis starts with the specific exception.
When a deadlock occurs, the system becomes unresponsive. The deadlock analysis focuses on the full picture of the operating system, including all processes. As stated in the textbook, a running program contains the code segment, data segment, and stack segment. Therefore, you can also look at a system in this sequence. The full picture of the system includes the code (thread) that is being executed and the data (data and stacks) that holds the state of the execution.
A deadlock is a situation in which part or all threads in a system wait for and rely on each other. As a result, the tasks of the threads cease to function. Therefore, to troubleshoot a deadlock, we need to analyze the states of all threads and their dependencies, as shown in the figure.
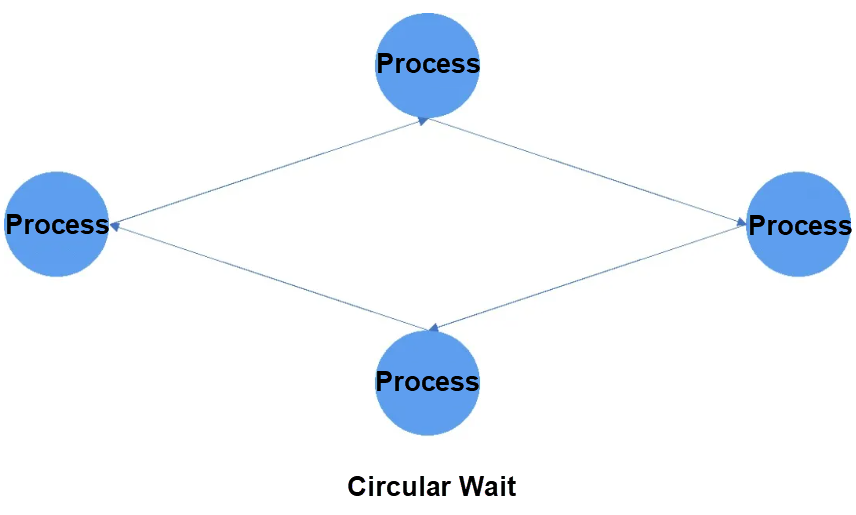
The state of a thread is relatively definite. To obtain this information, we can read the state flags of threads in the memory dump. Dependency analysis requires extensive skills and experience. Among them, the most common method lies in the relationship analysis between object holding and object waiting, and the time sequence analysis.
Compared with the deadlock analysis, the exception analysis focuses on the exception itself. Common exceptions include divide-by-zero errors, the execution of illegal instructions, incorrect address access, and even custom illegal operations at the software level. These exceptions can lead to unexpected restart of the operating system.
Fundamentally, an exception is triggered by the execution of specific instructions by the processor. In other words, the processor has triggered an exception point. Therefore, to analyze exceptions, we must derive the complete logic of code execution based on the exception points.
Based on experience, only a few engineers know how to analyze memory dump exceptions, let alone understand the preceding issue. Many engineers focus on the exception itself during the analysis, but do not derive the complete logic behind it.
Compared with the deadlock analysis, the exception analysis does not involve many fixed rules. For most time, we cannot spot the root cause because the logic behind the problem is complex.
Overall, the underlying logic of exception analysis is to constantly compare the expected and unexpected conditions in order to approach the causes. The following example shows how to handle an exception triggered by the execution of a wrong instruction. First, we must know the correct instruction to execute and the reason why the processor receives the wrong instruction. On this basis, we can dive deeper until we get to the root cause.
The deadlock analysis method is used to handle exceptions, whereas the exception analysis method is used to handle deadlocks.
These two methods are classified based on problem analysis entries and general analysis measures. In practice, we often need to determine ideas for further handling exceptions based on the global system status, and use specific in-depth analysis measures to troubleshoot global issues.
Downtime issues feature a rare case, that is, completely irrelevant machines break down at the same time. Against this case, we must find the conditions that can trigger the failure on these machines at the same time.
Usually, these machines break down at almost the same time or successively from a certain point of time. For the former case, we can often see a physical device failure causes all virtual machines running on it to go down, or a remote management software program kills key processes of multiple systems at the same time. For the latter case, it may occur when you deploy the same problematic module (a software program or driver) on all instances.
Another common reason to the latter case is extensive attacks on the instances. When the WannaCry ransomware was raging, machines in some companies or departments encountered blue screens.
In this case, a large number of cloud servers went down successively after you installed Alibaba CloudMonitor. To prove Alibaba's innocence in this case, we worked hard to analyze this problem in depth. I hope you can be inspired by this shared case.
Memory dump is the only effective solution to operating system crashes. After a Linux or Windows operation system crashes, a memory dump is generated automatically or manually.
To analyze the memory dump in Linux, we first use the crash tool to open the memory dump and run the sys command to view the basic system information and the direct cause of the crash. In this example, the direct cause is "Kernel panic - not syncing: stack-protector: Kernel stack is corrupted in: ffffxxxxxxxx87eb", as shown in the figure below.

Now, we must interpret this message word by word. "Kernel panic - not syncing:" is output in the panic kernel function. When the panic function is called, this output is a must. Therefore, this string does not directly reflect the problem. The string "stack-protector: Kernel stack is corrupted in:" is output in the __stack_chk_fail kernel function, which is a stack check function. This function can check the stack and call the panic function to generate a memory dump report when a problem is found.
However, it reports the corruption of the stack. For this function, we will further analyze it later.
The ffffxxxxxxxx87eb address is the return value of __builtin_return_address(0). If the parameter of this function is 0, the output value of the function is the return address of the function that calls it. I know this statement is a bit confusing now, but we will figure it out after we analyze the call stack.
To figure out the core of the crash, we must analyze the call stack of the panic function. At the first glance of the figure below, system_call_fastpath calls __stack_chk_fail, which then calls the panic function to report the stack corruption problem. However, you can find that the fact is not that simple by comparing the corrupted stack with similar stacks.

The figure below shows a similar call stack that starts with the system_call_fastpath function. Can you see the difference between this call stack and the preceding one? In fact, the call stack starting with the system_call_fastpath function is a kernel call stack of a system call.

In the previous figure, the call stack that represents the user-mode process makes an epoll-related system call, which then switches to the kernel mode. However, the call stack in the figure above is obviously problematic because no system call corresponds to the __stack_chk_fail kernel function.
Here, we must note that the call stack output by the backtrace function is occasionally wrong during the memory dump analysis.
This call stack is not a data schema. Instead, it is refactored from the real data schema and thread kernel stack based on certain algorithms. The refactoring process is actually the reverse engineering of the function call process.
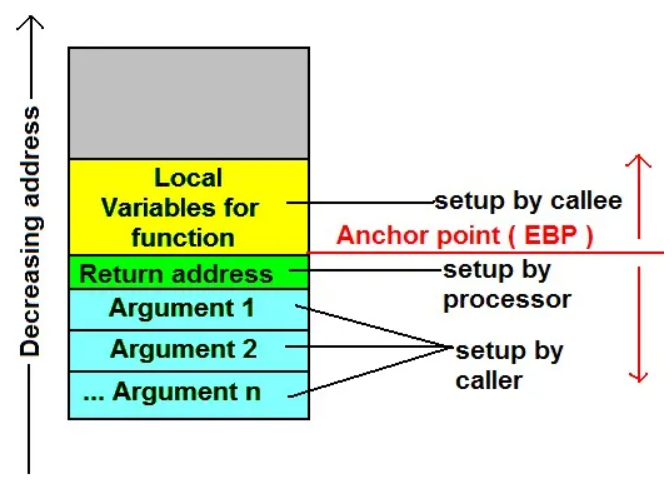
We all know the characteristic of a stack, that is, first in last out (FILO). In the next figure, you can see the function call and the use of the stack. As you can see, each function call is assigned a space in the stack. When the CPU executes a function call instruction, it also carries the next instruction into the stack. Here, the "next instruction" is the function return address.
Now, let's look back at the direct cause of the panic output, that is, the return value of the __builtin_return_address(0) function.
The return value is actually the next instruction of the call function that calls the __stack_chk_fail function, and this instruction is a caller function. The instruction address is recorded as ffffxxxxxxxx87eb.
As shown in the figure below, we can run the sym command to view the names of the functions whose entry addresses are adjacent to this address. Obviously, this address does not belong to the system_call_fastpath function or any kernel functions. Once again, this proves that the panic call stack is wrong.

As shown in the next figure, we can run the bt -r command to view the raw stack. A raw stack usually contains several pages. Here, the screenshot shows only the part relevant to __stack_chk_fail.
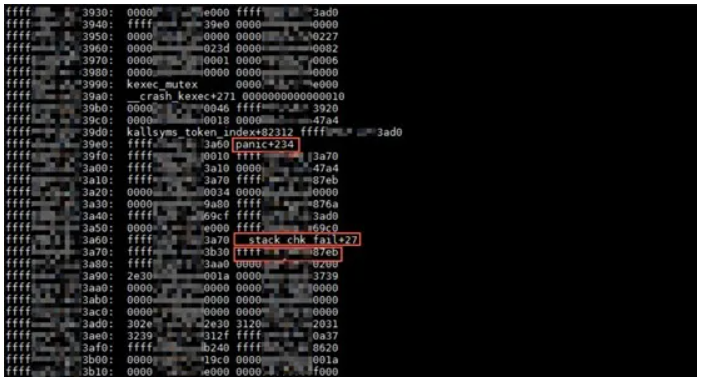
In this part, there are three pieces of key data. The first is the return value of calling the __crash_kexec function by the panic function. This return value is the address of an instruction of the panic function. The second is the return value of calling the panic function by the __stack_chk_fail function. Similarly, this return value is the address of an instruction of the __stack_chk_fail function. The last is the ffffxxxxxxxx87eb instruction address, which belongs to another unknown function that calls the __stack_chk_fail function.
The call stack with the system_call_fastpath function corresponds to a system call, but the call stack for the panic function is corrupted. Therefore, we naturally wonder what system call corresponds to the call stack.
In Linux implementations, a system call is implemented as an exception. By triggering this exception, the operating system transmits the parameters of the target system call to the kernel through a register. When we run the backtrace command to output the call stack, the system also outputs the context of the exception occurred in this call stack, which is the value in the register that is saved when the exception happens.
For system calls (exceptions), the key register is RAX, as shown in the figure. It stores the current system call number. To verify this conclusion, let's use a normal call stack. 0xe8 is the decimal value of 232.

By using the crash tool, you can run the sys -c command to view the kernel call table. As you can see from the command output, 232 corresponds to the system call number, which is epoll shown in the figure.

Now, let's look back at the earlier figure in the "Function Call Stack" section. As you can see, RAX stores 0 in the exception context. Under normal circumstances, the system call number corresponds to the read function, as shown in this figure.
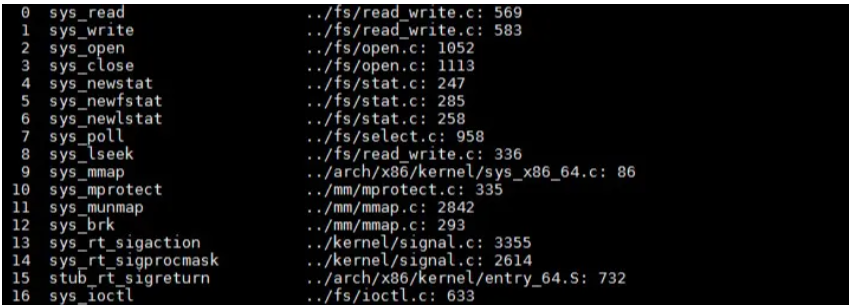
In the next figure, we can see that the problematic system call table has been modified somehow. In practice, two types of code would modify the system call table, which is something dialectical. The two types of code are an anti-virus software program and a virus or Trojan. Of course, a crappy kernel driver can accidentally modify the system call table.
In addition, the address of the modified function is so adjacent to the address originally reported by the __stack_chk_fail function. This also proves that the system mistakenly called the read function and then the __stack_chk_fail function.

However, the preceding proof is not convincing enough. This is true because we can even not tell whether the problem is caused by an anti-virus software program or a Trojan. Therefore, we had to dive deeper to obtain more information about ffffxxxxxxxx87eb from the memory dump.
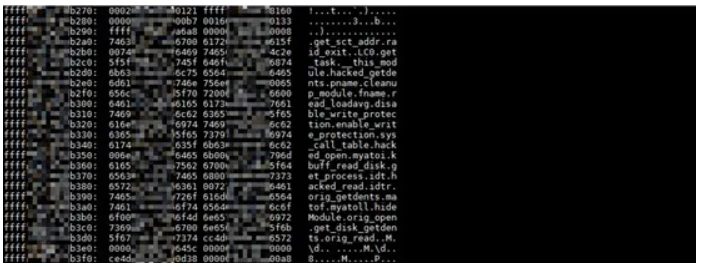
We also tried to identify the kernel module corresponding to this address, but nothing worked out. This address does not belong to any kernel modules or is referenced by any known kernel functions. For this reason, we ran the rd command to output the consecutive pages that were implemented to physical pages, and checked them for signature-like suspicious strings to locate the problem.
As a result, we found some strings at adjacent addresses, as shown in the figure below. Obviously, these strings are function names. The following figure shows the hack_open and hack_read functions that correspond to the hacked No. 0 and 2 system calls, and some other functions like disable_write_protection. These function names indicate that the code is "exceptional".
A thorough memory dump analysis is required for figuring out machine crashes. My mantra in this case is "every bit matters", that is, any bit provides a clue to the crash. Due to the mechanism of memory dump and random factors in the generation process, the memory dump can result in inconsistent data. Therefore, we must verify a conclusion from different perspectives.
Disclaimer: The views expressed herein are for reference only and don't necessarily represent the official views of Alibaba Cloud.
Securing Environments with IDaaS – Part 2: Industry-Based Use Cases and Integration
How Does Artificial Intelligence Work and Where Is Artificial Intelligence Used

2,593 posts | 793 followers
FollowAlibaba Cloud Community - September 14, 2021
Alibaba Clouder - June 10, 2019
Alibaba Clouder - July 29, 2020
Balaban - March 17, 2021
Alibaba Cloud Security - January 3, 2020
Dikky Ryan Pratama - May 29, 2023

2,593 posts | 793 followers
Follow Hybrid Cloud Solution
Highly reliable and secure deployment solutions for enterprises to fully experience the unique benefits of the hybrid cloud
Learn More CloudBox
Fully managed, locally deployed Alibaba Cloud infrastructure and services with consistent user experience and management APIs with Alibaba Cloud public cloud.
Learn More Apsara Stack
Apsara Stack is a full-stack cloud solution created by Alibaba Cloud for medium- and large-size enterprise-class customers.
Learn More FinTech on Cloud Solution
This solution enables FinTech companies to run workloads on the cloud, bringing greater customer satisfaction with lower latency and higher scalability.
Learn MoreMore Posts by Alibaba Clouder