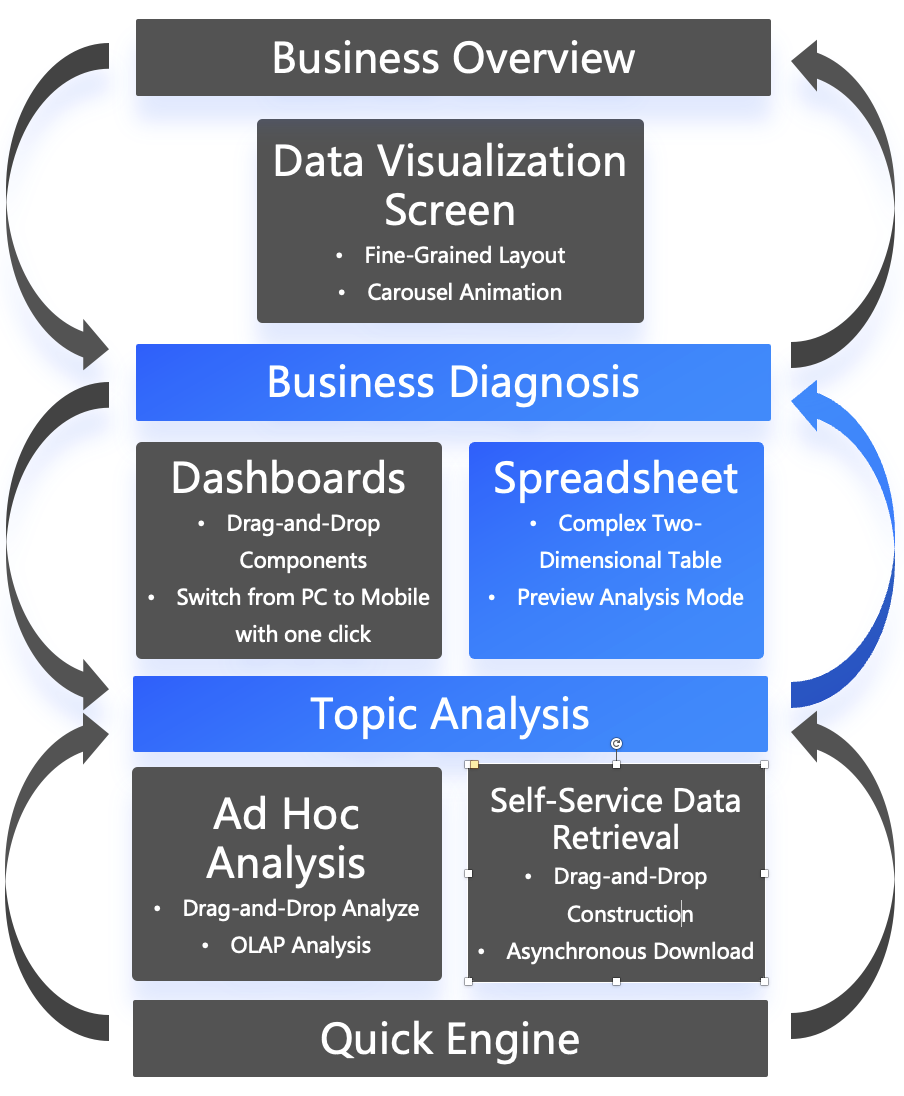
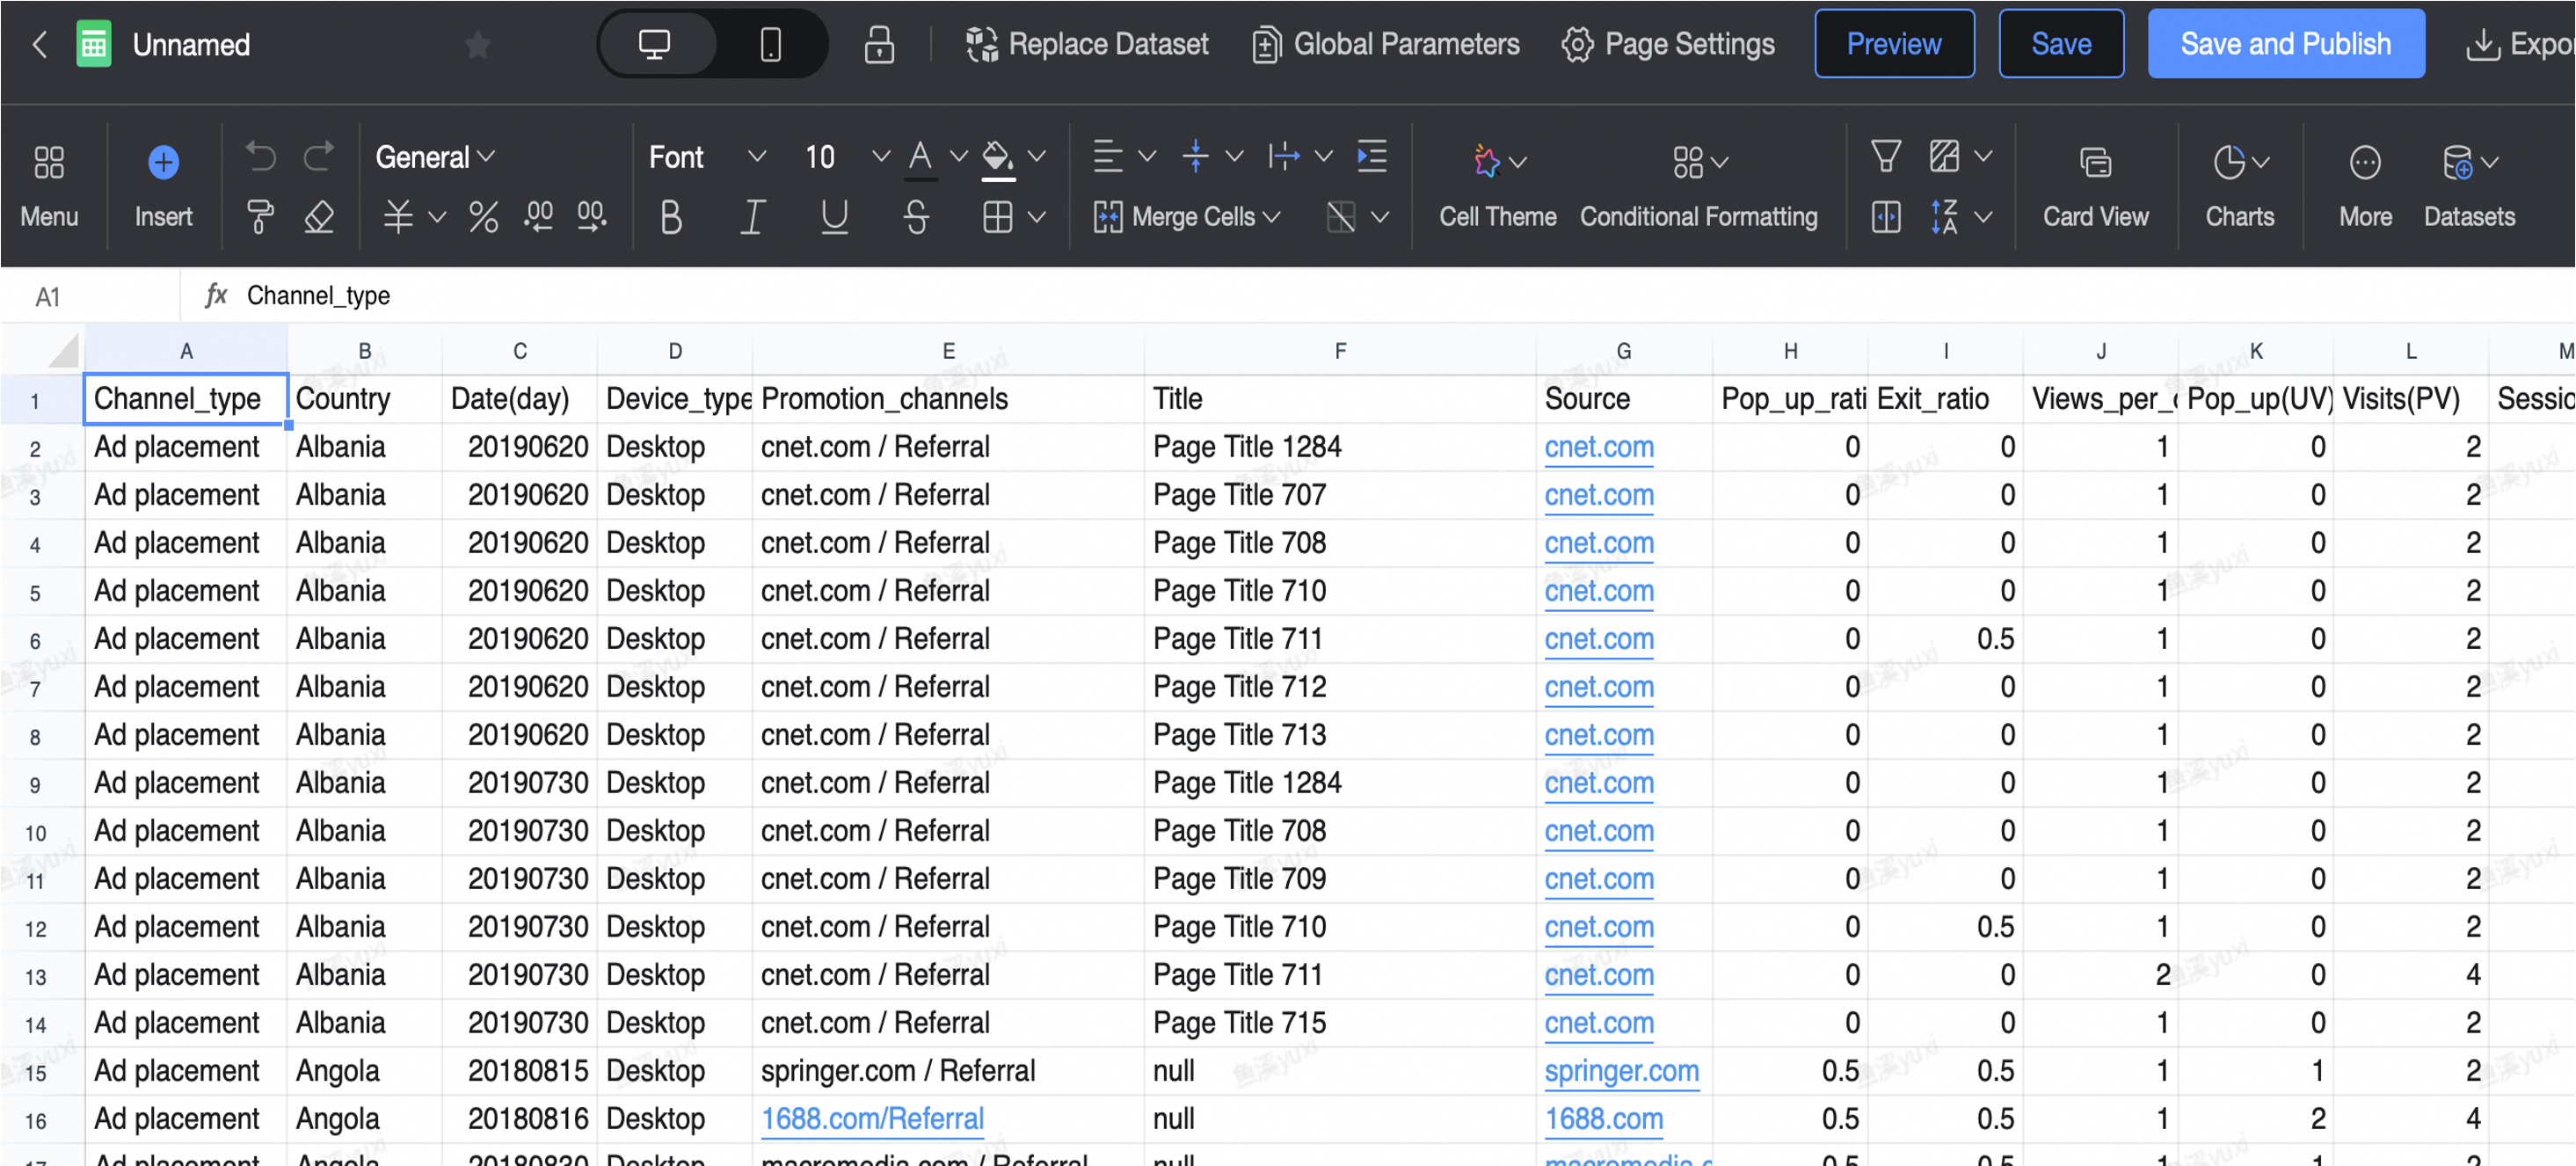
Spreadsheets are aimed at analysts and business people who are skilled in using Excel and have the same operation and effect as Excel. A spreadsheet can summarize data from different Sheet pages into a table that contains business summary metrics. In addition, the spreadsheet can also directly fill in data based on complex forms, and comprehensively calculate the fill in data and data set retrieval results, one-stop data reporting and analysis.

Available Editions:
| Personal Edition | Advanced Edition | Professional Edition | Independent Deployment |
|---|---|---|---|
| Not supported | Buy separately | Complimentary | Complimentary |
Help business personnel to easily produce business reports with complex formats and large amount of information, which can realize the production of forms including but not limited to various business details, grouping reports, cross reports, main sub-reports, column reports, query reports, filling reports, etc., and improve the efficiency of reading and using numbers.

Firm A is a modern enterprise that develops and sells fashionable women's shoes, men's shoes, children's shoes and women's bags, with many stores and factories. The business needs to combine the analysis results of multiple combined dimensions into one table at the same time, which is a typical Chinese-style complex report scenario. Taking the sales situation of shoe factories as an example, it needs to analyze the sales situation of different factories in different time periods, different time granularities, and different regions. At the same time, the business side is not familiar with SQL usage and is familiar with traditional Excel operations. Use the multi-sheet capability of the spreadsheet to pull the original detailed data and hide it, use Excel formula to process the data, and use the functions of data set header hiding, row and column hiding, free cells to build a complex report for final display.
Firm B is a water company divided into districts and has a water supply station. A city may have multiple equipment that need regular inspection and reporting of maintenance, power distribution and control boxes, disinfection, etc. The traditional paper list reporting method will encounter problems such as unable to find equipment, easy to make mistakes manually, and untimely list reporting. Through the complex form filling function of the electronic form, you can automatically assign regular inspection tasks to different people and collect them in a unified way. Filling personnel can fill in at any time through the mobile phone in the mobile terminal, greatly improving the timeliness and accuracy of the whole process.
Alibaba Cloud Brings AI+Cloud Strategy to European Businesses

1,317 posts | 463 followers
FollowPM - C2C_Yuan - August 1, 2023
Alibaba Cloud Community - June 30, 2025
Alibaba Cloud Community - March 5, 2024
Alibaba Clouder - March 1, 2019
Alibaba Cloud Community - July 24, 2025
Alibaba Clouder - January 8, 2021

1,317 posts | 463 followers
Follow Big Data Consulting for Data Technology Solution
Alibaba Cloud provides big data consulting services to help enterprises leverage advanced data technology.
Learn More Big Data Consulting Services for Retail Solution
Alibaba Cloud experts provide retailers with a lightweight and customized big data consulting service to help you assess your big data maturity and plan your big data journey.
Learn More AI Acceleration Solution
Accelerate AI-driven business and AI model training and inference with Alibaba Cloud GPU technology
Learn More ApsaraDB for HBase
ApsaraDB for HBase is a NoSQL database engine that is highly optimized and 100% compatible with the community edition of HBase.
Learn MoreMore Posts by Alibaba Cloud Community