This is the fourth and final section of the DataWorks workshop. In this section, you will learn how to perform data quality monitoring. This section will mainly go over how you can monitor the data quality in the process of using the data workshop, set up quality monitoring rules, monitor alerts and tables.
Before you begin this section, make sure that you have read the previous sections of this workshop: Data Acquisition with DataWorks and Data Processing with DataWorks. It will be hard to complete the steps outlined in this section without first completing the steps in the previous two sections.
Data quality (DQC) is a one-stop platform that supports quality verification, notification, and management services for a wide range of heterogeneous data sources. Currently, Data Quality supports the monitoring of MaxCompute data tables and DataHub real-time data streams.
When offline MaxCompute data changes, the Data Quality verifies the data, and blocks the production links to avoid spread of data pollution. Furthermore, Data Quality provides verification of historical results. With this, you can analyze and quantify data quality. In the streaming data scenario, Data Quality can monitor the disconnections based on the DataHub data tunnel. Data Quality also provides orange and red alarm levels, and supports alarm frequency settings to minimize redundant alarms.
The process of using data quality is to configure monitoring rules for existing tables. After you configure a rule, you can run a trial to verify the rule. When the trial is successful, you can associate this rule with the scheduling task. Once the association is successful, every time the scheduling task code is run, the data quality validation rules are triggered to improve task accuracy. Once the subscription is successful, the data quality of this table will be notified by mail or alarm whenever there is a problem. Note that using data quality will result in additional costs.
If you have completed the previous log data upload and user portrait sections, you will have the following table: ods_raw_log_d, ods_user_info_d, ods_log_info_d, dw_user_info_all_d, rpt_user_info_d.
The most important thing in data quality is the configuration of table rules, so the question how can a table rules be judged as reasonable? Well, let's take a look at how the tables above be configured with table rules.
ods_raw_log_dYou can see all the table information under the item in the data quality, now you are going to configure the data quality monitoring rules for the ods_raw_log_d data sheet.

Select the ods_raw_log_d table and click Rule Configuration to go to the following page.

You can review the data sources for this ods_raw_log_d table. The data for ods_raw_log_d table is from OSS. Its partition is ${bdp.system.bizdate} format and is written into the table ("dbp.system.bizdate" is the date to get to the day before). For this type of daily log data, you can configure the partition expression for the table. There are several kinds of partition expressions, and you can select dt = $ [yyyymmdd-1]. Refer to the documentation Parameter configuration for detailed interpretation of scheduling expressions.
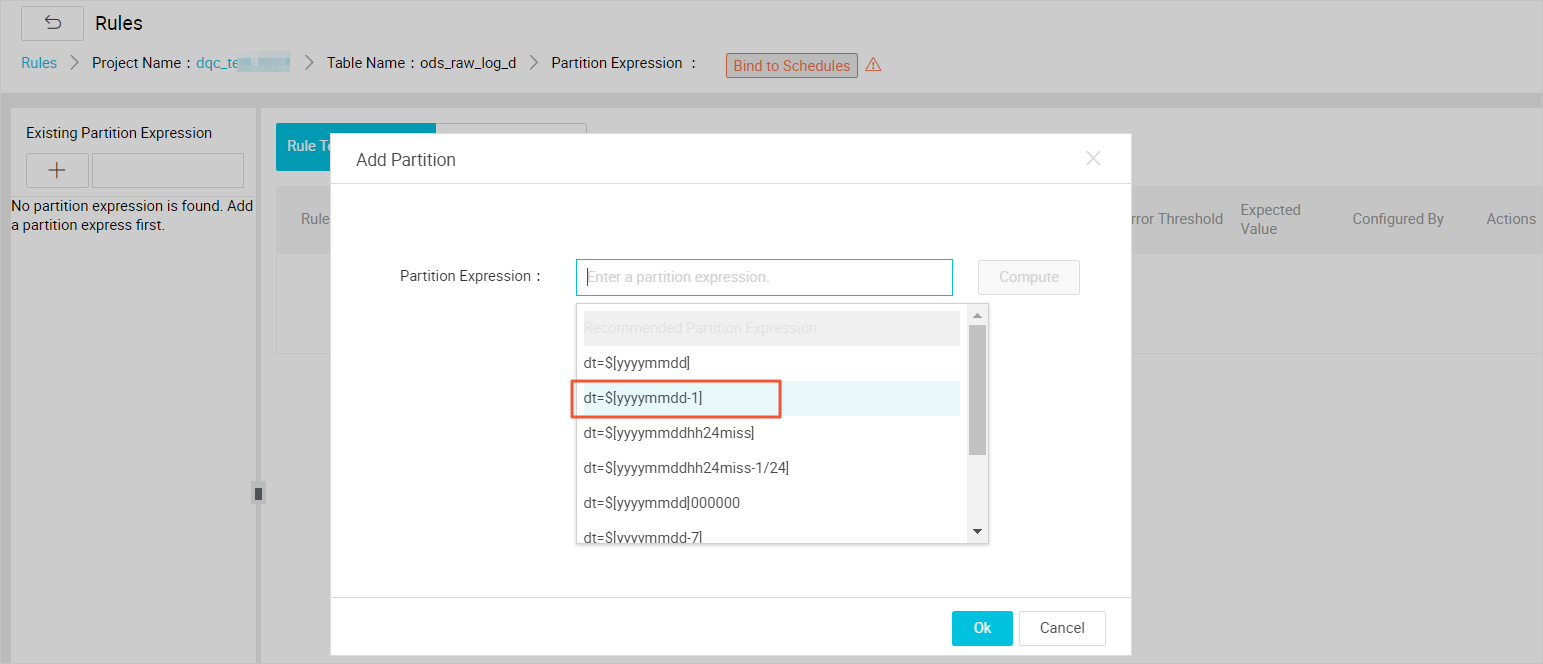
Note the following:
If there are no partition columns in the table, you can configure it as no partition. Depending on the real partition value, you can configure the corresponding partition expression.
After clicking Confirm, you can see the interface below and choose to Create Rule.

When you select to create a rule, the following interface appears.

Click Add Monitoring Rules and a prompt window appears for you to configure the rule.
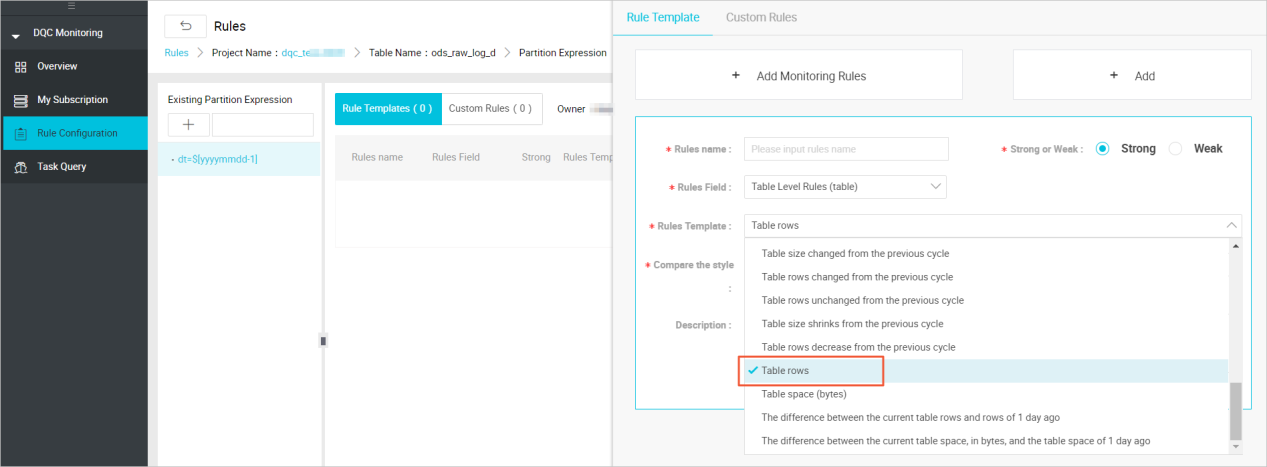
The data in this table comes from the log file that is uploaded by OSS as the source table. You need to determine whether there is data in this table partition as soon as possible. If there is no data in this table, you need to stop the subsequent tasks from running as if the source table does not have data, the subsequent task runs without meaning.
Only under strong rules does the red alarm cause the task to block, setting the instance state to failure. When configuring rules, you need to select the template type as the number of table rows, sets the strength of the rule to strong. Click the Save button after the settings are completed.
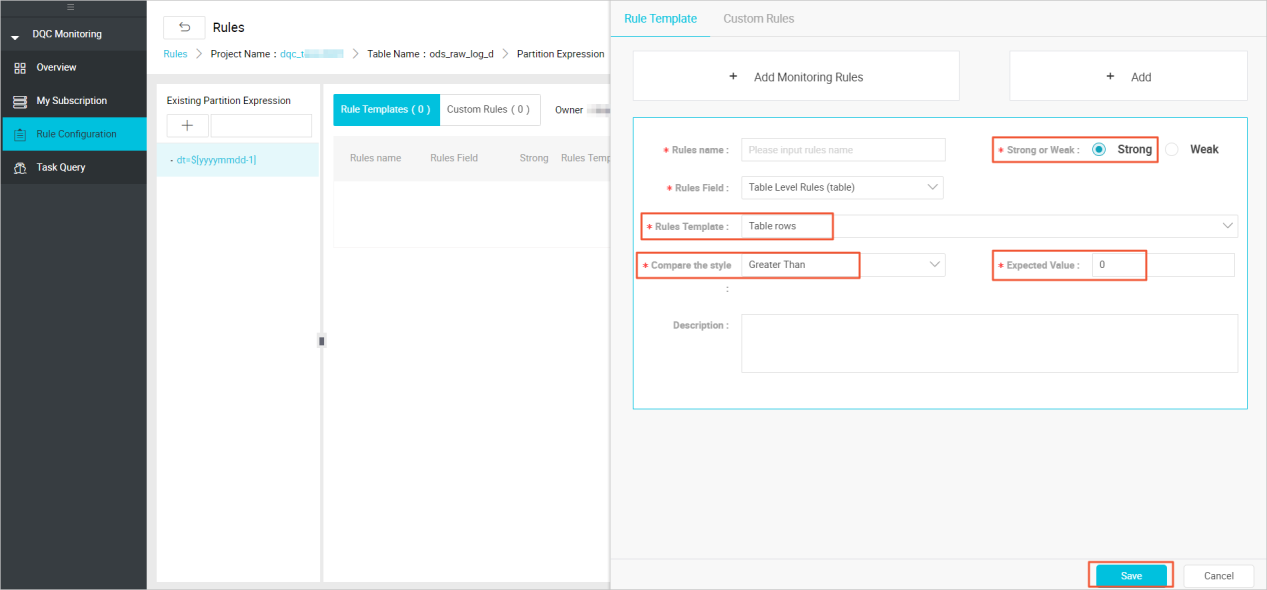
This configuration is primarily to avoid the situation that there is no data in the partition, which causes the data source for the downstream task to be empty.
In the upper-right corner, there is a Test Run button that can be used to verify configured rules. The Test Run button can immediately trigger the validation rules for data quality.

When you click the Test Run button, you are prompted for a window to confirm the Scheduling Time. After a Test Run is clicked, there will be a information window below telling you to jump to the test results by clicking prompt information.
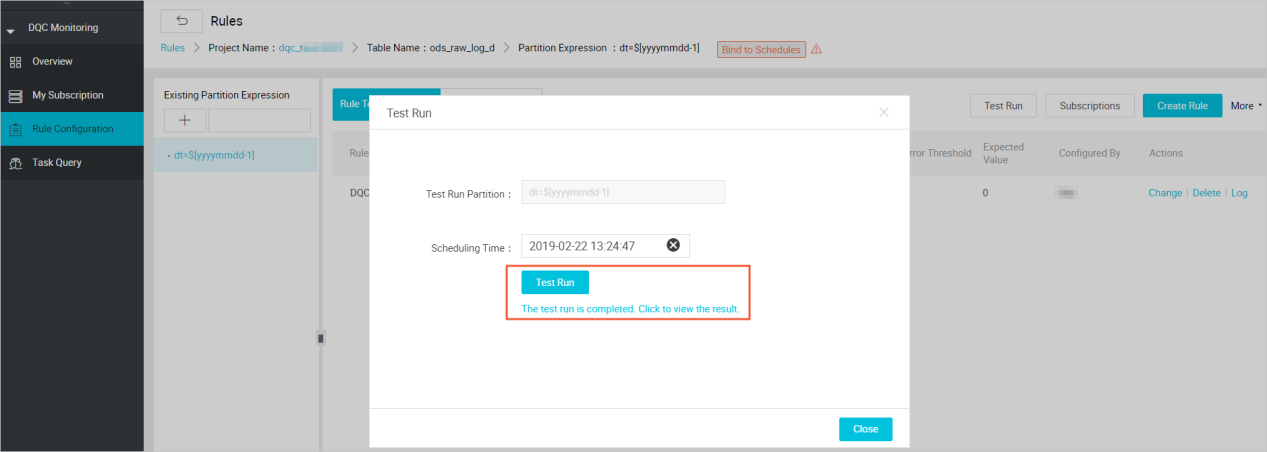

According to the test results, the data of the Mission output can be confirmed to be in line with the expectations. It is recommended that once each table rule is configured, a trial operation should be carried out to verify the applicability of the table rules. When the rules are configured and the trial runs are successful, you need to associate the table with its output task. In this way, every time the output task of the table is run, the validation of the data quality rules is triggered to ensure the accuracy of the data.
Data quality support being associated with scheduling tasks. After the table rules and scheduling tasks are bound, when the task instance is run, the data quality check is triggered. There are two ways to schedule table ruless:
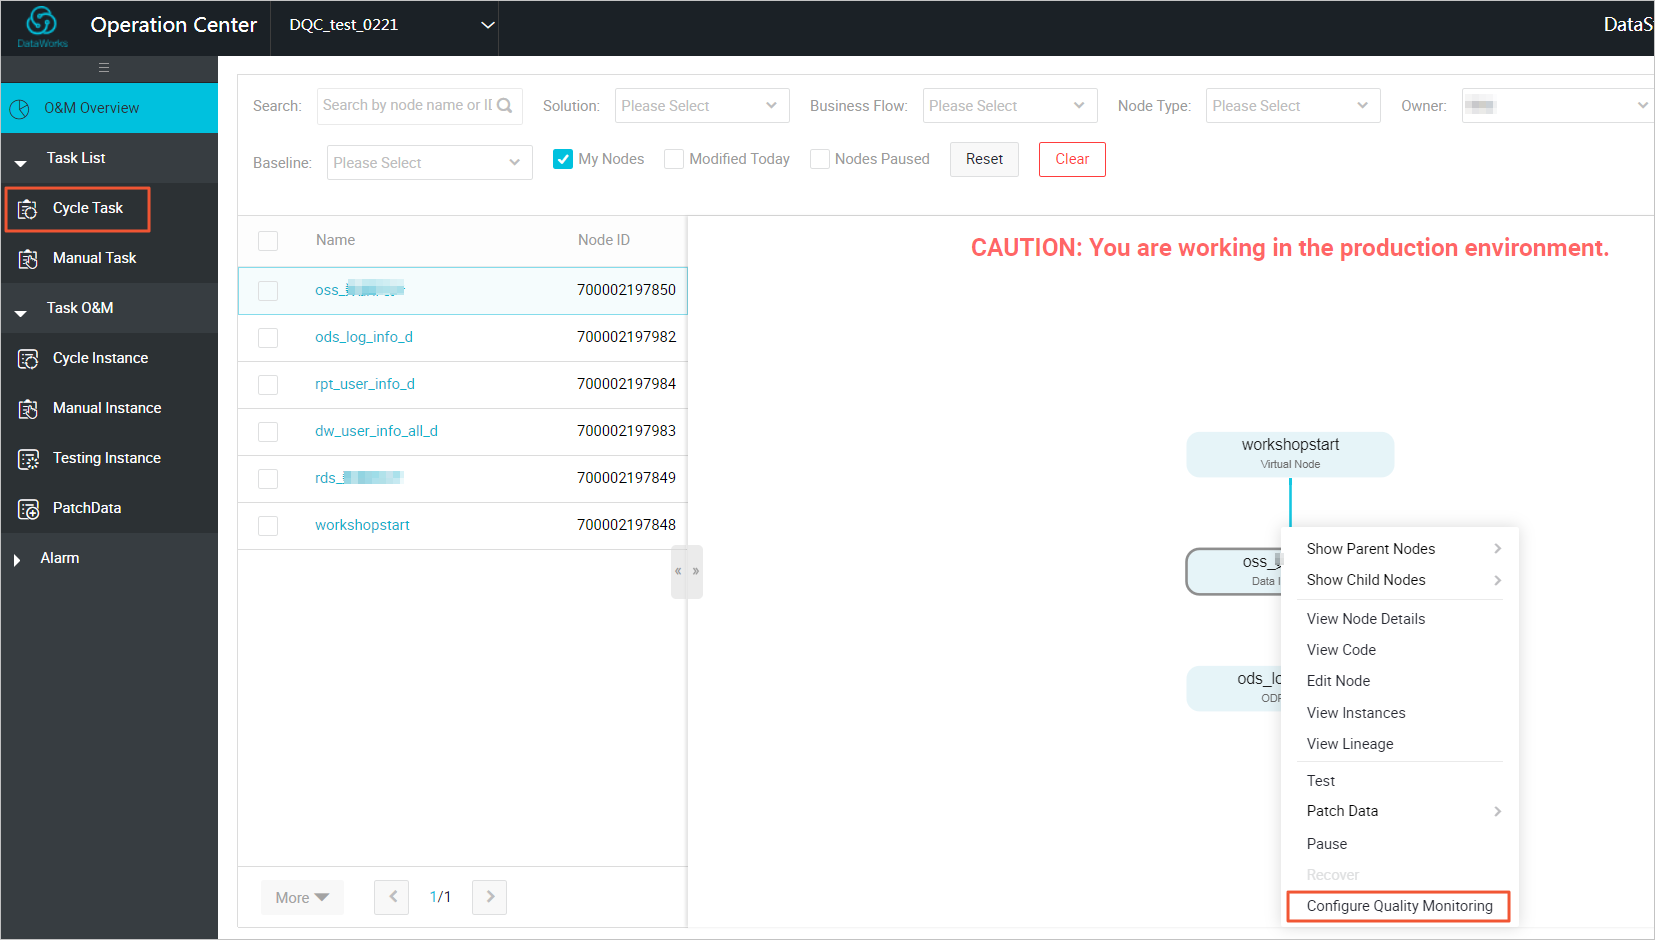
In Operation Center, locate the OSS_datasync task in Cycle Task, and right-click to select Configure Quality Monitoring.
Enter the monitored table name in the burst window, as well as the partition expression. The table entered here is named as ods_user_info_d and the partition expression is dt = $ [yyyymmdd-1].
After the configuration is completed, as shown in the figure below.
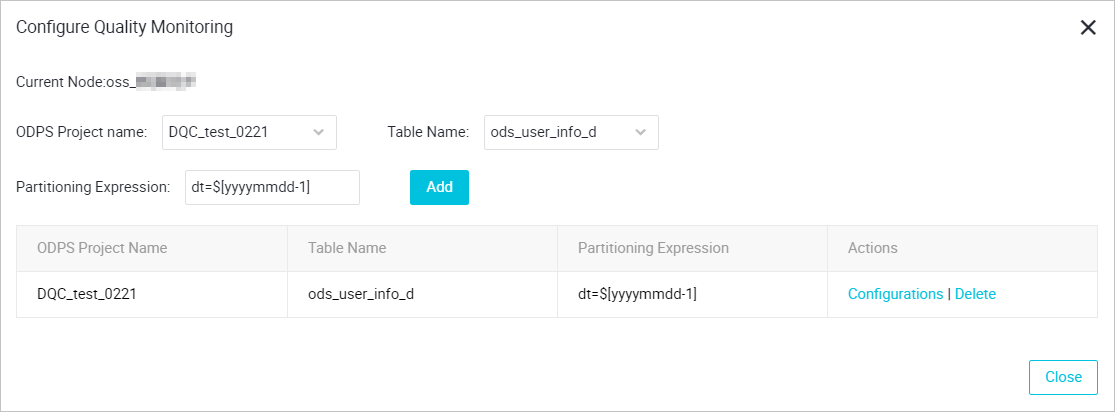
Click Configurations to quickly go to the rule configuration interface.

After the associated scheduling, every time the scheduling task is run, the data quality verification is triggered. Data quality supports setting up rule subscriptions, and you can set up subscriptions for important tables and their rules, set up your subscription to alert you based on the results of the data quality check. If the data quality check results are abnormal, notifications are made based on the configured alarm policy.
Click Subscriptions to set up subscription methods. Email notifications, Email and SMS notifications are currently supported.

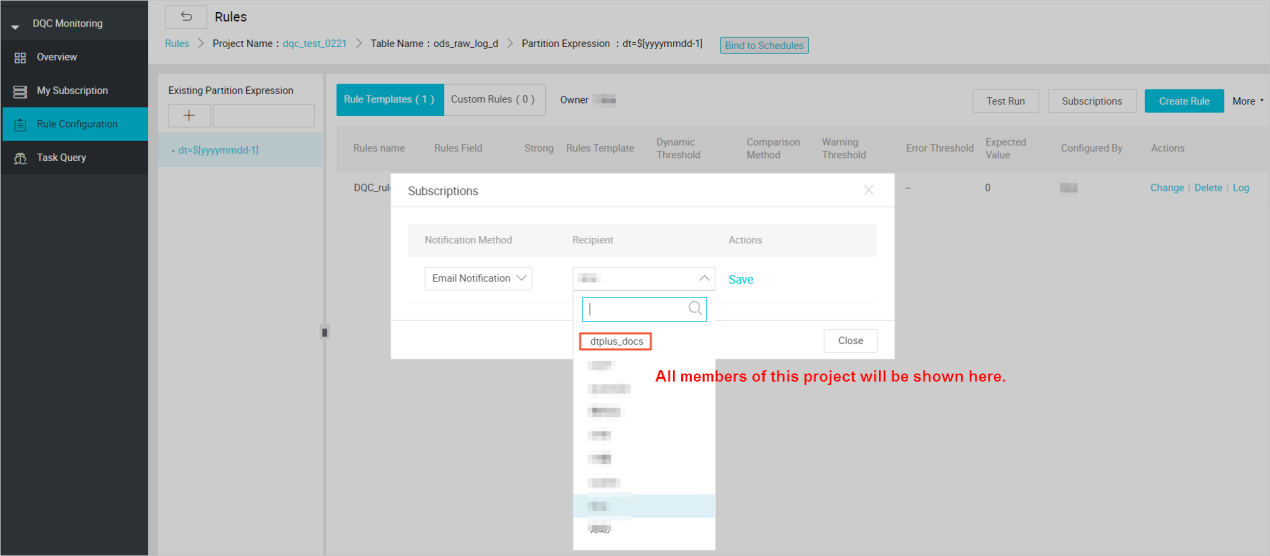

After the subscription management settings are set up, you can view and modify them in My Subscription.

It is recommended that you subscribe to all rules so that the verification results are not notified in a timely manner.
ods_user_info_dThe data in the ods_user_info_d table is from RDS database. When you configure rules, you need to configure the table to check the number of rows and the unique validation of the primary key to avoid duplication of data.
Similarly, you need to configure a monitoring rule for a partition field first, and the monitoring time expression is: dt = $[yyyymmdd-1]. After successful configuration, you can see a successful partition configuration record in the partition expression that has been added.

After the partition expression is configured, click Create Rule on the right to configure the validation rules for data quality. Add monitoring rules for table rows, rule intensity is set to strong, comparison mode is set to expectations greater than 0.
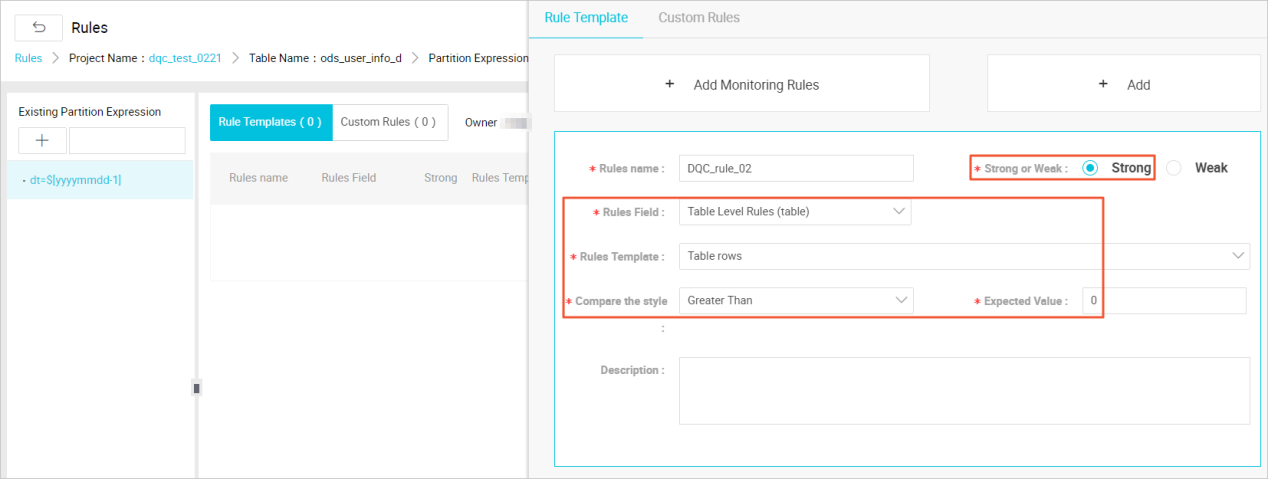
Add column-level rules and set primary key columns to monitor columns. The template type is: the number of repeated values in the field is verified, and the rule is set to weak, the comparison mode is set to a field where the number of duplicate values is less than 1. After the setting is completed, click the Save button.
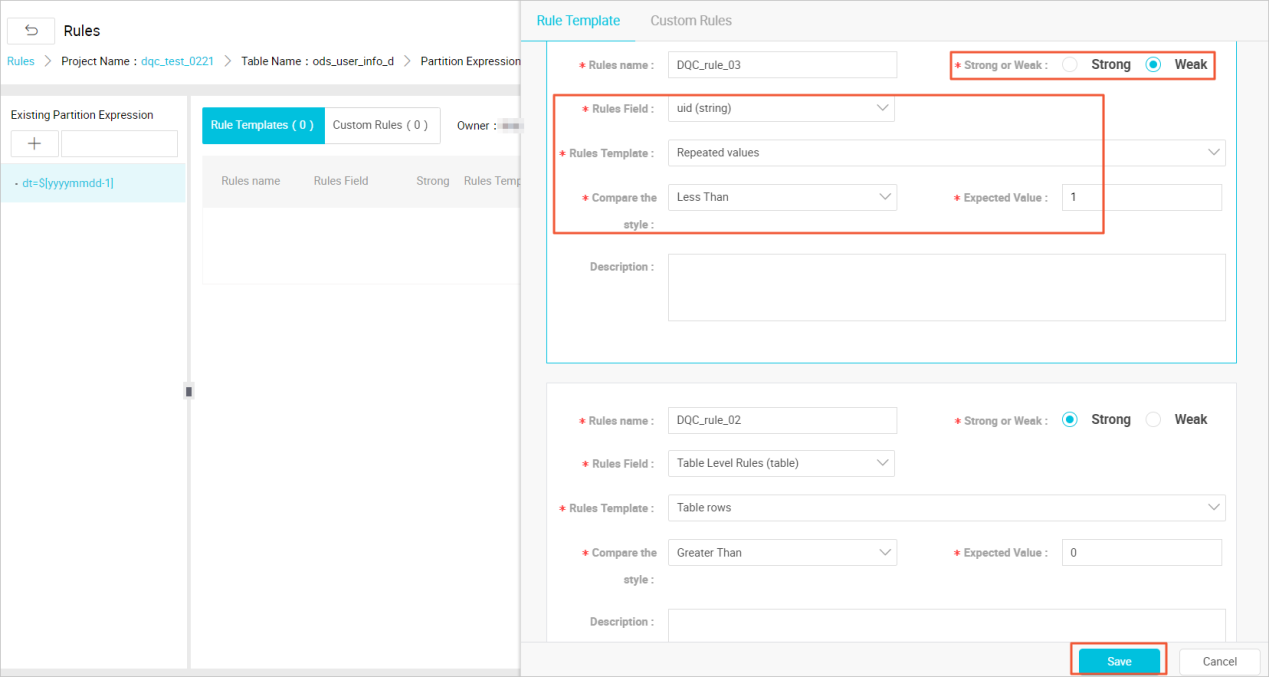
This configuration is primarily designed to avoid duplication of data which may result in contamination of downstream data. Pay attention: don't forget to try Test Run > Bind to Schedules > Subscription.
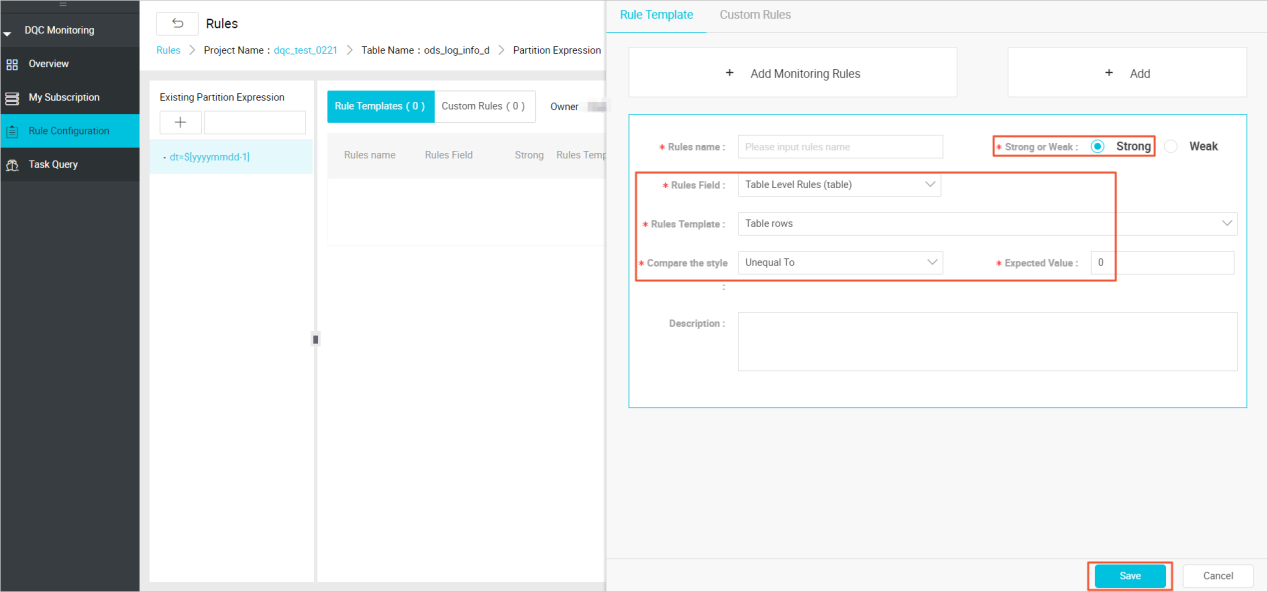
ods_log_info_dThe data of this ods_log_info_d table mainly is the analysis of the data in the table. Because the data in the log cannot be configured for excessive monitoring, you only need to configure the validation rules that is not empty for the table data. The partition expression for the first configuration table is: dt = $[yyyymmdd-1].

The configuration table data is not an empty calibration rule, and the rule strength should be set to strong. The comparison is set to an expected value of not equal to 0, and after the setup is complete, click the Save button.
dw_user_info_all_dThis dw_user_info_all_d table is a summary of data for both the ods_user_info_d table and the ods_log_info_d table, because the process is relatively simple, the ODS layer is also configured with a rule that the number of table rows is not empty, so the table does not have the data quality monitoring rules configured to save on computing resources.
rpt_user_info_dThe rpt_user_info_d table is the result table after the data aggregation. Based on the data in this table, you can monitor the number of table rows for fluctuations, and verify the unique values for primary keys. Partition expression for the first configuration table: dt = $[yyyymmdd-1].

Then you may configure the monitoring rules: Click Create rule on the right, and click Add Monitoring Rules to monitor columns. The number of repeated values in the field is verified, and the rule is set to weak. The comparison style is set to field repeat values less than 1.

Continue to add monitoring rules.
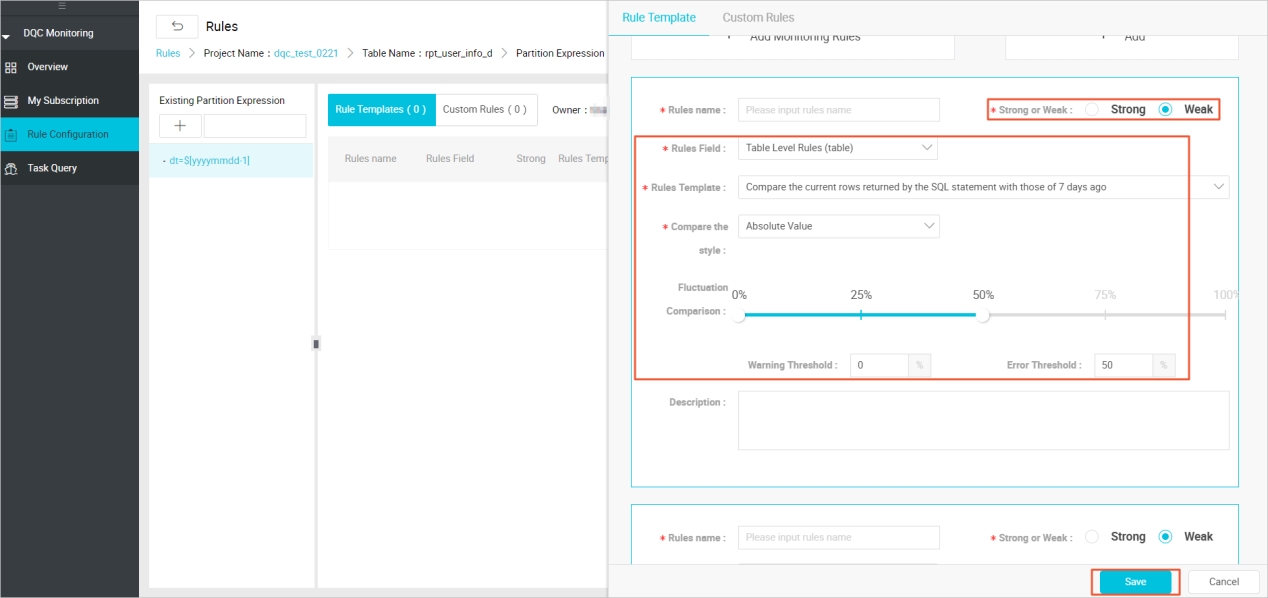
Here you monitor the number of table rows mainly to view the daily UV fluctuations in order to keep abreast of application dynamics.
As you may notice, the lower are the tables in the data warehouse, the more times the strong rules are set. That's because the data in the ODS layer is used as the raw data in the warehouse and you need to ensure the accuracy of its data, avoiding poor data quality in the ODS layer, and stop it in time.
Data quality also provides an interface for task queries on which you can view the validation results for configured rules.

2,593 posts | 794 followers
FollowAlibaba Cloud Community - March 29, 2022
Alibaba Cloud MaxCompute - May 30, 2019
Alibaba Clouder - March 9, 2021
Alibaba Clouder - May 12, 2021
Alibaba Clouder - February 11, 2021
Alibaba Cloud Community - March 29, 2022

2,593 posts | 794 followers
Follow MaxCompute
Conduct large-scale data warehousing with MaxCompute
Learn More DataWorks
A secure environment for offline data development, with powerful Open APIs, to create an ecosystem for redevelopment.
Learn More OSS(Object Storage Service)
An encrypted and secure cloud storage service which stores, processes and accesses massive amounts of data from anywhere in the world
Learn MoreMore Posts by Alibaba Clouder