By SIG for OpenAnolis system operation & maintenance
System operation and maintenance require stable business operation and maximize the use of resources. Therefore, the evaluation of application performance is an important part. As a powerful weapon for system operation and maintenance, SysAK has this ability. However, the diagnosis of application performance is more difficult than stability, and non-professionals cannot deal with it. This article introduces SysAK's methodology and related tools for performance diagnosis from a wide range of performance diagnosis practices.
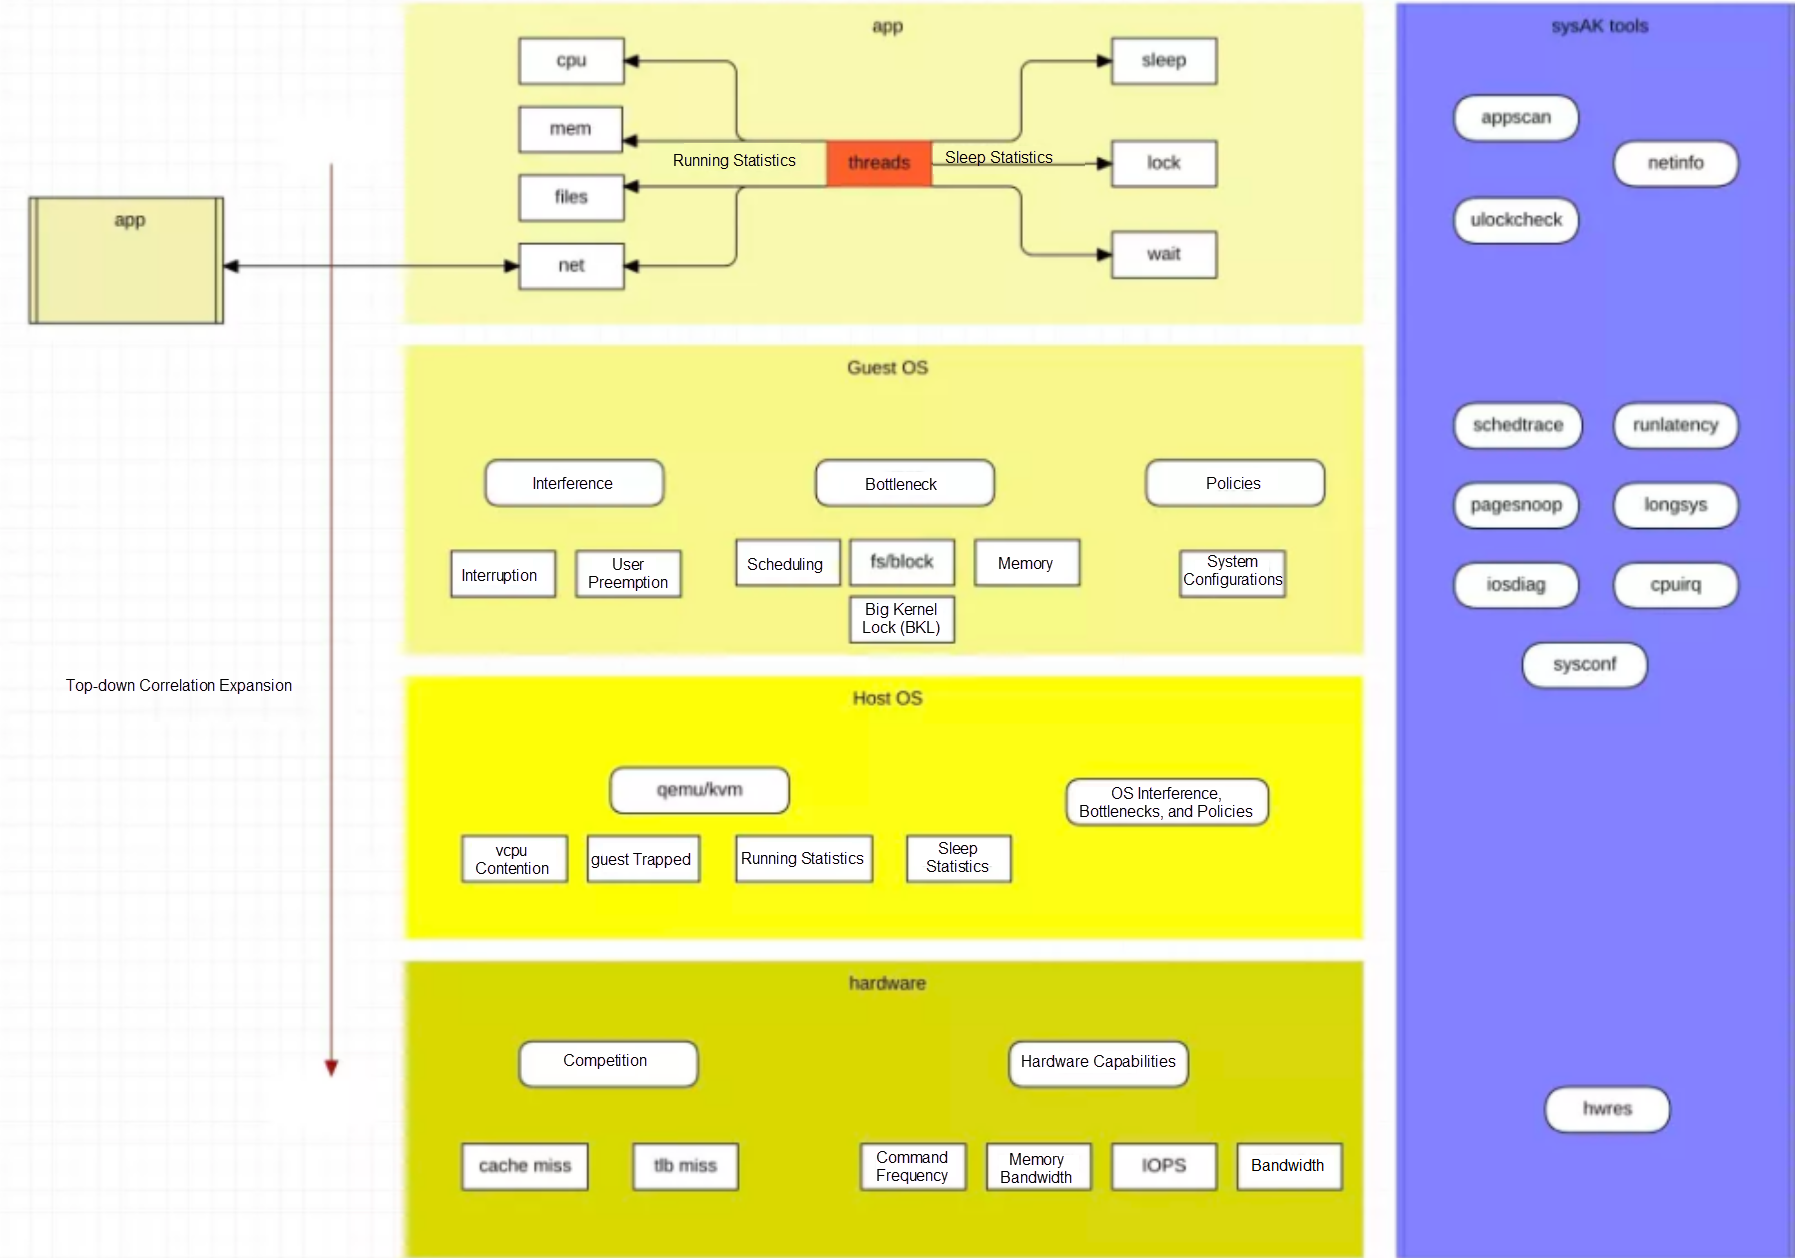
In short, the basic idea for SysAK to diagnose application performance is top-bottom and correlation expansion.
From top to bottom is application -> OS -> hardware, and association expansion includes peer applications, system impact, and network topology. It is simple to say, but it is a big project to implement.
The first thing to do is create an application profile, including its business throughput and system resource usage. Then, conduct a special analysis one by one based on the performance bottleneck that accounts for a large proportion of the profile. Specifically, it includes statistics on the concurrency, operation, and sleep of the application. The concurrency is simple. You need to count the number of business tasks, which is mainly used as a reference for the following resources.
Operational statistics refer to the classified statistics on the utilization of system infrastructure resources. The basic resources occupied by the application run time are in four categories:
We can know whether the throughput of the application is high through the CPU occupation. We can know whether the business run time is more about the business or the use of kernel resources through the CPU proportion of user/sys. Therefore, the run time length and the respective proportions of user and sys are included here at a minimum. If the proportion of sys is high, you need to continue to analyze whether the corresponding kernel resources are abnormal. Otherwise, you need to analyze whether there are bottlenecks in hardware resources.
Memory usage is used to determine whether memory application and access are factors that restrict business performance. Therefore, statistics on the total amount of memory allocation, frequency, number of missing pages, number of visits across NUMA nodes, and size are included here at a minimum.
File access is used to determine whether file IO is a factor that restricts business performance. Statistics on the read/write frequency, pagecache hit rate, and average I /O latency are included here at a minimum.
The message traffic is used to determine whether the network is a factor that restricts service performance. The traffic statistics and the network topology of the peer link must be included at a minimum.
If sleep time accounts for a large proportion of the application running cycle, it is likely to be a key factor affecting business performance. At this time, it is necessary to analyze the sleep details. Data statistics for at least three types of behaviors must be included, including the number and duration of specific behaviors:
System kernel resources constraints on application performance can be divided into three categories.
There are many interference sources for application operation during the operation of a server operating system, but the interference may not affect the service. Therefore, at least the frequency and running time of these interference sources need to be included to evaluate whether they are key factors.
The statistics of the following interference sources must be included at a minimum:
If the frequency of a certain type of interruption is high or concentrated in a certain CPU, or if a single operation is long, the performance of the service may be affected. You can perform operations (such as breaking and binding) on the interruption and observe the effect.
Too many system timers may also cause delays to wake up the process. You can analyze whether the process uses a large number of high-precision timers.
There is a burst increase in network traffic, etc.
The system has a wide variety of kernel resources. Different application models may have different dependencies on kernel resources. Bottlenecks cannot be fully covered, but several types of common kernel resources must be included at a minimum:
This can indicate whether the business process /thread is concurrent or whether the binding of cores is unreasonable.
There may be different bottlenecks for different file systems or devices and IO scheduling algorithms. These need segment statistical delay to determine.
Affected by memory usage and fragments, the latency of memory allocation may be large.
The overhead of memory requests, remaps, and tlb flush caused by memory page shortages is large. If it frequently enters the pagefault process, optimizing application policies may be a good choice, such as pre-allocating memory pools and using huge pages.
The lock is an inevitable mechanism. Kernel-state lock contention causes the CPU of the sys state to rise, which requires specific analysis in conjunction with the context.
The kernel resources mentioned before cannot be completely covered, but there is another way to observe some data. Since different kernel strategies may have relatively large performance differences, you can try to find out the different points of configuration by comparing different systems. The following is the usual system configuration collection:
When the bottleneck point cannot be found, or we want to mine the residual value of performance, we usually focus on the hardware side. Currently, the business is deployed on the cloud, so before going deep into the hardware layer, the virtualization layer or host side is a necessary factor. The preceding methods can be reused for the system kernel resource constraints for the performance analysis of the host side, but things can be done less for the business profile. Compared with the application business, the logic of the virtualization layer will not change indefinitely. We can learn about the virtualization solutions provided by cloud vendors from various channels. Currently, the mainstream is the Linux kvm solution. Therefore, we can make a specific analysis of the technical points of kvm. The statistics should include:
The preemptive frequency and time of qemu threads, the frequency and events of guest trapping, and the running time of qemu threads on the host.
These are used to determine whether the performance loss is due to the virtualization layer or whether there is a possibility for improvement.
When the diagnostics come to the hardware layer, it is usually because more optimization space fails to be found simply from the application layer or the system layer. There are two ideas. One idea is to look at the point of hardware utilization to see if the application can be adjusted in the opposite direction to reduce dependence on or disperse the hot spots of hardware use. The other idea is that when the application cannot be adjusted, evaluate whether the performance of the hardware has reached the bottleneck. A set of methodology can be extended for the former. For example, Ahmed Yasin's TMAM does not extend too much in sysAK, but there is still necessary work to complete. In addition to data collection such as cache, tlb miss, and cpi, the more important thing is how to analyze these data in combination with the operation of the application process. For example, there is more competition for cache or bandwidth on the same CPU, which is due to the current business's program design. There are still other processes caused by contention, which can be optimized through technologies, such as binding cores and rdt.
It's not over yet. There is still a missing part. Currently, most applications are not alone, and interactive applications will have performance impacts. Therefore, we use the topology of the network connection mentioned above in the application profile. We can copy all the preceding performance diagnostic methods on the objects that interact with the current application.
Let's summarize this article with a picture:

The tools involved in the figure will appear in the following articles. Stay tuned for more information!

105 posts | 6 followers
FollowOpenAnolis - February 13, 2023
OpenAnolis - September 21, 2022
Alibaba Cloud Community - May 27, 2022
OpenAnolis - October 26, 2022
OpenAnolis - August 9, 2022
OpenAnolis - April 7, 2023

105 posts | 6 followers
Follow Bastionhost
A unified, efficient, and secure platform that provides cloud-based O&M, access control, and operation audit.
Learn More Managed Service for Grafana
Managed Service for Grafana displays a large amount of data in real time to provide an overview of business and O&M monitoring.
Learn More Elastic High Performance Computing
A HPCaaS cloud platform providing an all-in-one high-performance public computing service
Learn More Cloud Parallel File Storage
The fully-managed scalable parallel file system can meet your requirements on high-performance computing.
Learn MoreMore Posts by OpenAnolis