
By System O&M SIG
ECS users generally arrange some regular system metrics of monitoring and observation or business metrics in the cloud environment. Although these metrics can be used to monitor system or application exceptions, they cannot help users fully understand what the system or application is doing to cause exceptions. Common examples include:
When we are at a loss, we think there is a problem with the system. However, after troubleshooting the system problems, it is often found that the application is barbarously consuming the system resources, and some of these applications are businesses themselves. Others are hidden among the thousands of tasks in ps-ef, hard to spot. Therefore, we want to observe the running behavior of the system/application through profiling to help users solve problems.
Profiling can be considered a dynamic way to observe the execution logic of a program. This program can be as large as an operating system or an infrastructure. (Interested students can read the following content [1].) It can be as small as a pod or a simple application. If you add a one-time dimension to this method and continuously make observations in the form of profiling, you can track the problems of occasional anomalies in the system resources mentioned above and other problems without waiting for the problems to appear.
Different programming languages have different profiling tools, such as pprof (of Go) and jstack (of Java). Here, we want to observe the application but put aside the difference in languages. Therefore, we use eBPF to obtain program stack information. The stack information here includes all the information of an application's execution in user mode and kernel mode. The advantage of using eBPF is that we can control the profiling process: frequency, runtime security, small system resource usage, etc.
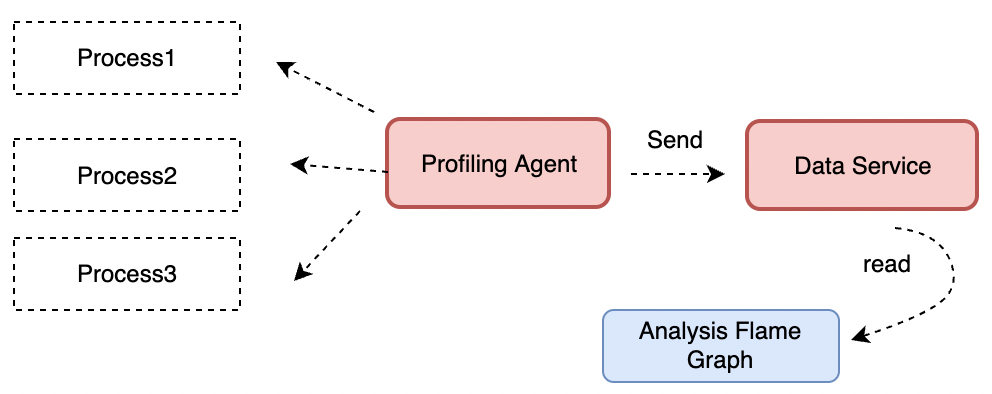
As shown in the following figure, we can regularly obtain the execution stack information of applications through eBPF and Performance Monitoring Unit (PMU) events and use the bpf map to make statistics on the stack information of each application. With the help of our early open-source Coolbpf (please see Coolbpf Is Open-Source! The Development Efficiency of the BPF Program Increases a Hundredfold), we have made relevant adaptations to different kernel versions. Please see the following for specific executable versions.
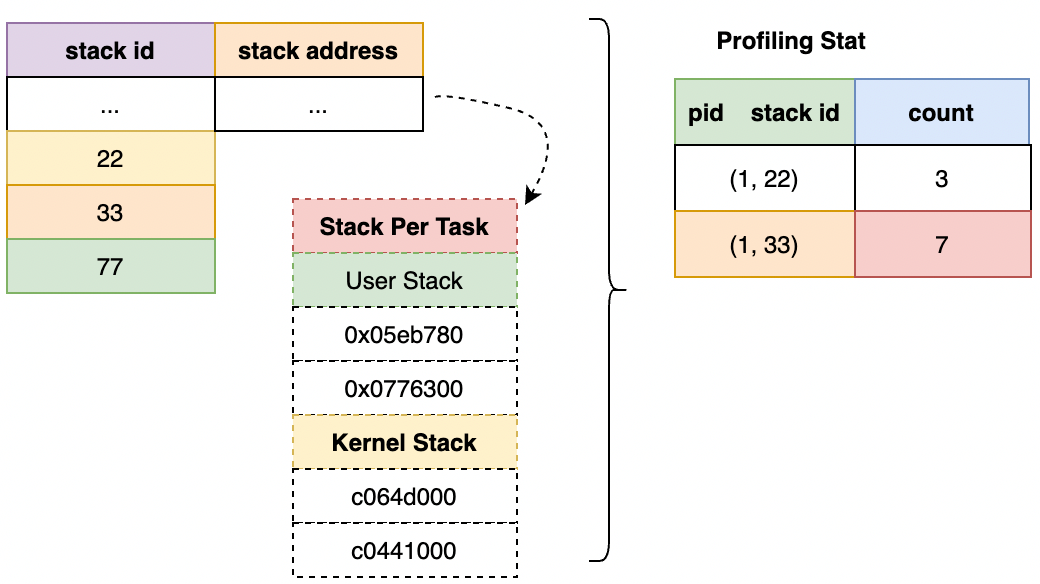
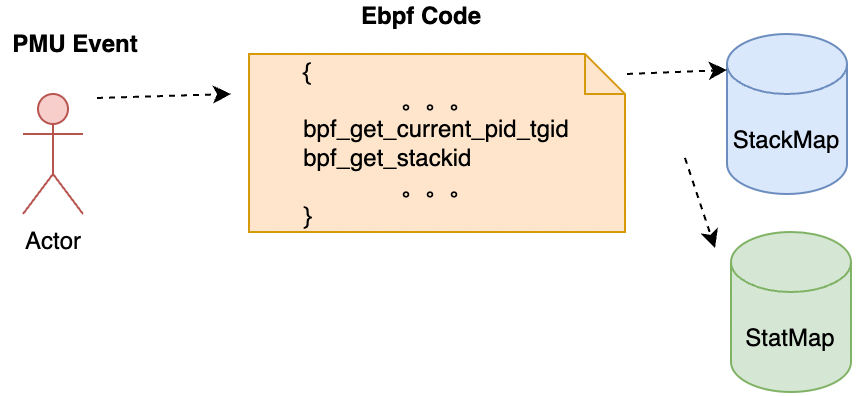
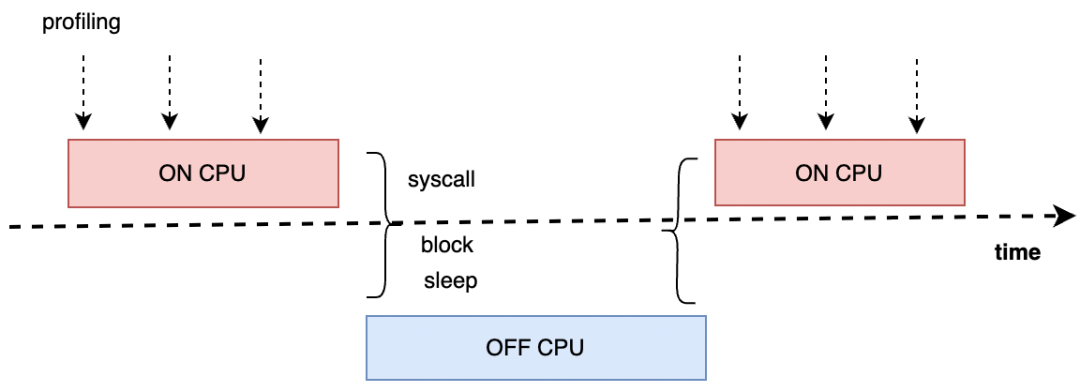
The runtime status of a program can be summarized as executing and not executing, namely on cpu and off cpu.
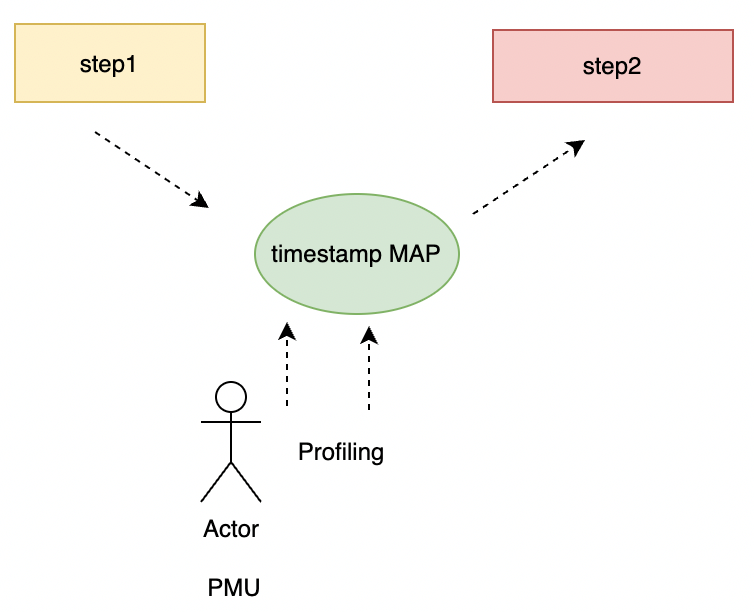
For common problems (such as network jitter), we do the following in two stages of receiving the packet:
We adopt c/s architecture as a whole. In daily problem positioning, we only need to deploy agents to be responsible for profiling, and we view data on the server side. At the same time, slice the profiling data, periodically take the data from the map, and clear the sampling data of the previous cycle of the map to ensure that we see the profiling results of the corresponding time period when we view the data playback. Considering users' requirements for data security in the cloud environment, we can also use SLS to complete data uploads.
You can use this feature in SysOM with two ways:
If you want to observe the system continuously, you can use the profiling function in monitoring mode. The corresponding path is: Monitoring Center → Machine IP → General dashboard → sysom-profiling.
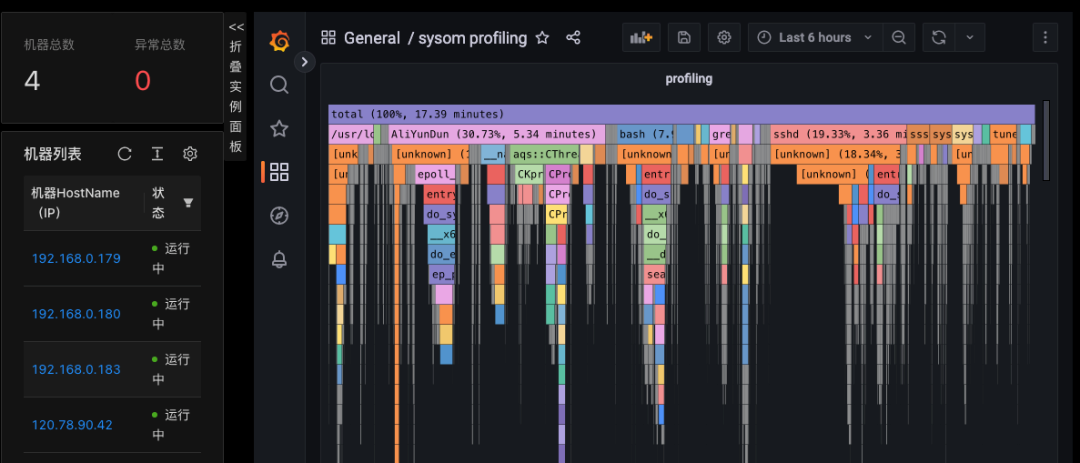
If you want to obtain some conclusive information about profiling, you can use the diagnostic mode. The corresponding path is: Diagnostic Center → Scheduling Diagnostic Center → Application Profile Analysis.
The CPU usage percentage of the top 10 applications will be counted, and the hotspot stack information will be displayed at the same time. The percentage of hotspot stack information in the application is also collected. Finally, the hotspot stack is analyzed to make it clear whether the hotspot stack is in the application itself or in the OS.

The preceding section shows the panel information of on cpu. The panel information of other profiling features is being continuously adapted. The specific profiling function can be obtained by executing the raptor under the unified monitoring directory of sysAK. In addition to the function items, the running mode can be set.

| General Mode | Trigger Mode | Filter Mode |
| Profiling is triggered regularly. Profiling is performed every five minutes by default. | Specify the metric threshold. This mode is triggered when metric exceptions occur. | Specify the application or CPU. This mode is suitable for scenarios where abnormal applications are specified or problems only occur on specific CPUs that applications are bound to. |
CentOS 7.6 or later, Alinux2/3, Anolis, and ARM architecture
The ECS monitoring graph is listed below:
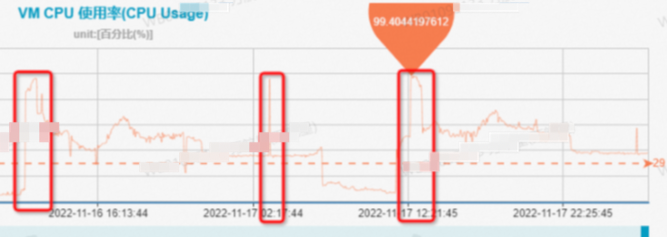
Due to intermittent jitter, it is difficult to catch the scene by conventional means. After performing profiling on the system for one day, it is found that the Nginx application occupies the most CPU resources on the system during the jitter time, and Nginx is mainly doing packet receiving and sending. The problem is solved after users optimize the distribution of business traffic requests.


The user monitoring graph is listed below:
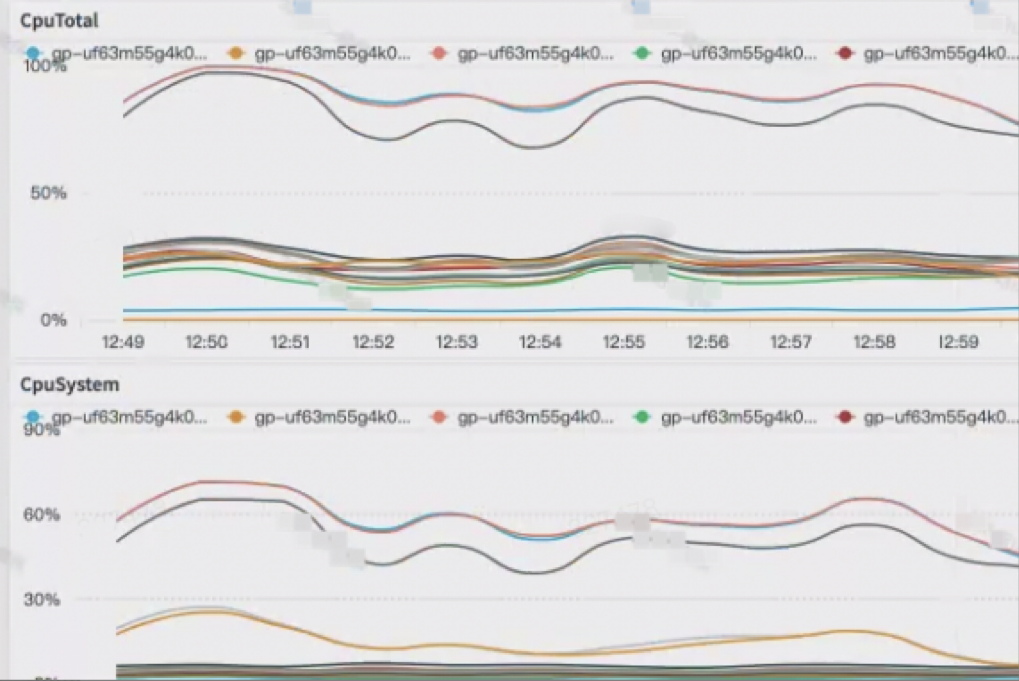
After performing profiling on the system for observation, it is found that a cachestat script starts the ftrace function. This script is not stopped in time after the previous developers locate problems and deploy it. After the script was stopped, the system returned to normal. Since ftrace is not enabled through the sysfs directory, the ftrace of sysfs is not changed.


The user monitoring graph is listed below:
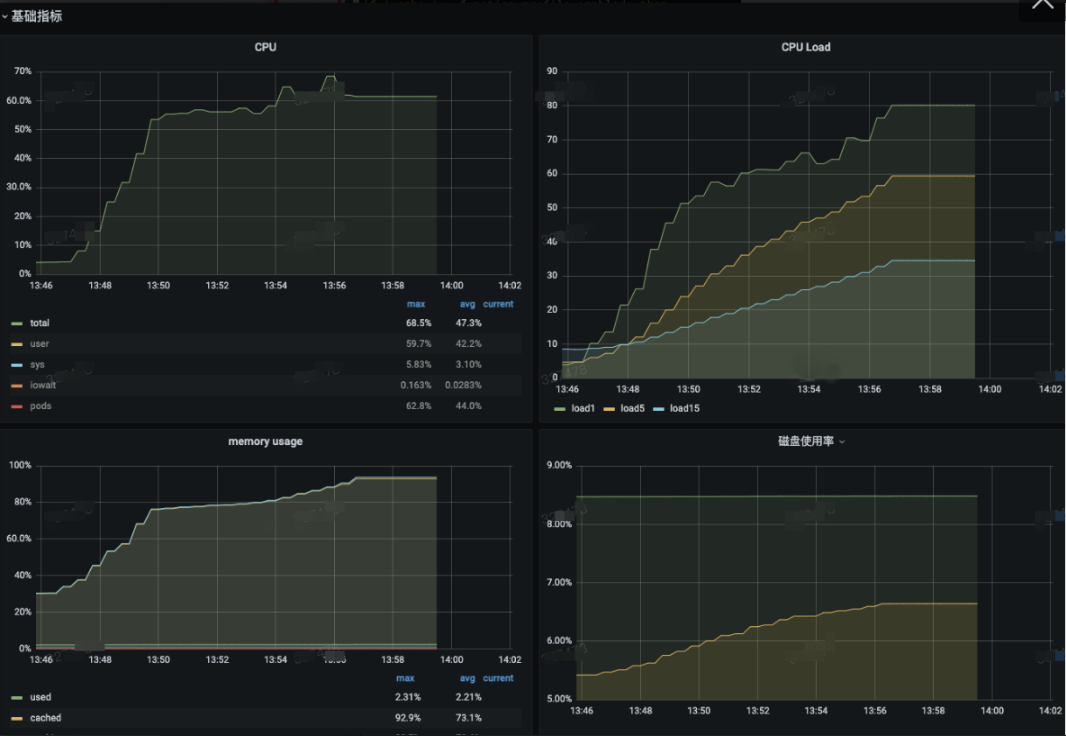
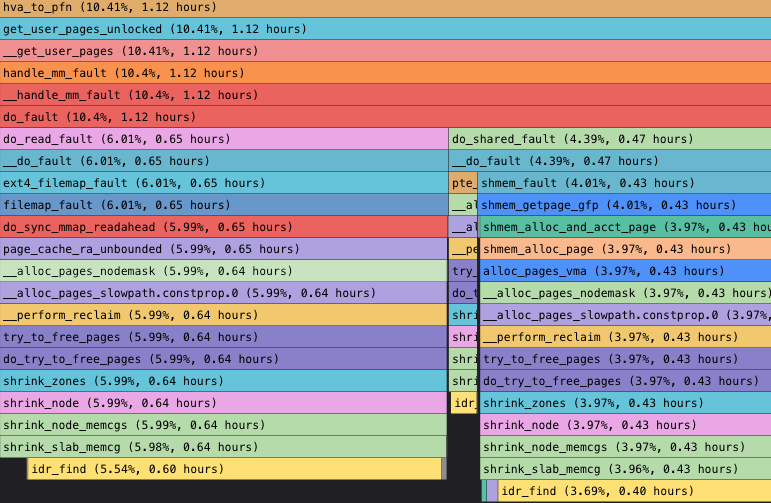
According to experience, it is generally suspected that all these problems (including ssh login failure, CPU index anomaly, and memory pressure) are caused by the system doing memory reclaim. However, it is usually impossible to get the first on-site evidence, so this speculation is not convincing. We caught the first scene Through profiling after one-day deployment. At 13:57, the CPU usage was extremely high, and the line rose from the ground. According to the system behavior, the kernel occupied the CPU for memory reclaim, and users were advised to optimize the memory usage of the application. This issue can be regarded as a classic issue in the cloud environment.
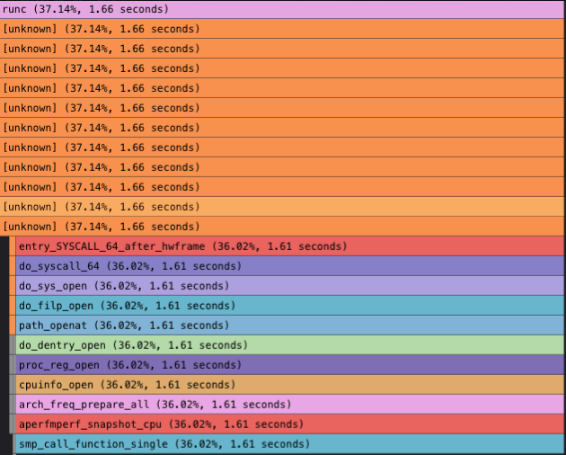
The ping host occasionally has a second-level delay jitter, and individual CPU sys is occasionally occupied up to 100%.

Since it is a short jitter of individual CPUs, we perform profiling on the execution status on a certain CPU. We can see at the time when network jitter occurs, runc is reading the /proc/cpuinfo information, and there are hotspots in the "smp_call_function_single" call among cores, which is consistent with the phenomenon of occasional high usage of sys. Finally, containers cache and back up cpuinfo information to reduce access to /proc/cpuinfo and relieve system pressure. The access to /proc/cpuinfo has also been partially optimized in the high-version kernel. Please see [4] for the relevant patch.
SysOM is committed to building an automated O&M platform that integrates host management, configuration deployment, monitoring and alarm, exception diagnosis, security audit, and other functions. The article above is an introduction to SysOM profiling. Only some cases are presented. The related functional modules have been verified and are being open-sourced. Please look forward to it.
Please see our Gitee open-source O&M repository for more O&M technologies:
SysOM: https://gitee.com/anolis/sysom
SysAK: https://gitee.com/anolis/sysak
Coolbpf: https://gitee.com/anolis/coolbpf
[1] Google-Wide Profiling: A Continuous Profiling Infrastructure for Data Centers
[2] Observability Engineering
[3] http://www.brendangregg.com/perf.html
[4] https://www.mail-archive.com/linux-kernel@vger.kernel.org/msg2414427.html
Image Pulling Saves over 90%: The Large-Scale Distribution Practice of Kuaishou Based on Dragonfly
An Analysis of the Exploration and Practice of Python Startup Acceleration

105 posts | 6 followers
FollowAlibaba Container Service - November 15, 2024
Alibaba Container Service - July 25, 2025
Alibaba Cloud Native Community - August 25, 2025
OpenAnolis - April 20, 2026
OpenAnolis - January 21, 2025
OpenAnolis - June 25, 2025

105 posts | 6 followers
Follow Bastionhost
A unified, efficient, and secure platform that provides cloud-based O&M, access control, and operation audit.
Learn More Managed Service for Grafana
Managed Service for Grafana displays a large amount of data in real time to provide an overview of business and O&M monitoring.
Learn More CloudMonitor
Automate performance monitoring of all your web resources and applications in real-time
Learn More Simple Log Service
An all-in-one service for log-type data
Learn MoreMore Posts by OpenAnolis