By Garvin Li
A census is an official survey of a population that records the details of individuals in various aspects. Through census data, we can measure the correlation of certain characteristics of the population, such as the impact of education on income level. This assessment can be made based on other attributes such as age, geographical location, and gender. In this article, we will show you how to set up the Alibaba Cloud Machine Learning Platform for AI product to perform a similar experiment using census data.
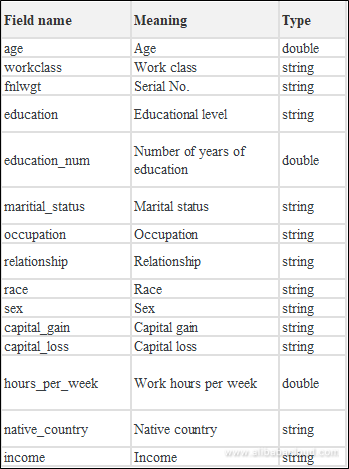
Data source: UCI open source dataset Adult is a census result for a certain region in the United States, with a total of 32,561 instances. The detailed fields are as follows:
On the Machine Learning Console home page, select the census case and click Create from Template as shown below.
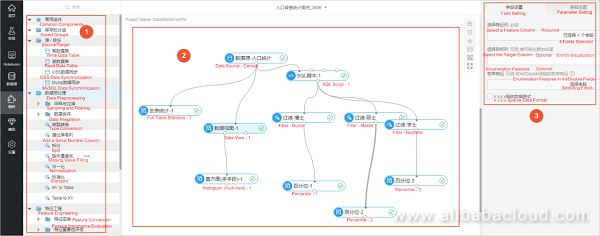
The experiment interface is as shown in the following figure.
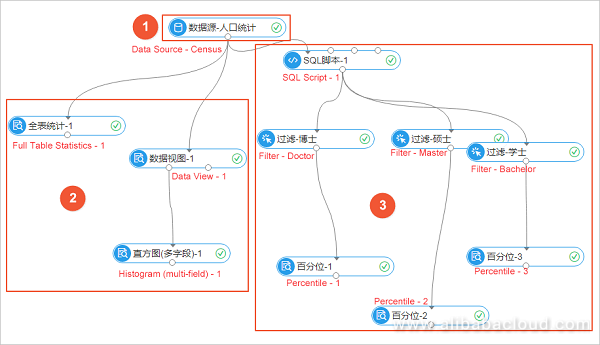
The experiment includes three parts, as shown in the following figure.
The first part relates to the data source preparation, the second part relates to the data statistics, and the third part relates to the impact of education on income.
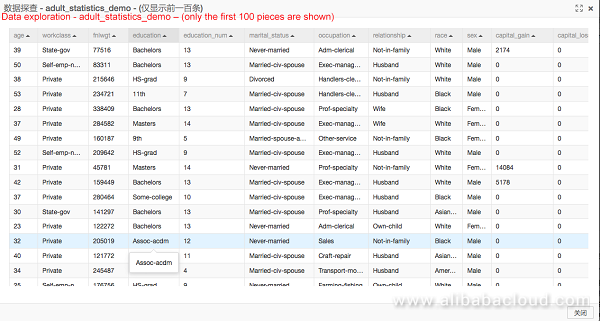
Upload the data to MaxCompute via machine learning IDE or Command line tool Tunnel. Read the data through the Read Table component (Data source - Demographics in the figure). Then right click on the component to view the data, as shown below.
Through the full table statistics and numerical distribution statistics (data view and histogram component in the experiment), it can be determined whether a piece of data conforms to the Poisson distribution or the Gaussian distribution, and whether it is continuous or discrete.
Each component of Alibaba Cloud Machine Learning provides result visualization. The figure below is the output of the histogram component of the numerical statistics, in which the distribution of each input record can be clearly seen.
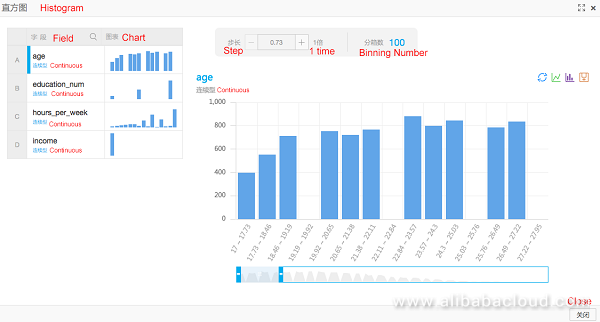
Through feature extraction, machine learning algorithms are used to compute which factors have the greatest impact on income. This document simply analyzes the income of people with different education levels. The main purpose is to introduce the use of the machine learning platform.
As shown in the following figure, the first component the data passing through is the SQL script, which implements data preprocessing. This experiment converts the "income" field from string type into a binary form of 0 and 1. 0 means an annual income below 50K, and 1 means an annual income above 50K (digitizing text data is a common method in machine learning feature processing).
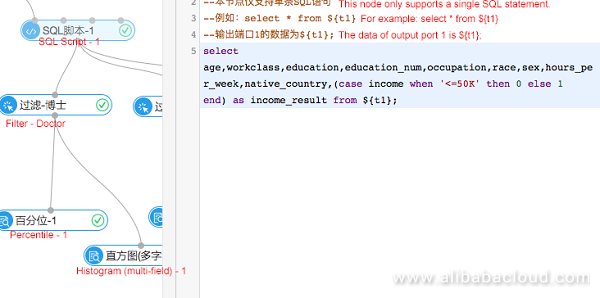
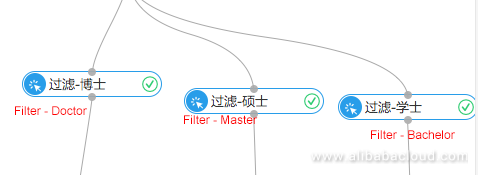
Through the filtering and mapping component, the data is divided into three parts based on the education, namely, doctor, master and bachelor, as shown in the following figure.
The filtering and mapping component supports SQL statements, and the user needs to fill in the "where" filter in the configuration bar on the right.
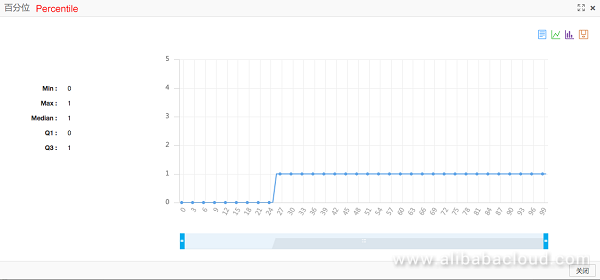
The income proportion under each class can be obtained through the percentile components. The following is the line chart presentation. It can be seen that the population with an annual income below 50K (dots with the value of 0) accounts for about 25% of the total number.
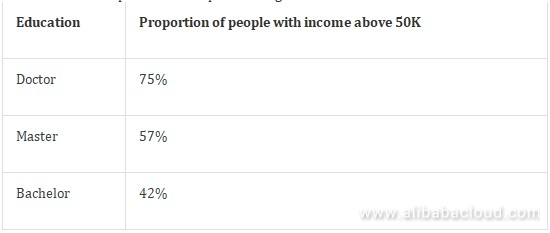
Combine the three percentile components to get the results shown below.
Visit the Alibaba Cloud Machine Learning Platform for AI page to experience Alibaba Cloud's machine learning capabilities today!
Scorecard Credit Scoring on Alibaba Cloud's Machine Learning Platform
Alibaba Cloud Machine Learning Platform for AI: Heart Disease Prediction
Alibaba Clouder - June 17, 2020
Alibaba Clouder - April 12, 2019
Alibaba Clouder - July 17, 2020
Alibaba Clouder - August 19, 2019
Nick Patrocky - September 13, 2022
Alibaba Clouder - June 25, 2018
 Platform For AI
A platform that provides enterprise-level data modeling services based on machine learning algorithms to quickly meet your needs for data-driven operations.
Learn More Epidemic Prediction Solution
This technology can be used to predict the spread of COVID-19 and help decision makers evaluate the impact of various prevention and control measures on the development of the epidemic.
Learn More Alibaba Cloud Model Studio
A one-stop generative AI platform to build intelligent applications that understand your business, based on Qwen model series such as Qwen-Max and other popular models
Learn More Offline Visual Intelligence Software Packages
Offline SDKs for visual production, such as image segmentation, video segmentation, and character recognition, based on deep learning technologies developed by Alibaba Cloud.
Learn MoreMore Posts by GarvinLi