By Jiaolong and Guyi
This article explores performance practices in the logging process through several technical points. Performance in the field of computers often follows the iceberg principle, where what is visible and what programmers perceive is only a small part, while a significant amount of details remains hidden beneath the surface.
The process of logging in a program involves writing the necessary content to a disk file. It can be compared to the logistics process, where goods are transported to their destination through a transportation system. However, in this logistics system, we usually don't have to handle the entire process of packaging, loading, transportation, and unloading. Instead, we can rely on professional logistics companies. Similarly, in the scenario of logging that we are going to discuss, the log content is the goods to be transported, the log framework is the logistics company, and the destination is the file on the disk (or other log collection server). In the Java language system, log frameworks such as log4j, logback, and jul (Java Util Logging) were developed early on to handle logging details for us. Programmers only need to use the Logger utility class to efficiently record business logs, as shown in the following code:
Logger logger = LogFactory.getLogger("PoweredByEDAS");

String product = "EDAS";
logger.info("This is powered by product: " + product);
This article aims to illustrate performance practices in the logging process through several technical points. Performance in the field of computers often follows the iceberg law, where what we see and what programmers perceive is only a small part, as many details are hidden beneath the surface. Referencing the figure below:
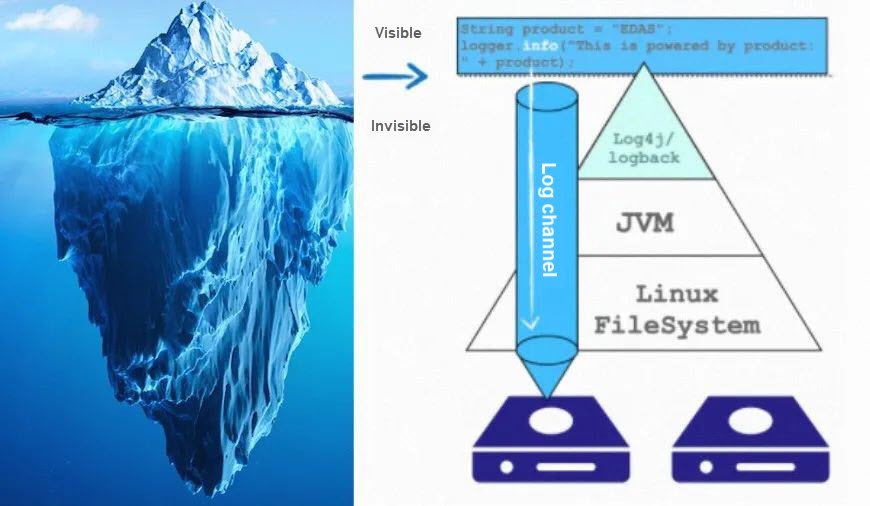
The figure above illustrates that when a programmer generates log content in the business code using logger.info, the log is sent to its destination: the disk. However, before being flushed to the disk, the log content goes through various layers of processing, including the log framework, JVM, and Linux file system. This can be compared to transferring goods at multiple stop stations along the way. The entire transportation system, consisting of vehicles, drivers, and roads, represents the "log channel" in the figure. This figure also provides us with ideas for systematic optimization, including avoiding channel congestion, reducing visible service overhead, and minimizing invisible system overhead.
In the transportation system, there are two main ways to avoid channel congestion:
1) Try to control the transportation flow.
2) Optimize the entire transportation system (such as by building more roads, and adding more information technology).
In the context of log output, programmers have control over the content of business logs and the configuration of log policies. However, a significant portion of system capabilities depends on the performance of the underlying infrastructure. As programmers, we should focus on optimizing what we can control and decouple what we cannot control. This is the main idea of this chapter.
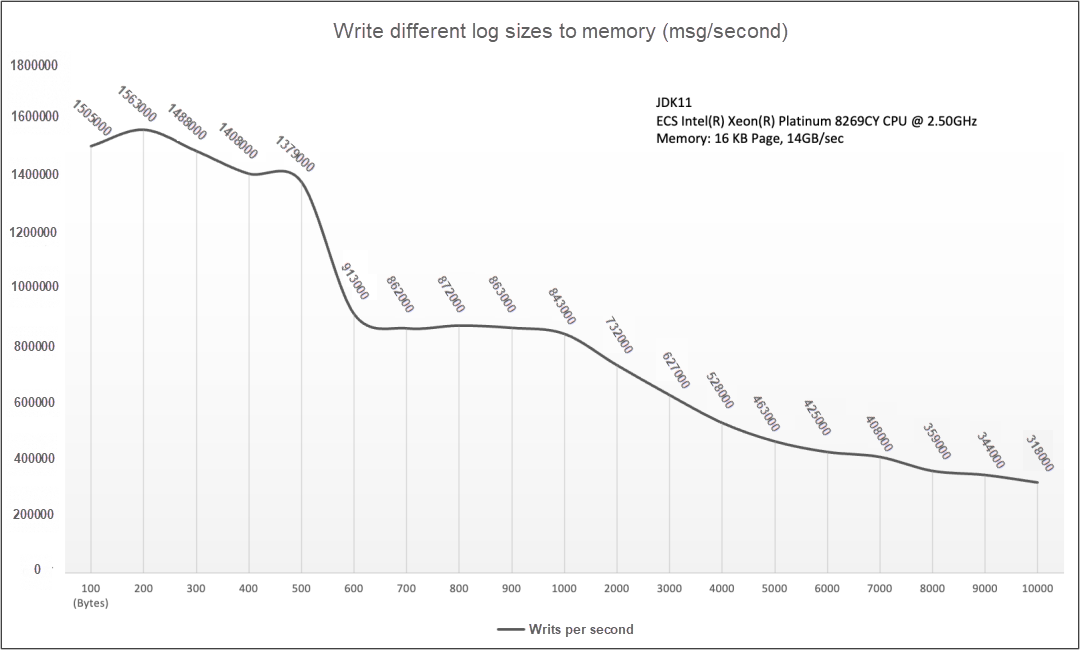
It is evident that larger log content places greater pressure on the entire system. To quantify this difference, we conducted the following test comparison:
• In the first group, we wrote logs of varying sizes to memory.
• In the second group, we wrote logs of varying sizes to disk files.
We use the CountingNoOp Appender in Log4j for writing logs to memory. This appender counts only the output logs during the actual log output process. To some extent, this testing method can measure the processing efficiency of a simple log framework.
<Appenders>
  <CountingNoOp name="NoOp">
  </CountingNoOp>
</Appenders>
From the test results presented in the following figure, we can see that even when the logs are not flushed, the throughput that is written decreases significantly as the size of the content gets larger.
In the test of the other group, we wrote different log sizes into disk files and made similar comparisons. From the experimental results, we can draw two simple conclusions:
The specific results are shown in the following figure:
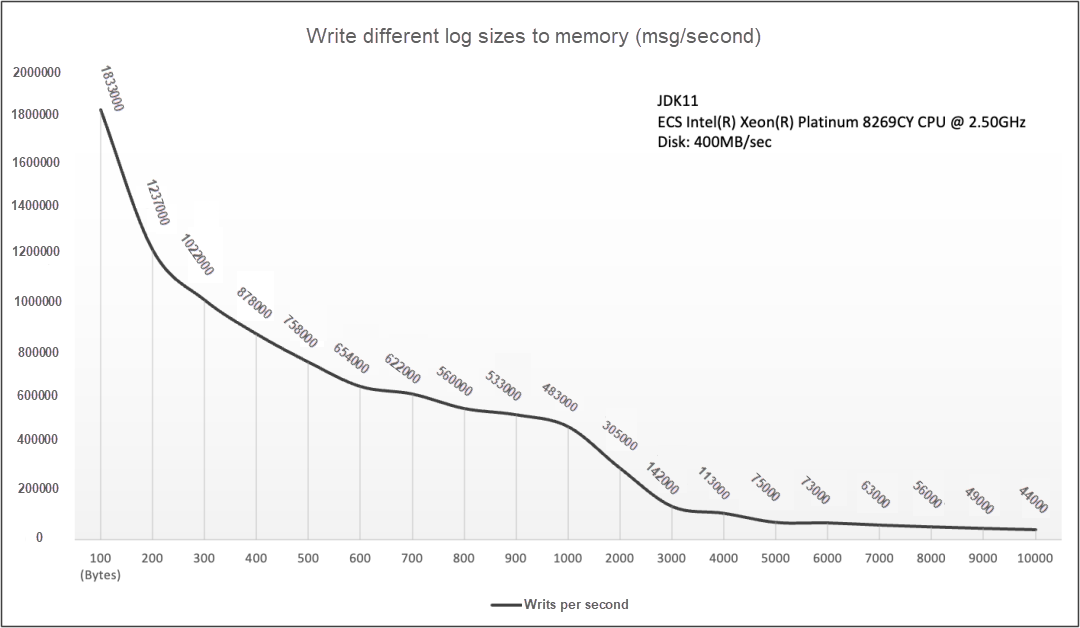
The data in the line chart was obtained at a speed of approximately 400 MB/s provided by an I/O device. When the I/O is not fully utilized, increasing the written content can still enhance the overall writing volume. However, once the device bottleneck is reached, further writing will lead to stacked written content.
Both sets of data lead us to the same conclusion: larger log text content results in longer processing time. Let's return to the transportation scenario in our daily lives. If the goods to be transported are exceptionally large, the transportation speed will be slower. Therefore, we need trucks with more space and stronger power. However, carrying heavy loads poses risks such as power imbalance and tire bursts. To improve transportation efficiency and safety, we should attempt to avoid transporting oversized cargo. Similarly, in the log scenario, large logs will also have varying degrees of impact on system resources such as CPU, memory, and I/O.
When obtaining a Logger for log output, most programmers directly use the Class object to obtain it. See the following code snippet:
package com.alibabacloud.edas.demo;

public class PoweredByEdas {
  private static Logger logger = LogFactory.getLogger(
        ProweredByEdas.class);

    public void execute() {
        String product = "EDAS";
        logger.info("Prowered by " + product);
    }
}
During log output, if the logger is Class, the default output is its corresponding FQCN, namely: com.alibabacloud.edas.demo.PoweredByEdas.
We can use the re-format of the logger to compress the output. For example, after using %logger{5} or %c{5} in logback for simplification, the logger will be compressed into c.a.e.d.PoweredByEdas during output, reducing the average number of characters per log by 19.
// Use the default [%logger] for output.
2023-11-11 16:14:36.790 INFO [com.alibabacloud.edas.demo.PoweredByEdas] Prowered by EDAS

// Use the default [%logger{5}] for output.
2023-11-11 16:24:44.879 INFO [c.a.e.d.PoweredByEdas] Prowered by EDAS
However, this type of log processing consumes additional CPU resources due to string splitting and interception. If the service is compute-intensive (with high CPU usage), this processing method is not recommended for production use.
Recording abnormal information plays a crucial role in troubleshooting when our system encounters problems or failures online. The comprehensiveness of this recording often directly affects the efficiency of problem-solving. However, excessive recording of abnormal information tends to overshadow the truly useful information. When we dissect the exceptions thrown in the system, it becomes clear that only a few lines of information in the stack trace can help us troubleshoot problems effectively, as shown in the following figure.
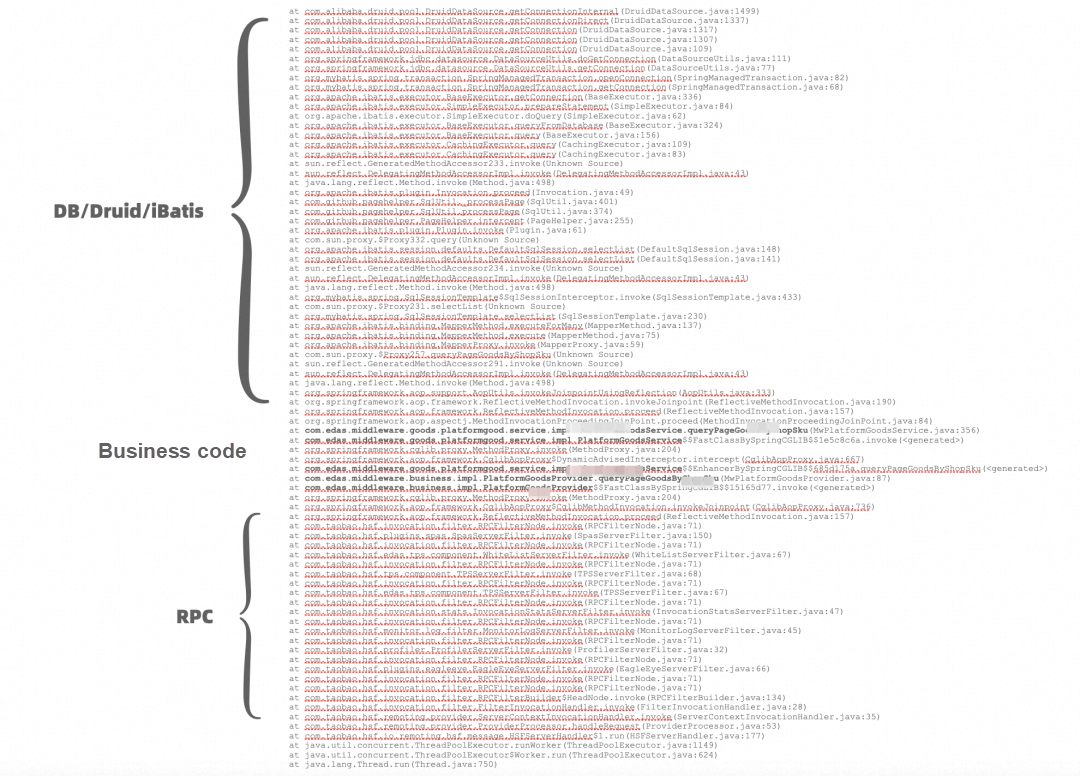
According to my experience, before directly printing out exceptions, we can try to retrace the exception stack and rearrange the information before outputting it. Here are some specific practices to consider:
Compressing exceptions not only improves performance but also saves significant storage space.
If reducing output is like reducing the load of goods, optimizing the log channel is akin to improving the overall transportation efficiency. Channel optimization depends on the state of the running system and the implementation of the framework being used. A significant portion of these processes is not controlled by programmers. For the aspects that cannot be controlled, the goal is to maximize decoupling from the underlying implementation. Here are two specific ideas to consider:
As shown in the following figure:
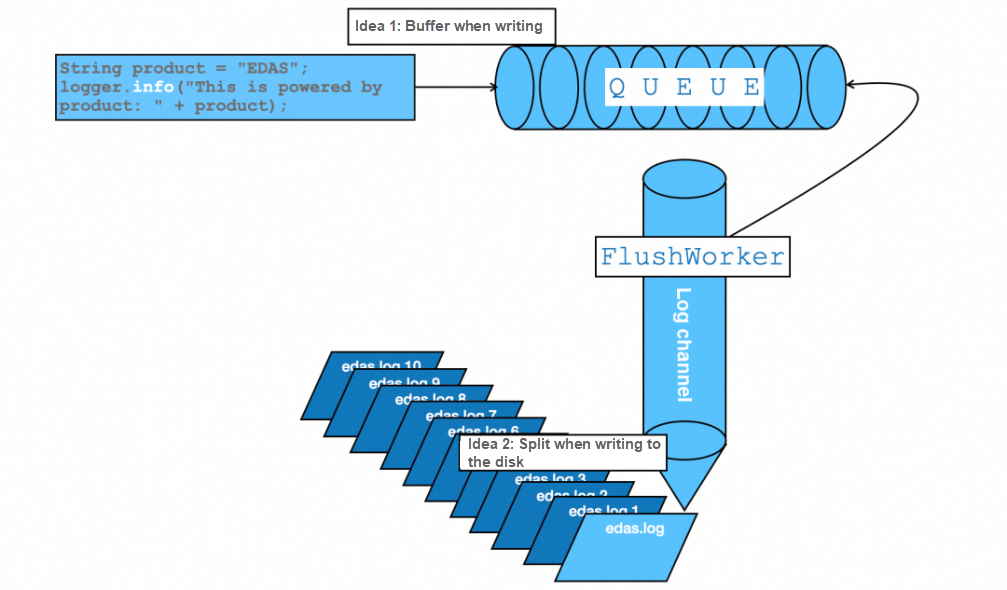
In the asynchronous method, the business code first puts the log content into a buffer, and then a dedicated thread asynchronously flushes it into the file system. This ensures that the throughput of the business is not affected by the underlying framework. However, whether all logs are suitable for asynchronous policies depends on the business scenario. For regular business logs, log discarding may not have much influence on the business. However, in scenarios that require strict data consistency, such as the Commit Log of RocketMQ, logs represent the delivery status of complete business messages and must be strictly consistent with the return of business status. In such cases, an asynchronous mode is not a good choice. In Log4j, there are two methods available: fine-grained Appender-level configuration and global configuration. The impact of three policies on performance throughput is shown in the following figure:
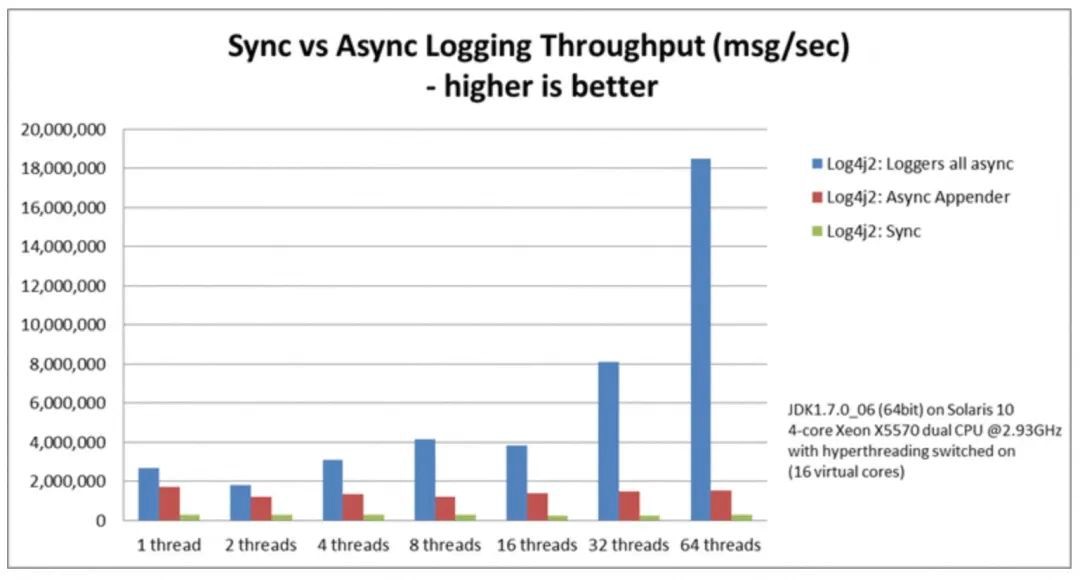
As shown in the figure above, synchronous writing has the lowest performance in all scenarios, which aligns with our regular understanding. However, the TPS (Transactions Per Second) of AsyncLogger (blue bar chart) increases alongside the number of Workers, while AsyncAppender results remain the same. This is somewhat different from our regular understanding. With this in mind, let's explore it further.
1. Log4j2 AsyncAppender
The following describes how to configure AsyncAppender. The framework provides more parameters for more fine-grained control. The core parameters are explained as follows:
o shutdownTimeout: the time to wait for the worker thread to process the log. Default value: 0 (indicating an infinite wait).
o bufferSize: the size of the buffer queue. Default value: 1024.
o blocking: specifies whether to use blocking mode. Default value: true. When the queue is full, it waits synchronously.
<Async name="Async">
  <AppenderRef ref="RollingRandomAccessFile"/>
  <shutdownTimeout>500</shutdownTimeout>
  <bufferSize>1024</bufferSize>
  <blocking>true</blocking>
</Async>
A brief interpretation of its design intent: The framework first provides a system buffer to cache the content to be written. When the buffer is full, the framework provides two strategies to choose from. The first is to discard the content directly, and the second is to wait, but the specific waiting time can be configured.
2. Log4j2 AsyncLogger
Compared with AsyncAppender, it is also simpler to use. You only need to set the startup parameter -Dlog4j2.contextSelector=org.apache.logging.log4j.core.async.AsyncLoggerContextSelector to globally enable asynchronous logging. Similarly, AsyncLogger also has a buffer size setting, the default value of which is 256 KB. A discard policy can be used when the buffer size is exceeded. You can specify which level of logs to discard by configuring the parameters -Dlog4j2.asyncQueueFullPolicy=discard and -Dlog4j2.discardThreshold=INFO.
It is worth mentioning that AsyncLogger uses the high-performance queue of LMAX Disruptor, which is the key to the better performance of AsyncLogger than AsyncAppender in terms of single-thread throughput and multi-thread concurrency. There are three main reasons why LMAX Disruptor can expand with the number of threads compared with blocking queue performance. First, it solves the pseudo-sharing problem. Second, the lock-free queue design only needs CAS overhead. Finally, it is the queue performance in this log scenario being compared.
<dependency>
   <groupId>com.lmax</groupId>
   <artifactId>disruptor</artifactId>
</dependency>
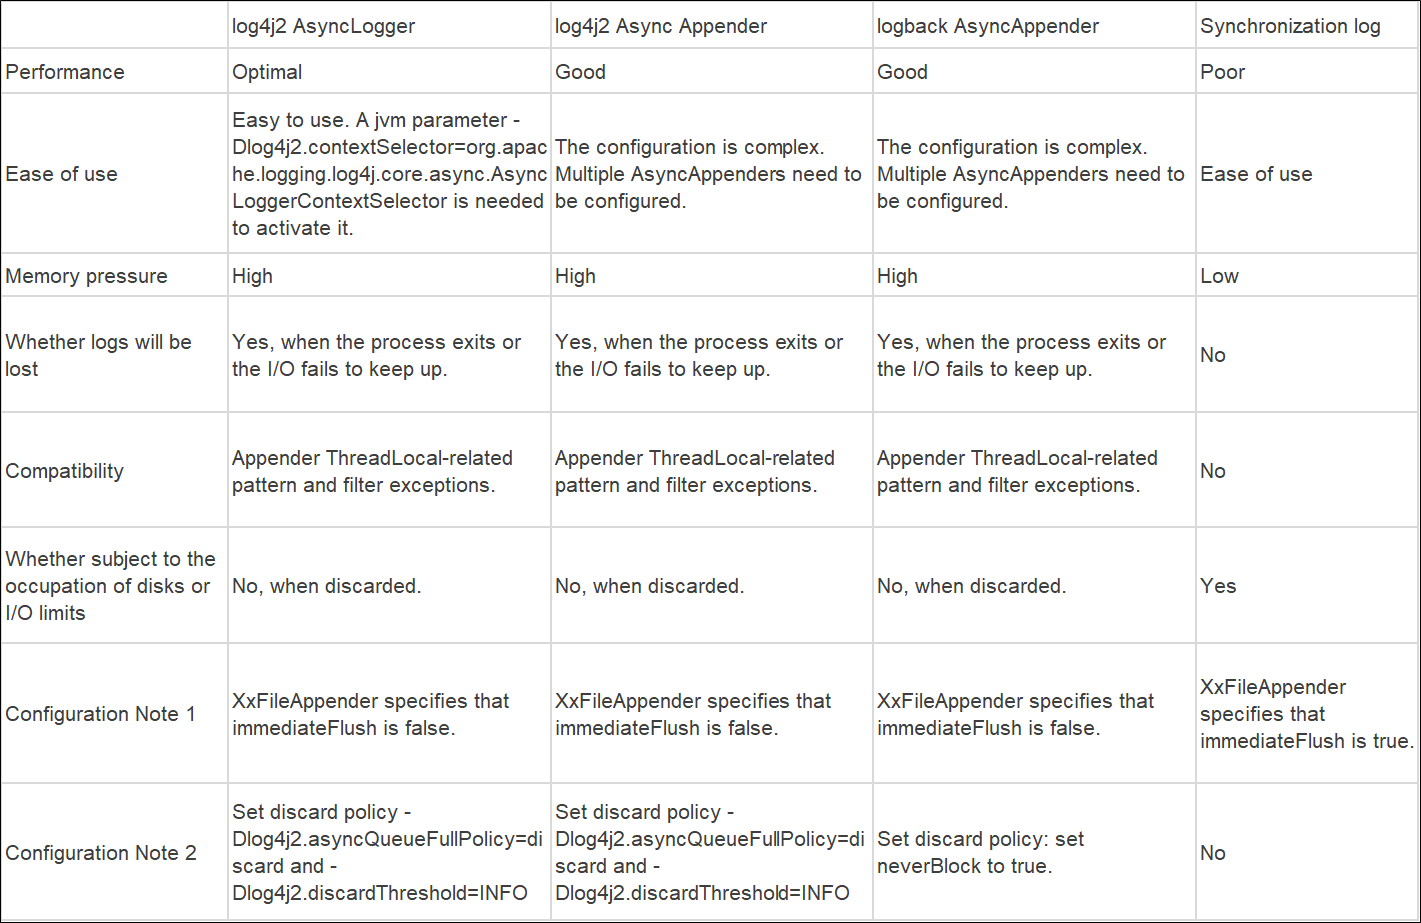
Logback has similar policies to Log4j, but I will not go into its detailed usage here. The following table summarizes the advantages and disadvantages of various policies. I hope this can help you choose a suitable one:
In the operating system, the processing of small files is easier compared with that of large files. From the perspective of system resources, large files often mean more memory occupation, more I/O operations, more demanding disk space, and more bus bandwidth. When any resource reaches its bottleneck, it results in more CPU usage, which can cause a higher load on the system. By contrast, small files give more room for optimization from the resource perspective, and provide more convenience in operation and maintenance management, such as using smaller disks, archiving earlier, and cleaning up disk space earlier.
In practical production, the appropriate use of rolling logs is an impressive practice. The following example is a configuration fragment in log4j. The configuration sets the time unit of rolling as one day, the size of rolling as 100 MB, and keeps the policy of retaining up to 5 files in log files rolling.
<RollingRandomAccessFile name="RollingRandomAccessFile" fileName="logs/app.log"
                                 filePattern="powered_by/edas-%d{MM-dd-yyyy}-%i.log">
    <PatternLayout>
        <Pattern>${commonPattern}</Pattern>
    </PatternLayout>
    <Policies>
        <TimeBasedTriggeringPolicy />
        <SizeBasedTriggeringPolicy size="100 MB"/>
    </Policies>
    <DefaultRolloverStrategy>
        <max>5</max>
    </DefaultRolloverStrategy>
</RollingRandomAccessFile>Visible business overhead is like goods in transit. We aim to pack and load goods that will ultimately be used. In the context of log output, this overhead can be divided into two parts:
In scenarios where detailed log content needs to be recorded, it is often necessary to retrieve full information (e.g., querying a database) based on certain parameters in the context. These actions often come with high call overhead. Therefore, it is recommended to use logger.isXXEnabled() for overhead control. This ensures that the corresponding query is only executed when the log level meets the requirements. Refer to the following code snippet:
// Not recommended
log.debug("Powered by {}", getProductInfoByCode("EDAS"));

// Recommended
if (log.isDebugEnabled()) {
    log.debug("Powered by {}", getProductInfoByCode("EDAS"));
}
Though the logic and principle are easy to understand, many of our customers have encountered cases of performance degradation caused by excessive code like this. A typical example is the JSON serialization of large objects. The reason behind this is the lack of code standards and missing code review processes during project implementation, leading to deterioration in performance.
Similar to the previous case, this practice is also simple and effective. Using parameter placeholders has two benefits. First, it is easier to write and provides better sentence integrity and readability compared to directly concatenating strings. Second, due to its delayed content generation nature, it ensures that the content is filled only when the real output is needed, thus saving a significant amount of overhead. The following code provides an example:
String product = "EDAS";
// Recommended
log.debug("Powered by {}", product);

// Not recommended
log.debug("Powered by " + product);
However, some of you may have a doubt: if the log level is "DEBUG", wouldn't the performance overhead be the same (or even worse)? With this doubt in mind, we conducted a targeted test using the log4j framework. The test results are shown in the following figure:
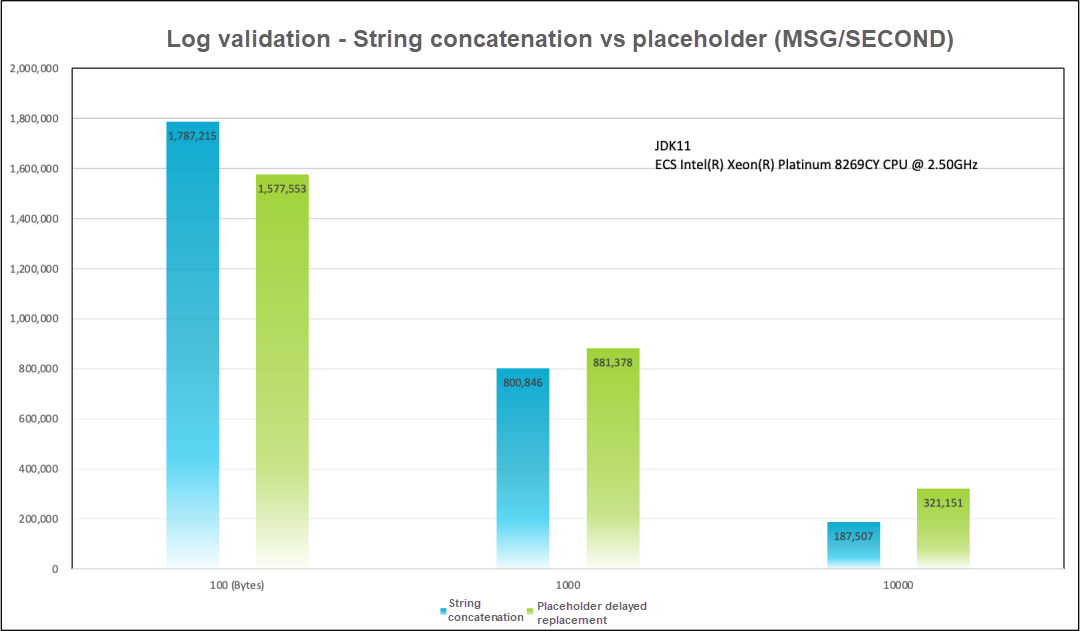
From the test results in the figure above, we can draw the following two conclusions:
Continuing with the analogy to transportation, invisible system overhead can be compared to overall fuel consumption, which is influenced by factors such as vehicle depreciation, road conditions, and driver habits. In computer software, system overhead refers to the main resource overhead (such as computing, memory, disk, and network). In this article, we focus on two aspects: memory and computation.
Garbage Free, also known as No GC (garbage collection), is a memory optimization technology introduced in log4j2. Its design goal is to reduce the pressure on garbage collection. The implementation principle is straightforward: avoid unnecessary object creation by reusing objects. This can be achieved by placing reusable objects in the ThreadLocal of the thread or reusing ByteBuffer to avoid creating unnecessary string objects. By avoiding the overhead of garbage collection through these two techniques, the latency is significantly reduced. The official performance testing results are compared as follows:
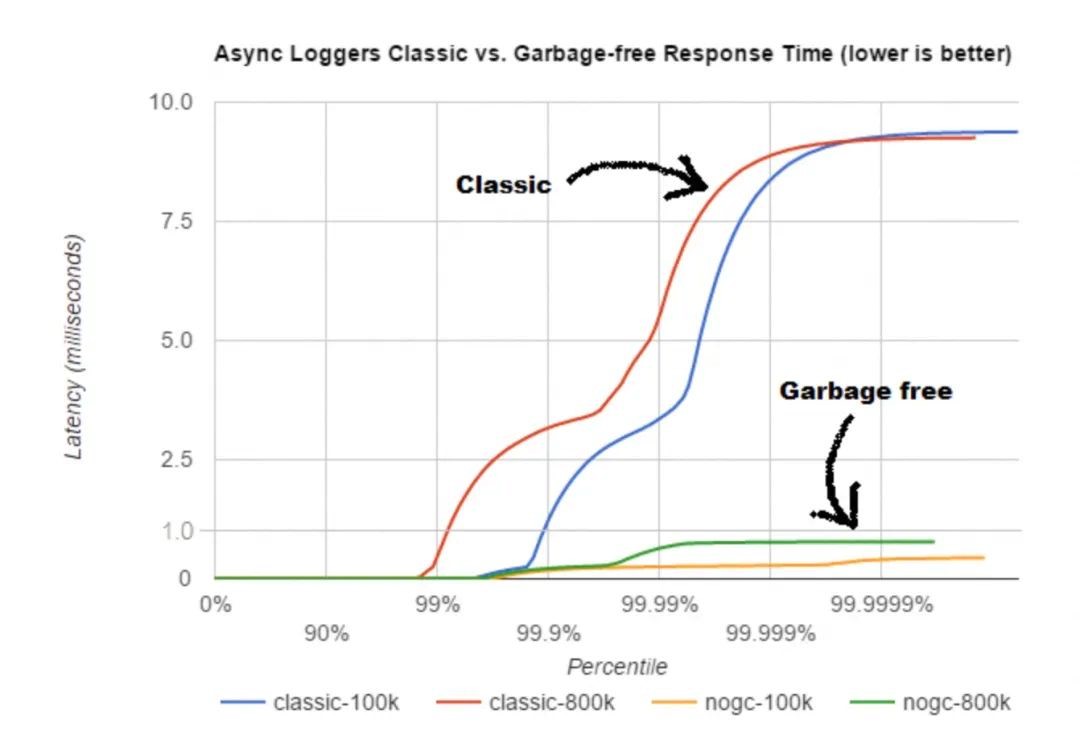
It is important to note that in the scenario of traditional J2EE Web applications, there may be a demand for hot loading. Garbage Free caches many large StringBuilders in ThreadLocal, which can potentially cause memory leaks when the program is hot-loaded. Therefore, log4j2 disables this technology by default when a J2EE Web application is detected. If you want to enable it forcibly, you can add -Dlog4j2.enable.threadlocals=true -Dlog4j2.enable.direct.encoders=true to the startup parameters.
Metadata printing during log output refers to the inclusion of code information during program runtime, such as class name, file name, method name, and line number. Let's take obtaining the line number as an example. The following figure shows the performance difference between using and not using line number output in different log frameworks. It is evident that almost all frameworks experience a significant drop in performance when implementing line number output.
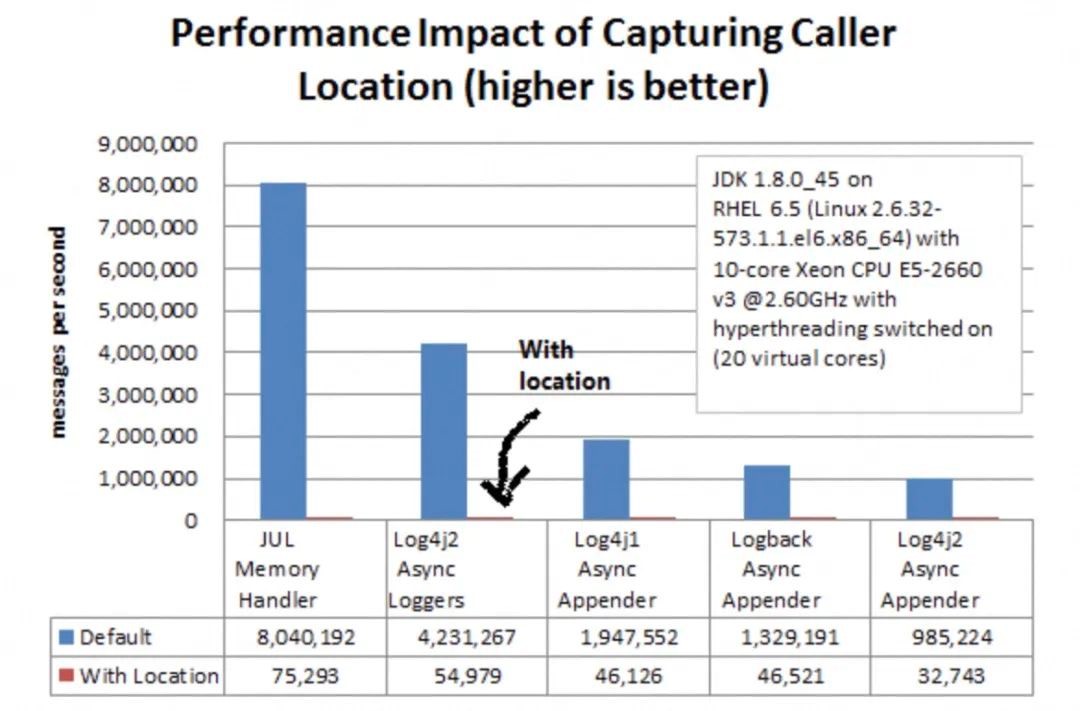
The question is, why does this happen? Taking Log4j2 as an example, when performing Location copmuting, it involves building a Throwable to obtain the stack, finding the stack frame where the class with the same name as the Logger is located, and finally obtaining the location. Just hearing this process can be tiring, right? If you're interested, you can refer to the corresponding code snippet below:
    public StackTraceElement calcLocation(final String fqcnOfLogger) {
        if (fqcnOfLogger == null) {
            return null;
        }
        // LOG4J2-1029 new Throwable().getStackTrace is faster than Thread.currentThread().getStackTrace().
        final StackTraceElement[] stackTrace = new Throwable().getStackTrace();
        boolean found = false;
        for (int i = 0; i < stackTrace.length; i++) {
            final String className = stackTrace[i].getClassName();
            if (fqcnOfLogger.equals(className)) {

                found = true;
                continue;
            }
            if (found && !fqcnOfLogger.equals(className)) {
                return stackTrace[i];
            }
        }
        return null;
}This article is written based on compiled work order Q&A related to log configuration from the customer service process of the EDAS team. It aims to provide some practical experience with Java logs. However, please note that due to the limitations of my knowledge, it is not possible to list all the factors that affect performance individually. If you have any additional insights or suggestions, please leave a message to let us know.
EDSA Official Product page: https://www.alibabacloud.com/product/edas
Disclaimer: The views expressed herein are for reference only and don't necessarily represent the official views of Alibaba Cloud.

1,376 posts | 490 followers
FollowAlibaba Cloud Native Community - April 29, 2024
Alibaba Cloud Community - January 26, 2024
Alibaba Cloud Native Community - March 18, 2025
Alibaba Cloud Community - October 28, 2022
Alibaba Cloud Community - September 19, 2024
Alibaba Cloud Community - October 15, 2024

1,376 posts | 490 followers
Follow Simple Log Service
An all-in-one service for log-type data
Learn More Enterprise Distributed Application Service
A PaaS platform for a variety of application deployment options and microservices solutions to help you monitor, diagnose, operate and maintain your applications
Learn More Log Management for AIOps Solution
Log into an artificial intelligence for IT operations (AIOps) environment with an intelligent, all-in-one, and out-of-the-box log management solution
Learn More EDAS
EDAS
A PaaS platform for a variety of application deployment options and microservices solutions to help you monitor, diagnose, operate and maintain your applications
Learn MoreMore Posts by Alibaba Cloud Community