By Xining Wang
Alibaba Cloud Service Mesh FAQ (1): How to Use the WebSocket over HTTP/2 Protocol
Alibaba Cloud Service Mesh FAQ (5): ASM Gateway Supports Creating HTTPS Listeners on the SLB Side
When the slow-start warm-up capability is not enabled, the requester sends a certain percentage of traffic to the pod whenever a new target pod joins. Progressive traffic increase for new pods is not supported. This may be undesirable for services that require warm-up time to provide the full load. It may result in request timeouts, data loss, and a degraded user experience.
As a practical example, the problem is manifested in JVM-based Web applications that use horizontal pod autoscaling. When the service is started, it will be flooded with a large number of requests, which will cause the application timeout when warming up. As a result, each time the service is extended, data is lost, or the response time for these requests increases. The basic principle of warm-up is to gradually connect the newly started machines to traffic.
ASM starts to support slow-start warm-up in version 1.14. This is a simple introduction:
In ASM, you only need to configure trafficPolicy/loadBalancer in the DestinationRule corresponding to the service.
Note:
Example:
apiVersion: networking.istio.io/v1alpha3
kind: DestinationRule
metadata:
  name: mocka
spec:
  host: mocka
  trafficPolicy:
    loadBalancer:
      simple: ROUND_ROBIN
      warmupDurationSecs: 100s
  subsets:
  - name: v1
    labels:
      version: v1
  - name: v2
    labels:
version: v2In this example, the number of deployment replicas of v2 and v3 in the review is reduced to 0 for the convenience of demonstration. The number of deployment replicas of the reviews-v2 and reviews-v3 in the Kubernetes cluster is reduced to 0.
The following rule configurations are created in the ASM.
apiVersion: networking.istio.io/v1alpha3
kind: Gateway
metadata:
  name: bookinfo-gateway
spec:
  selector:
    istio: ingressgateway # use istio default controller
  servers:
  - port:
      number: 80
      name: http
      protocol: HTTP
    hosts:
    - "*"
---
apiVersion: networking.istio.io/v1alpha3
kind: VirtualService
metadata:
  name: bookinfo
spec:
  hosts:
  - "*"
  gateways:
  - bookinfo-gateway
  http:
  - match:
    - uri:
        exact: /productpage
    - uri:
        prefix: /static
    - uri:
        exact: /login
    - uri:
        exact: /logout
    - uri:
        prefix: /api/v1/products
    route:
    - destination:
        host: productpage
        port:
number: 9080apiVersion: networking.istio.io/v1beta1
kind: DestinationRule
metadata:
name: reviews
spec:
host: reviews
subsets:
- labels:
version: v1
name: v1
- labels:
version: v2
name: v2
trafficPolicy:
loadBalancer:
simple: ROUND_ROBIN
---
apiVersion: networking.istio.io/v1beta1
kind: VirtualService
metadata:
name: reviews
spec:
hosts:
- reviews
http:
- route:
- destination:
host: reviewsAfter the mesh topology is enabled, requests are sent by continuously accessing the ingress gateway address. For example, use the hey command to send a stress testing request for ten seconds.
The hey command download and installation reference link: https://github.com/rakyll/hey
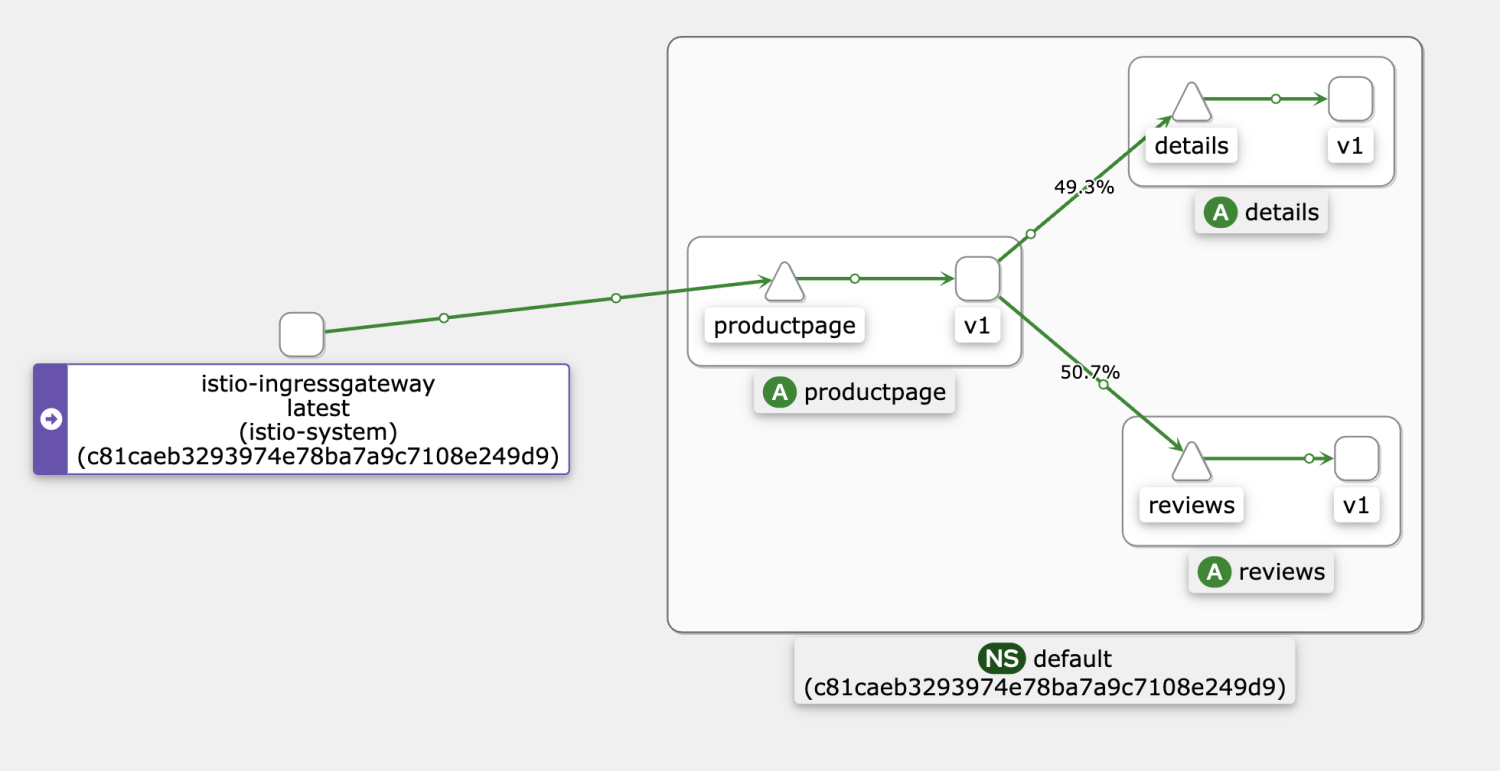
hey -z 10s http://${gateway address}/productpageThe following figure shows the normal call topology. Please visit this link for more information.

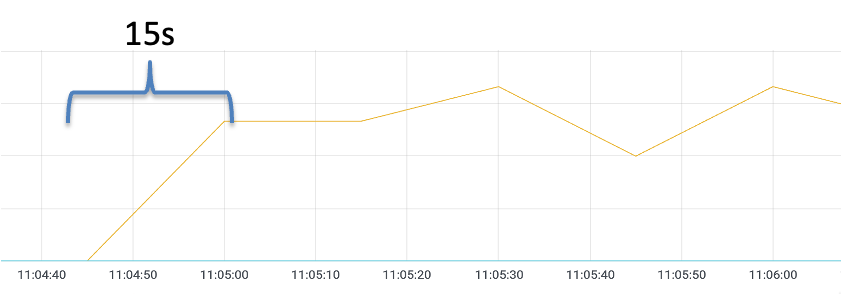
Select the target ASM instance in the ASM console. Choose Prometheus Monitoring under Observability Management on the left-side navigation pane. On the right side of the page, select Mesh Service-level Monitoring and select the reviews service.
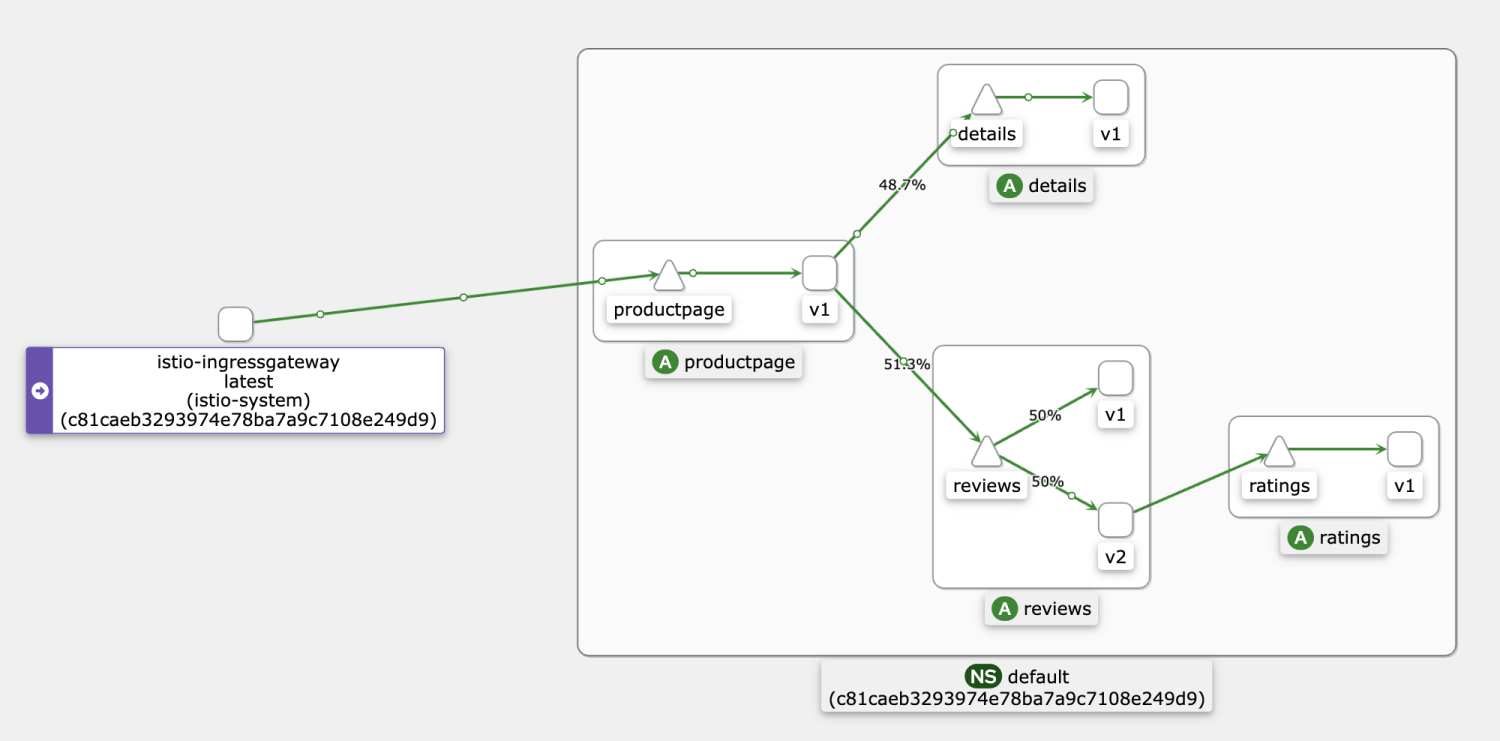
If the warm-up feature is not enabled, scale out the number of replicas for a Deployment named reviews-v2 from 0 to 1 in the Kubernetes cluster. Run the hey command to send a stress testing request for the ingress gateway. Pay attention to the dashboard data monitored by Prometheus. It takes about 15s for the reviews-v2 Pod to receive the balanced request (the specific time depends on the stress testing environment).

Then, in the Kubernetes cluster, scale down the number of replicas to 0 for the Deployment named reviews-v2. After 1 minute, the warm-up feature is enabled.
Update the DestinationRule named reviews and add the warmupDurationSecs value to 120s, which specifies the warm-up duration to 120s.
apiVersion: networking.istio.io/v1beta1
kind: DestinationRule
metadata:
  name: reviews
spec:
  host: reviews
  subsets:
    - labels:
        version: v1
      name: v1
    - labels:
        version: v2
      name: v2
  trafficPolicy:
    loadBalancer:
      simple: ROUND_ROBIN
warmupDurationSecs: 120sSimilarly, if the warm-up feature is enabled, scale out the number of replicas for a Deployment named reviews-v2 in the Kubernetes cluster from 0 to 1. Run the hey command to send a stress testing request for the ingress gateway. Pay attention to the dashboard data monitored by Prometheus. It takes about 45s for the reviews-v2 Pod to receive the balanced request (the specific time depends on the stress testing environment).

When the warm-up feature is enabled, each time a service instance is started, the requester sends a portion of the request load to the instance and gradually increases the request volume within the configured period. When the slow-start window duration is reached, it exits the slow-start mode.
After the warm-up function is enabled, it takes about 150s to evenly distribute the traffic to v1 and v2.

Before you view the service warm-up effect, perform the following two steps:
1. In order to clear the existing data of the counter, run the following command to view the new count value:
## Sidecar Proxy Counters in Pods of reviews-v1 Version
kubectl exec reviews-v1-55b668fc65-jhxlj  -c istio-proxy -- curl localhost:15000/reset_counters -X POST
Run the following command to check how many times the counter statistics in the sidecar proxy are processed. After the counter statistics are cleared, it should be 0.
kubectl exec reviews-v1-55b668fc65-jhxlj -c istio-proxy -- curl localhost:15000/stats |grep inbound |grep upstream_rq_200You can see a similar result output.
cluster.inbound|8000||.upstream_rq_200: 02. Adjust the number of replicas of the v2 version of the review to 0, which means reducing the number of replicas of the Deployment named reviews-v2 to 0 in the Kubernetes cluster.
Then, re-scale the number of replicas of the Deployment named reviews-v2 in the Kubernetes cluster from 0 to 1 and use the hey command to send a stress testing request for the ingress gateway. Run the hey command immediately to send a stress test request for the 20s.
hey -z 20s http://${gateway address}/productpage
Status code distribution:
  [200]    3260 responses
It indicates that 3260 requests were sent by the hey command within the 20s.
Then compare the reviews-v1 and reviews-v2 pods. You can see the reviews-v2 POD instance only receives a small proportion of requests.
Run the following command to check how many times the counter statistics in the sidecar proxy in the reviews-v1 are successfully processed.
kubectl exec reviews-v1-55b668fc65-jhxlj  -c istio-proxy -- curl localhost:15000/stats |grep inbound |grep upstream_rq_200
  % Total    % Received % Xferd  Average Speed   Time    Time     Time  Current
                                 Dload  Upload   Total   Spent    Left  Speed
100 20873    0 20873    0     0  19.9M      0 --:--:-- --:--:-- --:--:-- 19.9M
cluster.inbound|9080||.external.upstream_rq_200: 2927
cluster.inbound|9080||.upstream_rq_200: 2927
Run the following command to check how many times the counter statistics in the sidecar proxy in the reviews-v2 are successfully processed.
kubectl exec reviews-v2-858f99c99-j6jww   -c istio-proxy -- curl localhost:15000/stats |grep inbound |grep upstream_rq_200
  % Total    % Received % Xferd  Average Speed   Time    Time     Time  Current
                                 Dload  Upload   Total   Spent    Left  Speed
100 30149    0 30149    0     0  28.7M      0 --:--:-- --:--:-- --:--:-- 28.7M
cluster.inbound|9080||.external.upstream_rq_200: 333
cluster.inbound|9080||.upstream_rq_200: 333
According to the statistics, in the first 20s, the reviews-v2 Pod processed a small number of requests (about 10%) during the 120s slow-start window.
Test it after the slow-start window period and clear the reviews-v1 and reviews-v2 counters again. Run the following command:
## Sidecar Proxy Counters in Pods of reviews-v1 Version
kubectl exec reviews-v1-55b668fc65-jhxlj  -c istio-proxy -- curl localhost:15000/reset_counters -X POST
## Sidecar Proxy Counters in Pods of reviews-v2 Version
kubectl exec reviews-v2-858f99c99-j6jww  -c istio-proxy -- curl localhost:15000/reset_counters -X POST
Then, run the hey command to send the stress test traffic for 20s. Then, run the following command again to check how many times the counter statistics of the reviews-v1 and the sidecar proxy in the reviews-v2 are successfully processed.
kubectl exec reviews-v1-55b668fc65-jhxlj  -c istio-proxy -- curl localhost:15000/stats |grep inbound |grep upstream_rq_200
cluster.inbound|9080||.external.upstream_rq_200: 1600
cluster.inbound|9080||.upstream_rq_200: 1600
kubectl exec reviews-v2-858f99c99-j6jww   -c istio-proxy -- curl localhost:15000/stats |grep inbound |grep upstream_rq_200
cluster.inbound|9080||.external.upstream_rq_200: 1600
cluster.inbound|9080||.upstream_rq_200: 1600
You can see that outside of the slow-start window time, reviews-v1 and reviews-v2 accepted and processed an equal number of requests.
Alibaba Cloud Service Mesh FAQ (1): How to Use the WebSocket over HTTP/2 Protocol

56 posts | 8 followers
FollowXi Ning Wang(王夕宁) - May 26, 2023
Xi Ning Wang(王夕宁) - May 26, 2023
Xi Ning Wang(王夕宁) - May 26, 2023
Xi Ning Wang(王夕宁) - July 21, 2023
Alibaba Container Service - January 14, 2025
Xi Ning Wang(王夕宁) - May 26, 2023

56 posts | 8 followers
Follow Alibaba Cloud Service Mesh
Alibaba Cloud Service Mesh (ASM) is a fully managed service mesh platform that is compatible with Istio.
Learn More Cloud-Native Applications Management Solution
Accelerate and secure the development, deployment, and management of containerized applications cost-effectively.
Learn More Container Service for Kubernetes
Alibaba Cloud Container Service for Kubernetes is a fully managed cloud container management service that supports native Kubernetes and integrates with other Alibaba Cloud products.
Learn More Apsara Stack
Apsara Stack is a full-stack cloud solution created by Alibaba Cloud for medium- and large-size enterprise-class customers.
Learn MoreMore Posts by Xi Ning Wang(王夕宁)