
By Chuheng
There is a common understanding in the software engineering field that programmers spend more time maintaining existing code than they do writing code. It is also understood that the most challenging part in the whole process of code maintenance is troubleshooting.
Frontline server programmers who maintain online services on a 24/7 basis often tackle small and large problems online. If they are not careful enough, a small problem may lead to many other large problems. In this article, I will share my experience in server troubleshooting in terms of common issues, troubleshooting processes, and troubleshooting tools, with reference to some painful cases in actual projects.
Know Your Enemy: Know yourself, know your enemy, and you shall win a hundred battles without loss.
In my experience, most problems fall into the following categories:
The preceding categories may not be complete or precise. You should create your own checklist. When you encounter a problem and cannot figure out a solution, go through the checklist and you may find the answer.
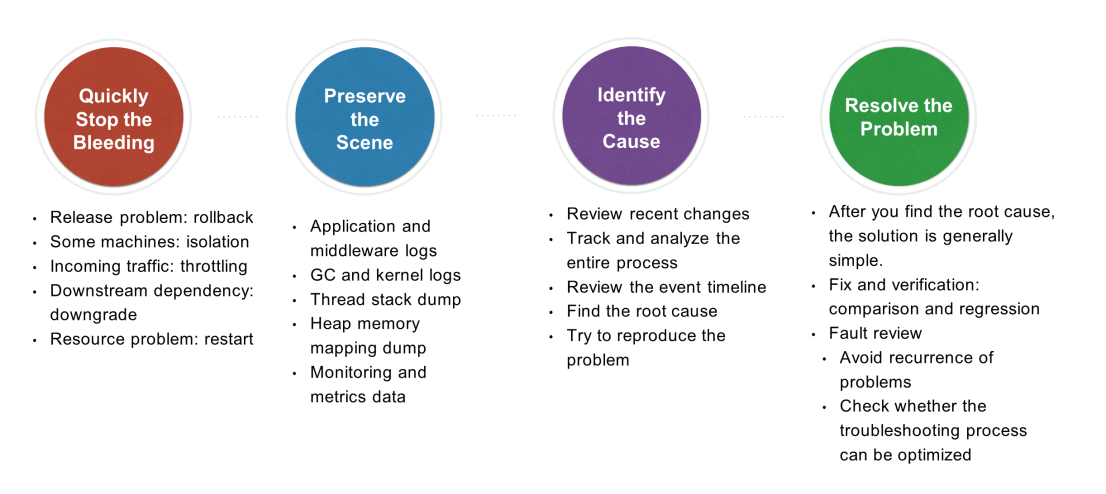
The first step in troubleshooting is to stop the bleeding as soon as you can. How can I quickly stop the bleeding? In other words, how can I prevent a problem from worsening during the troubleshooting process? The following lists some common methods:
Is the bleeding stopped? Have you stopped the problem from worsening? If yes, congratulations. At least things will not get worse. Take a break. The next step is to find out the root cause of the problem based on the clues. A programmer experienced in troubleshooting should have the awareness to try to preserve the scene, for example:
How can I find the specific cause by using historical data? This step will test your technical understanding, business familiarity, and practical operation experience. There could be many causes of a problem. You need to track and analyze the causes case by case. The following are several suggestions for troubleshooting:
Since the root cause has been identified, how can I resolve the problem perfectly? Follow several basic principles here:
If all you have is a hammer, everything looks like a nail. As an engineer, you need a complete toolkit.
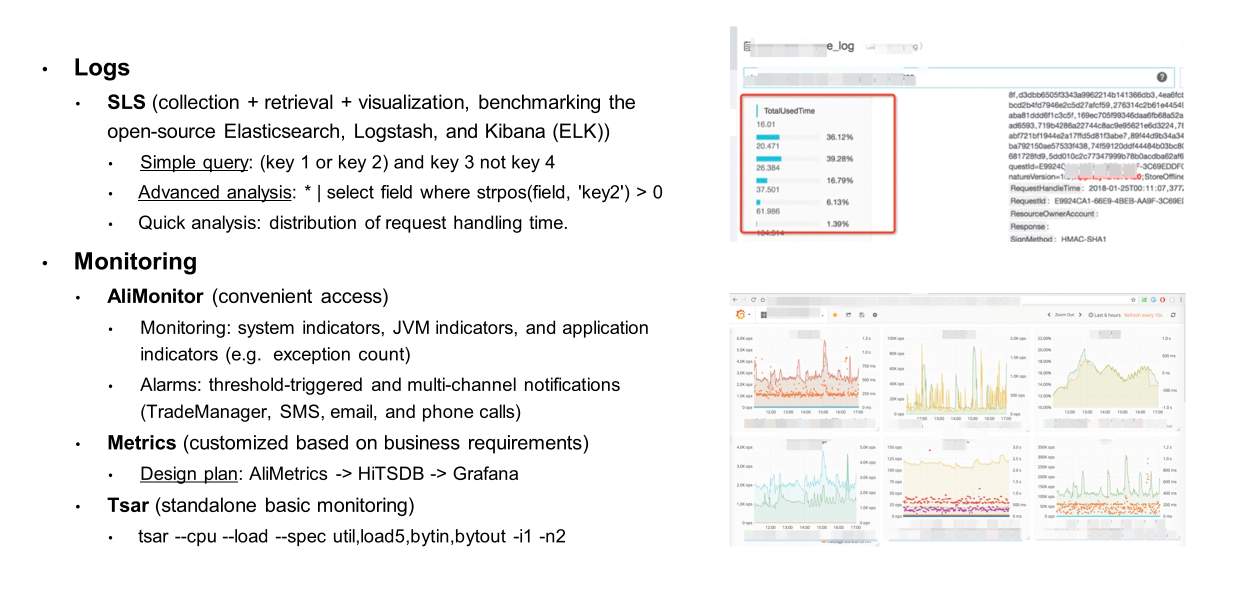
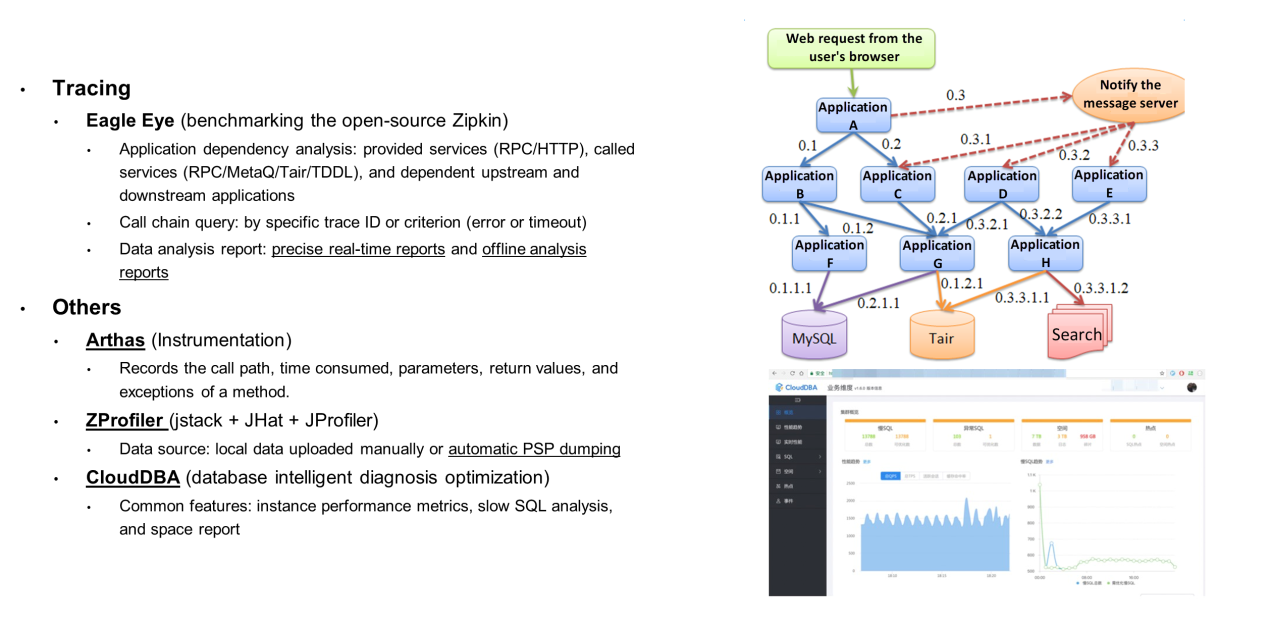
Troubleshooting is a process of continuously observing application behavior. To preserve key details, you need to make your application more observable.
There are three powerful tools for improving the observability of applications: logging, monitoring, and tracing. In my previous projects, logging was provided by Log Service (SLS), monitoring was provided by AliMonitor/AliMetrics/tsar, and tracing was provided by Eagle Eye. These are not described here in detail.
We also recommend that you use the Arthas tool, which is very practical and easy to use. I believe many of you have already used it.
It is not enough to learn how to troubleshoot problems. To be skilled in troubleshooting is only a temporary solution and cannot resolve the root cause. To avoid problems from the root, you need to start from the system itself: continue to optimize your system implementation from three aspects (performance, stability, and maintainability) and nip the problems in the bud.
Boss: "The system must be fast, stable, and excellent in performance. By the way, don't worry about the salary. You will definitely get it next month."
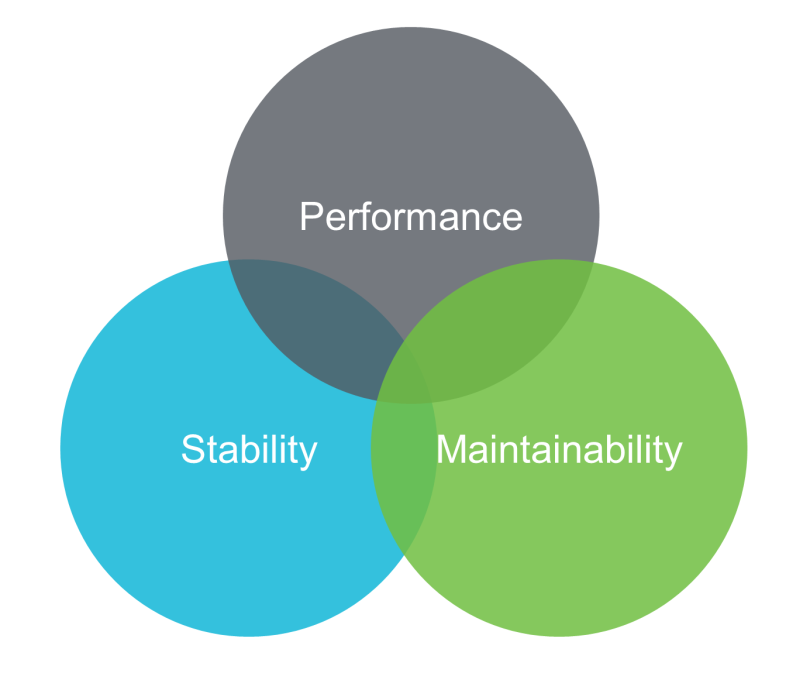
System optimization mainly focuses on three aspects: performance, stability, and maintainability. The three aspects are not completely independent. Instead, they act upon each other in a complex way.
The best software system does not require high performance, high stability, and high maintainability at the same time. The most important thing is to make reasonable trade-offs based on the actual business needs and scenarios and reach an optimal dynamic balance between the three aspects.
Therefore, optimization is not only a science, but also an art.
Q: In auto racing, which one is more important? The driver or the car?
A: Both are equally important.
No one dislikes high-performance sports cars or wants to suddenly get stuck while watching the live broadcast of an internet influencer.
Performance is the ultimate goal pursued by engineers from all walks of life.
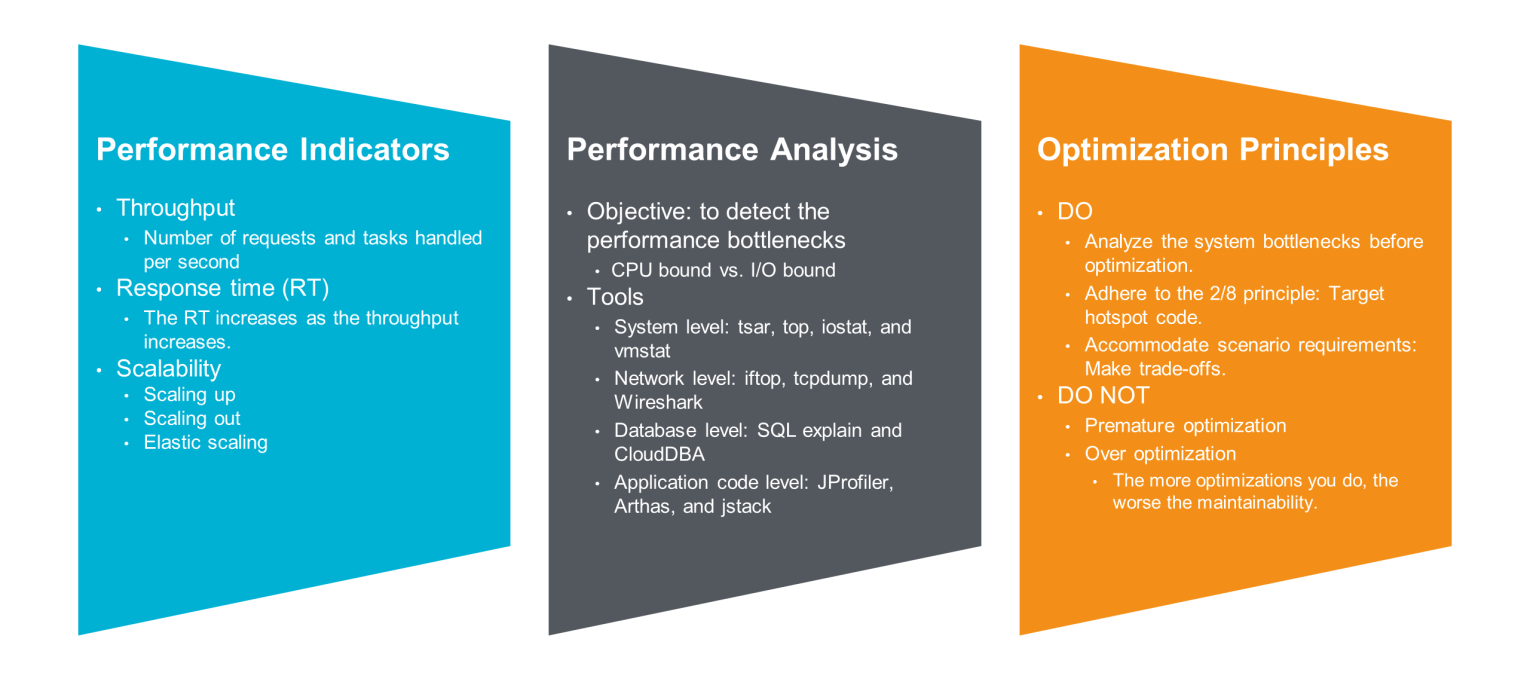
An indicator is a scientific and quantitative means for measuring the quality of an object. The following indicators are generally used to evaluate performance:
In addition, the throughput and RT of the same system generally have the following correlations: When the throughput is less than a critical value, the RT is almost unchanged. Once the throughput exceeds the critical value, the system will enter an overloaded state, and the RT begins to increase linearly. For a system with stability requirements, you need to fully consider the critical value during performance stress testing and capacity planning.
Note: To put it in a more rigorous way, performance indicates only how "fast" a system is. Some of the preceding indicators are closely related to the system's operating speed, yet do not merely represent the operating speed.
As an old saying goes, if you cannot measure it, you cannot improve it.
To optimize the performance of a system (for example, the RT of web requests), you need to first accurately measure and analyze the performance of the current system and figure out the causes of poor performance: Is the request parsing or database query too slow? If the database query is too slow, is it too slow to scan the data entries or return the result sets? Or is the network latency between the application and database too long?
The handling process of any complex request can be split into a series of parallel or serial atomic operations. If you optimize the atomic operations at will, obviously, the efficiency will not be too high unless you are lucky. A more reasonable approach is to adhere to the 2/8 principle: Preferentially analyze and optimize system bottlenecks, that is, atomic operations with the greatest impact on system performance at present. They are likely to be the optimization points with the highest return on investment (ROI).
How exactly can I quantify and analyze performance? Here are some tools for your reference:
Many of these tools are also common troubleshooting tools. After all, both performance analysis and diagnostic analysis are intended to help you understand a system and the environment where the system resides. The operations to be performed are similar.
I have already mentioned a lot above, and here is another point. Like planning for functional requirements, performance optimization is also oriented at business. Therefore, during performance optimization, you should accommodate the target requirements and application scenarios in case that the optimization is not needed in the production environment. Moreover, you can actually customize some complex optimizations based on traffic characteristics, instead of making general optimizations.
You should not make premature optimization or over optimization. In general, performance optimization is not a free lunch. The more optimizations you do, the worse the maintainability.
What are the common methods for performance optimization? I have summarized eight methods here. The last one is an all-in-one method.
Simply put, you can omit some operations.
Simply put, you can perform some operations together with other people.
Mode: parallel processing in standalone (multithreaded) or multi-node (distributed) mode.
Advantage: Machine resources (multiple cores and clusters) are fully utilized.
Disadvantage: synchronization overhead, thread overhead, and data skew.
Simply put, you can ignore some operations without waiting.
Mode: message queue + task thread + notification mechanism.
Advantage: The throughput, component decoupling, and load shifting are improved.
Disadvantage: queuing delay (queue backlog).
Excessive backlog avoided: back-pressure (reactive thinking).
Simply put, you can combine some operations.
Mode: multiple single operations combined into a single batch operation.
Example: TCP Nagel algorithm and batch read/write API of a database.
Advantage: Inherent overheads of single operations are avoided, reducing the total overheads.
Disadvantage: waiting delay + aggregation delay.
You have to choose between time and space.
Exchange space for time: Avoids repeated computation, shortens the transmission distance, and reduces pressure through offloading.
Exchange time for space: This sometimes can make the system faster. For example, the data volume is reduced, and therefore the data transmission time is shortened.
(6) Data structure and algorithm optimization
Program = Data structure + Algorithm
Sharing economy & community supermarket
Pooling: Reduces resource creation and deletion overheads.
Localization: Avoids overheads resulting from contention for shared resources.
"Hold on. We can win," a game player.
How to maintain stability is a major issue that programmers think and discuss every day.
What kind of system is stable? Is a tool that has never failed while running locally stable? Taobao is maintained by thousands of personnel. However, users often fail to place orders in the Double 11 Shopping Festival. So, is it unstable?
Stability is a relative concept. As the business scale expands and the scenarios become more complex, the system is more likely to become unstable, and the resulting impact becomes more severe.
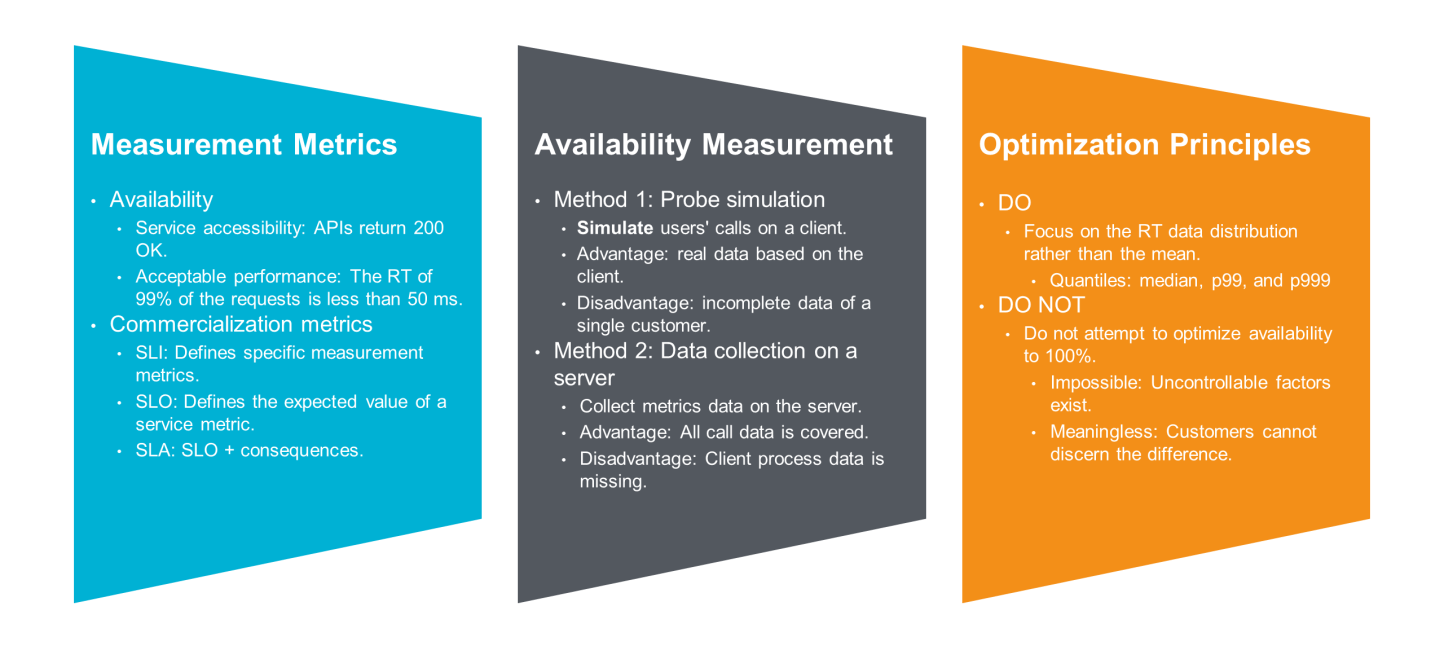
Different businesses provide different types of services. How can I measure the system stability with the same metrics? The standard practice is to define the service availability. Provided that the service is "available" to users, the system is currently stable; otherwise, it is unstable. In this way, after collecting and aggregating data, you can obtain the service availability ratio based on the service duration or number of service times, to monitor and quantify the stability of a system.
However, what can we use to define whether a service is currently available? This is related to specific businesses, but most businesses of the same type can be defined in a similar way. For example, if all API requests are responded to successfully and the total page loading time is less than 3s, a general website can be defined as available.
For cloud products provided by Alibaba Cloud, service availability must be especially valued and continuously improved. Many users on Alibaba Cloud use multiple cloud products at the same time, and an availability issue of any product will be directly perceived and magnified by users. Therefore, the underlying infrastructure has higher availability requirements. For more information about availability metrics and concepts such as the service level indicator (SLI), service level objective (SLO), and service level agreement (SLA), see the Cloud Intelligence SLA.
After defining the availability metrics, how can we accurately measure the availability of a system? In general, there are two ways.
Simulate users' calls on a client.
Analyze logs and data directly on a server.
You can use both methods in a system requiring high availability. We recommend that you choose a suitable method based on your business scenarios.
You should focus on the RT data distribution (for example, quantiles p50, p99, and p999) rather than the mean. In other words, you should care more about the feelings of 1% or 0.1% of your users.
You should not promise or attempt to optimize the availability to 100%. On the one hand, this is impossible because there are too many objective and uncontrollable factors. On the other hand, this is meaningless because customers can hardly discern the difference of 0.001% in availability.
What are the common methods for stability optimization? I have also summarized eight methods here.
It is like your parents telling you that it is time for you to settle down with someone.
What can I do to avoid single points of failure?
Redundancy deployment is not enough. A failover capability is also required.
Family planning, school adjustment, license plate number restriction, and scenic area restriction. Control is everywhere in our daily life.
Imagine a case where a circuit breaker is triggered in your stocks in the morning and your fuse at home is blown at night. Calm down. It's just for stopping the loss as soon as possible.
It's like you ordering takeaway food when you have no time to cook. For the sake of health, such downgrade is not preferred.
Cause: throttling, circuit breaker mechanism, or overload.
Common downgrade methods:
What can I do if I get no reply on DingTalk? Ping the target user every 10 minutes, and call the target user if you get no reply in one hour.
Timeout: Avoids permanent blocking on the caller.
Retry: Ensures the idempotence of retries.
What can I do to prevent my girlfriend from spending too much money during a massive online promotion? Lower your credit card limit in advance.
What if my girlfriend has a long shopping list for a massive online promotion? Probably, you can ask your girlfriend to use her own credit card instead of yours.
What if my girlfriend begs for my credit card for shopping? You'd better still say no to her.
Program dynamics: switch, configuration, and hot update.
Review mechanism: code review and release approval.
Gray release: batch deployment and rollback plan.
If ancestors plant trees, descendants enjoy the shade.
If ancestors dig pits, descendants just have holes.
Maintenance also means preservation and supply. So, how important can software maintenance be? It acts as the lungs and mouth of the software system, and is necessary to maintain the life of the software.
The process of developing and releasing a software system is to "give birth to" it. How much value the software system can bring depends on the process after delivery. Does it thrive continuously and benefit users? Or does it gradually fade out and get abandoned by users? This does not depend on the short-term performance or stability of the system but depends on the future. It depends on whether the system can preserve good performance and stability in the changing market environment where customer needs and human factors are constantly changing as well.
Compared with performance and stability, maintainability creates the most long-term value, which is the most difficult to create in the short term. Therefore, maintainability is sacrificed in the early stage of many software projects. The consequences of such decisions normally cannot be remedied (or can be remedied with high costs), similar to those in architecture design. Many software projects are becoming increasingly unmaintainable (little space for code changes, numerous bugs to fix, and little space for adding features). They will eventually be abandoned.
Compared with performance and stability, maintainability is more difficult to quantify because the artistic part is more emphasized than the scientific part. Here, I have selected the following metrics for qualitative analysis:
I will further emphasize the importance of maintainability from the following aspects.
You should follow the KISS, DRY, code readability, and architecture design principles.
You should not introduce too much temporary and hack code, or focus only on the functionality without overall considerations.
What are the common methods for maintainability optimization? I have summarized four methods here.
Nothing can be accomplished without norms or standards.
Do not give up. The code can be saved.
Believe in the power of data.
Technology is the primary productive force.
Getting Started with Service Mesh: Origin, Development, and Current Status
3 posts | 1 followers
Followyzq1989 - April 10, 2020
Neel_Shah - August 22, 2025
Alibaba Cloud Native - March 6, 2024
hyj1991 - June 20, 2019
Alibaba Cloud Native Community - November 27, 2025
Alibaba Cloud Native Community - November 20, 2025
3 posts | 1 followers
Follow CloudMonitor
Automate performance monitoring of all your web resources and applications in real-time
Learn More Simple Log Service
An all-in-one service for log-type data
Learn More Managed Service for Prometheus
Multi-source metrics are aggregated to monitor the status of your business and services in real time.
Learn More Application Real-Time Monitoring Service
Build business monitoring capabilities with real time response based on frontend monitoring, application monitoring, and custom business monitoring capabilities
Learn MoreMore Posts by Adrian Peng