Caching is an efficient and easy way to capture interactions between your application and the data storage location. To accomplish this effectively, you need to understand the various implementations of cache and their effects on your application. In this article, we will be focusing on the various usage scenarios of data caching without discussing the details of the technical implementation.
All businesses rely on data, but the relevance of different types of data varies by industry. This blog emphasizes the importance of increasing post-classification data in proportion with business needs.
When data size reaches a certain degree of magnitude, developers must consider how to quickly retrieve the user-required data while minimizing the time taken to produce an output.
Data access optimization observes a law similar to the funnel law, which entails:
Image 1:
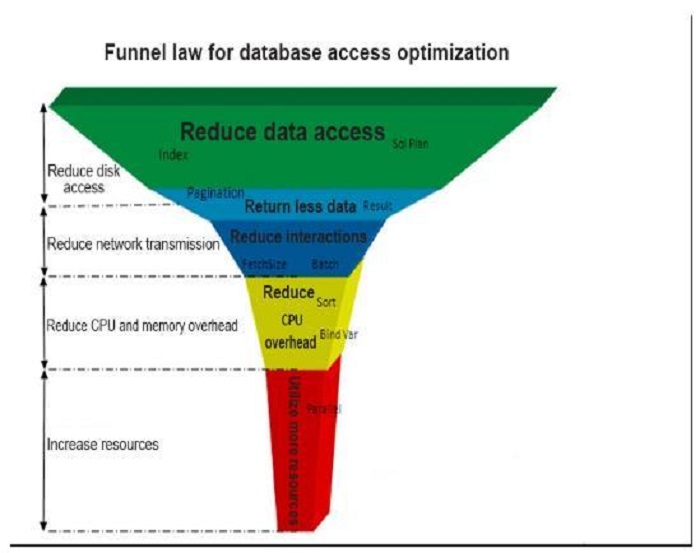
Data caching is introduced when all existing optimization tools reach a bottleneck and are still unsuccessful in meeting the current business needs. A point worth mentioning here is that the use of caching is closer to the "reduced data access" layer.
Two types of cache exist in Java development: local cache and cluster cache.
Local cache
Advantages:
Disadvantages:
Cluster cache
Advantages:
Disadvantages:
Cache usage varies for different data sizes and scenarios. Three usage methods exist, which are as follows:
The decision to use a local cache or cluster cache does not restrict the cache usage methods. While extensions are available, this article does not focus on the cluster cache implementation but on the bottleneck that local cache usage causes. In most cases, a local cache of JVM refers to heap memory.
The typical configuration of Alibaba Cloud's standard application servers is comprised of stand-alone virtual 4-core CPUs with 8GB memory. This configuration allocates the 8GB between two parts: JVM and daily overhead of servers. The JVM memory consists of the following:
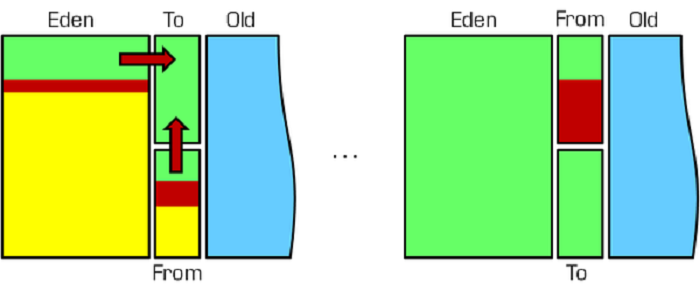
The memory for the young generation is subdivided, based on a 10:1:1 ratio, between Eden, so1, and so2, with about 170MB dedicated to each.
You might wonder, what is the significance of such a division? What happens if we allot 3GB to the young generation? What happens if we adjust the allocated size for the young generation, or change the ratio of the subdivision?
One of the biggest differences between Java development and C development is that Java developers avoid addressing memory application and release, which are managed dynamically by JVM's garbage collection mechanism. When the JVM heap memory usage reaches a certain percentage, it will trigger the Stop-The-World (STW) GC. JVM's GC is not perceivable to the application. When a user requests data and the query hits a record in the cache, but GC activates in the JVM, the entire application will freeze, and the application holds the user's request until the GC completes. The GC may not exceed the maximum timeout value of the request.
This is the first influence of JVM heap on local cache usage. Some have suggested that we can extend the GC cycle by increasing the JVM heap size. However, we must also consider the impact of the ratio of memory size allocated to the JVM young generation in local memory.
Currently, the JVM of Taobao servers adopts the Concurrent Mark-Sweep (CMS) mechanism for GC.
The corresponding collection mechanism of the young generation is tag-copy.
Image 2:
The corresponding collection mechanism of the old generation is tag-clear (or tag-trimming).
Image 3:
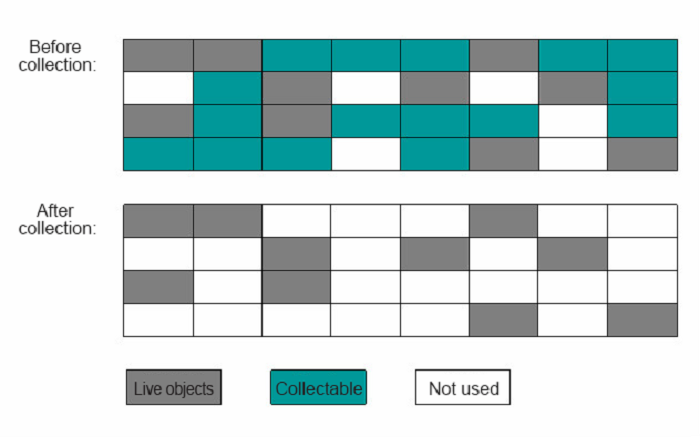
The benefit of using the "tag-copy" algorithm on the young generation is that the majority of the young generation's data survival cycles are not lengthy. Similar to the temporary variables in the method body, such data is discarded immediately after use. Few young-generation data objects survive after the YGC (GC events in young area), and the cost for transferring these surviving objects to another is minimal. Therefore, the "tag-copy" algorithm is used to the maximum effect, and the impact to the user is minimal.
Compared with YGC, developers pay more attention to FGC (number of full GC events occurred) because FGC's suspension duration is longer than YGC's, as shown in the figure below.
Image 4:
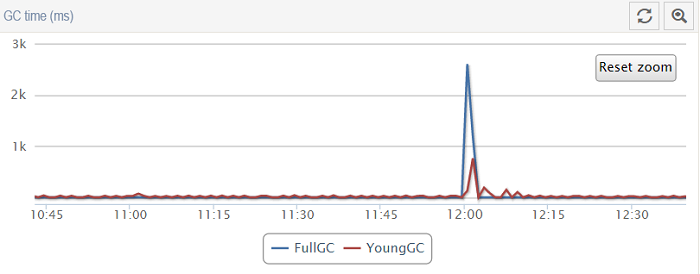
This is a comparison between FGC & YGC time consumption.
In general, YGC takes about 10ms to 200ms, while FGC may take several seconds, under normal circumstances. When the memory size allocated for the young generation is in accordance with the ratio of 10:1:1, the maximum size of an So is 170MB. After the collection, the size of the remaining objects copied from so1 to so2 is smaller than 170MB or a few megabytes. What will happen if we adjust the ratio of Eden and So, downsizing Eden and enlarging So, to the ratio 1:1:1?
In that case, the maximum size of So will be 682MB. Thus, more objects may survive after the object collection, and the time consumption for copying objects from so1 to so2 will also increase. In severe cases, the time may exceed several seconds, or even exceed that by FGC.
If you use a USB drive to copy large files, you must have noticed that the copying speed from memory is much higher than that from a hard disk. Copying files from memory only takes several minutes, but copying files from a hard disk takes a longer time. The time elapsed for copying several gigabytes of files from the USB drive to the hard disk is similar.
Image 5:
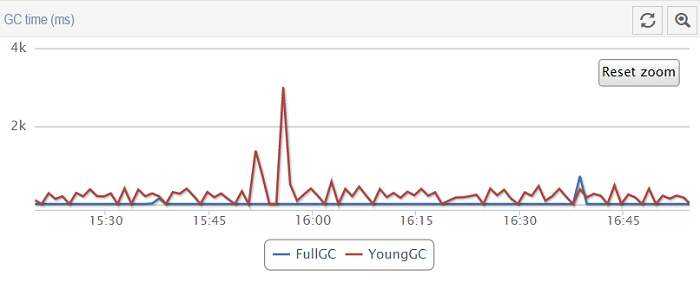
This is the YGC impact caused by a similar problem and the time consumption level reached by FGC.
If we minimize the memory distribution ratio of the young generation, the space in so2 may not be enough after copying objects from so1. Also, objects may enter the old generation prematurely. This will trigger FGC too early and large objects will lead to more memory fragments for the old generation. These fragments cannot be effectively used, resulting in early FGC. Therefore, the ratio setting is an issue of data balance. Through numerous experiments and verifications, engineers at Alibaba indicate that the 10:1:1 ratio is the optimal setting.
The ratio settings of the young generation will influence the local cache access. Also, improper use of the local cache will impact the JVM. This is known as the large object. For example, declaring a List attribute in a class to store several million bytes of data will trigger vicious GC if the List occupies 1GB to 2GB of the overall heap memory.
Generally, the object may occupy tens to hundreds of megabytes. Since the List serves as the local cache, the survival cycle of the young generation is longer. If the size of the List does not exceed the size of So, JVM will not throw the object to the old generation in advance. As a result, the So copying process repeats multiple times during the collection of the young generation (15 times by default). Returning to the USB drive example, we can see that the repeated copying operations produce bad results, even if you downsize or enlarge the ratio of Eden and So.
To summarize:
Why does the improper use of multiple threads lead to GC problems?
Java can use Xmx and Xms to set heap memory size. In a broad sense, the off-heap memory refers to the VM memory that remains after the Java heap and permanent generation memories are removed, including:
Allocation of threads in the off-heap memory occurs by default. Xss is also known as ThreadStackSize (thread stack space). The default size of Xss of JDK1.4 is 256KB, and the default size of Xss of JDK1.5+ is 1 MB.
When virtual machine memory is limited, larger heap memory leaves less space for off-heap memory. Off-heap memory size also limits the number of threads. When the number of threads exceeds the off-heap memory size, System.gc () warns JVM to perform GC. If the -XX: DisableExplicitGC parameter appears in JVM, the role of this parameter is equivalent to invalidating "System.gc."
In this case, the off-heap memory can only watch itself blow up and then throw StackOverFlowError or OutOfMemoryError: unable to create new native thread. In general, Taobao servers will use -XX: ExplicitGCInvokesConcurrent in place of DisableExplicitGC to turn the original FGC into the concurrent GC of the CMS.
The improper use of threads leads to frequent GC of applications. Theoretically, you can set a smaller Xss or reduce the heap memory size to increase the number of threads, depending on the circumstances.
You can specify the -XX: + UseTLAB parameter to set allocating threads directly in the heap memory. The Thread Local Allocation Buffer (TLAB) is used to allocate the buffer for local threads. This parameter will directly assign a space in the heap memory.
Remember the following key points when using local cache:
While important, these points are not always easy to follow. Splitting large objects is not a simple matter in many business processes because it involves dynamic resizing for the splitting. Additionally, you will need to invest more on design for the same type of data, which increases structural complexity.
There is no getting around JVM for development. Some developers pin their eyes on the non-heap memory of JVM. Non-heap memory does not have the garbage collection mechanism and the data is usually collected at a GC together. Thus, storing the data in non-heap memory seems to be a good way to bypass the JVM-GC without increasing design complexity.
While studying the mature usage practices of non-heap memory in the market, many mature products can be found. However, none of them have seamless code access, long-term experiments, or even multi-party cooperation. These are generally required to achieve a satisfactory result. Some mature middleware products of Java non-heap memory are listed below.
All of the above non-heap memories have the following limitations:
While the above limitations stand true, non-heap memory is the future of the local cache system.
This blog focuses on the concept of caching and its applications. Two types of cache – local and cluster – were discussed along with their advantages and disadvantages. This article also sheds light on GC and large local caching, as well as the potential of non-heap memory.
Changing the Way of Continuous Delivery with Docker (Part 1)

2,593 posts | 793 followers
Followkehuai - May 15, 2020
Farah Abdou - January 23, 2026
Alibaba Cloud Native Community - March 1, 2022
Alibaba Clouder - July 8, 2020
Kidd Ip - September 30, 2025
Alibaba Clouder - August 15, 2018

2,593 posts | 793 followers
Follow Data Lake Storage Solution
Build a Data Lake with Alibaba Cloud Object Storage Service (OSS) with 99.9999999999% (12 9s) availability, 99.995% SLA, and high scalability
Learn More Storage Capacity Unit
Plan and optimize your storage budget with flexible storage services
Learn More Hybrid Cloud Storage
A cost-effective, efficient and easy-to-manage hybrid cloud storage solution.
Learn More Hybrid Cloud Distributed Storage
Provides scalable, distributed, and high-performance block storage and object storage services in a software-defined manner.
Learn MoreMore Posts by Alibaba Clouder
Raja_KT March 8, 2019 at 4:05 am
I am not a big fan of JVM model in Big data but caching in general plays an important role in latency