In this article, we dive into a scenario that discusses a rapidly growing business with an application that provides users with e-commerce data statistics web services. The application adopts the common distributed Nginx + app architecture, and to overcome the performance issues and bugs, it's needed to set up monitoring for the application services to improve the quality of application operation. This article will discuss the ins and outs on how to navigate around this difficult issue.
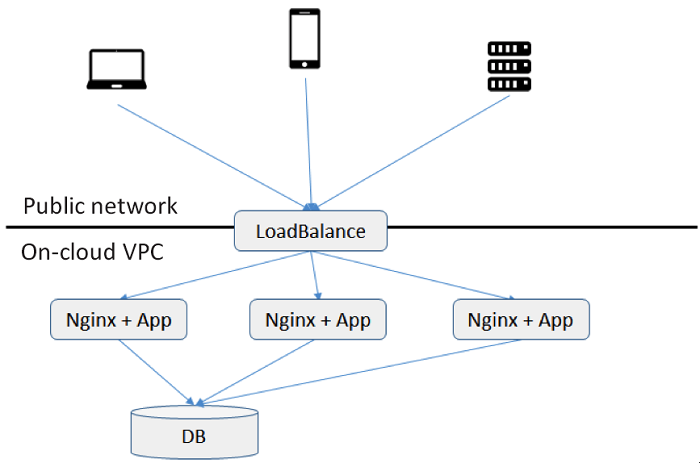
A small internet startup James works with has been running its application on a domestic Cloud A. The application adopts the common distributed Nginx + app architecture to provide users with e-commerce data statistics web services. The application is performing well except for occasional bugs and performance issues.

Recently, James's manager assigned James the task of setting up monitoring for the application services to improve the quality of application operation. James's manager has primarily three requirements:
b) Based on point a), generate real-time statistical data on the number of occurrences of various response values of various services, such as 200, 404 and 500;
c) Based on point b), issue real-time alarms if the number of calls of a type of response value exceeds the set limit;
In the manager's words, "The solution should be as versatile, quick, good and cost-effective as possible, and it is ideal setting up the monitoring platform on the A Cloud. James must not place the data on a third-party cloud, mainly to save on public traffic costs and simplify preparation for future big data analysis."
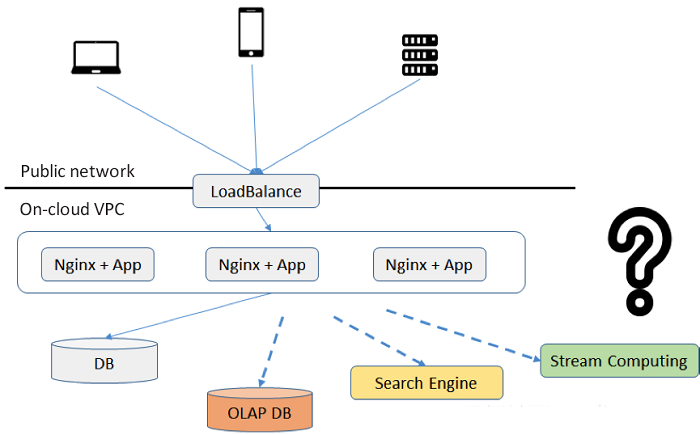
James begins with technical model selection after receiving the brief on his mission. Now, he has three feasible options from which he has to choose: the traditional OLAP-style approach, search engines, and real-time computing approach, as depicted below:

Post analyzing the status quo and numerous techniques, his findings were:
As the company is not a small-scale business, the average QPS, during the day, in peak hours could go beyond 100, considering that the business is still growing rapidly. For this reason, it is inappropriate to store the information called hundreds of times per second directly to the database for real-time queries. The cost is too high, and the architecture is not suitable for expansion.
A Cloud provides search engine services, and its error statistics can essentially meet the business requirements. However, there are two uncertainties in this case. On the one hand, the search engine price and storage costs are high (search engines need to introduce index storage), and the company cannot guarantee various types of aggregate queries such as the query response time of interface response time statistics. On the other hand, considering the real-time alarming feature, there is a need to write APIs for endless polls of various call error counts, for which the performance and cost are not certain.
Based on real-time computing architecture, it processes all the online logs for real-time aggregation computing in the memory in the service, returns value error type and time dimensions, and then stores persistently to the storage. On the one hand, a real-time calculation can be highly efficient, as it greatly reduces the size of aggregated results in comparison with the raw data. Thereby reducing the persistence cost and ensuring real-time processing. On the other hand, we can validate the alarm policies, in real time, in the memory to minimize the alarm performance overhead.
Considering the factors mentioned above, the real-time computing-based architecture seems to be the best fit for the current needs of the company. Once the decision is final, James begins to explore the architectural design deeply.
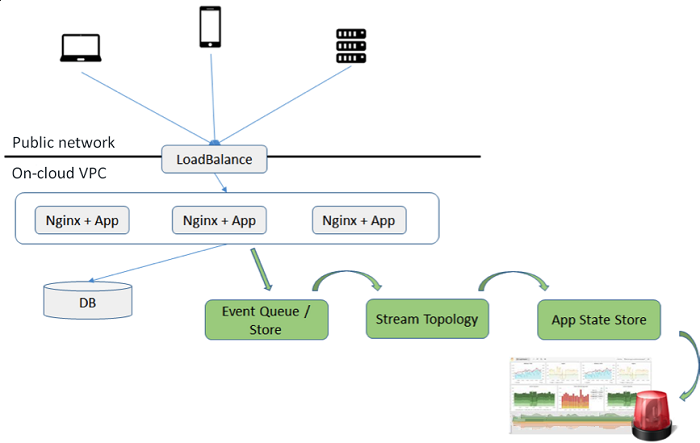
Post determining that the most suitable technology should be one with the backbone as real-time computing, James begins to design the architecture. After thorough research and by referring to various technical websites, he concluded that the following components are indispensable for structuring a reliable website monitoring solution.
The data channel is responsible for pulling data from Nginx and sending it to the search engine. It also undertakes the tasks of data accumulation and data recalculation.
The aggregation real-time computing logic in the error code and time dimensions based on the Nginx service is based on chosen engine. At the same time, the computing engine is also responsible for alarm logic.
This is the location where the Nginx monitoring stores the results. Taking into account that the monitoring results, although in a simple table structure, have a variety of dimensions of queries, a storage type similar to the OLAP is preferable.
Demonstration portal carries out the rapid analysis and presentation of all dimensions for all Nginx monitoring results.
Below is a depiction of a suitable architecture diagram in such a scenario:

Fortunately, A Cloud provides ready-made products for the first three components. Hence James does not need to build them one by one, lowering the entry threshold.
With approval from his manager on the budget, James begins to activate a variety of products for development testing. The target duration for accomplishing this mission is one month.
The long journey of development of this architecture began with a simple activation process. Within less than half a day, Kafka, Storm, HBase tenants, and clusters were ready. Unfortunately, as the saying goes, program developers spend 80% of the time of a development project on the final 20% pitfalls. One month elapsed with less than 70% of the project features completed. James encountered the following pitfalls and recorded them in his technical blog:
The integrated components include data channels, real-time computing layer, and background storage. The data push logic, as well as alarm query logic, are integrated into the code, and if any link suffers a slight error, it blocks the entire link. Further, the debugging cost is very high.
During the development, to get the push logic of related application adjustments, after the content of each Nginx log changes, there is need to change the API push logic on each service end. However, the change process is lengthy and error-prone.
The appropriate design of tables and databases for the monitoring items is essential to avoid index hotspots. One needs to ensure that the database writes idempotence of data results when the real-time computing layer instability leads to repeated calculation. This is a major challenge for the table structure design.
If Nginx log data sending delays due to reasons that pertain to the application, it is not possible to ensure that one can accurately calculate delayed data, such as data delayed for one hour, by the real-time computing engine and the results merged into the previous results.
Consider setting time-bound tasks for all results to traverse and query the data every minute. For example, when the services with 500 call errors account for more than 5% of the total, multiple call result traversals, then you should consider conducting queries for all such services. Another challenge is to avoid missing any service error checks while ensuring efficient queries.
Sometimes due to log delay, the normal log of servers in the last minute has not completed collection, resulting in a temporary proportion of more than 5% of services with local 500 call errors. Will the system trigger an alarm for such errors? If it does trigger an alarm, there may be false alerts. However, if not, how should one handle such a case?
Taking UV as an example, if you want to query UV for any time span, it will also involve storing the full IP access information per unit of time (such as minutes) in the database in a conventional manner. This is unacceptable regarding storage utilization. Is there a better solution?
For various call errors with 500 returned values, the business expects that it is possible to query the detailed call input parameters and other details in the required time or called service dimensions for the emergence of 500 errors. The scenario resembles log search. For similar new requirements, it seems that we cannot fulfill this requirement through real-time aggregation computing and storage. Hence, we need to find another way.
The issues mentioned above are add-on challenges to the various problems discussed earlier in this article.
With two months gone by with James trying to counter and find a solution to these challenges, and with the project half done, James begins to get anxious.
This article dove into a scenario that discusses a rapidly growing business with an application that provides users with e-commerce data statistics and web services. The application adopts the common distributed Nginx + app architecture, and to overcome the performance issues and bugs, we needed to set up monitoring for the application services to improve the quality of application operation. While finding the correct method to go about it and exploring various options, the best one comes out to be Real-time Computing Approach. It not only performs real-time aggregation computing but also persistently and efficiently stores data while reducing overheads. We discuss the application architecture design, its components, the challenges encountered and the essential go-to solution components for businesses, provided by Alibaba Cloud.
Root Cause Analysis and Countermeasures of Common Issues of Websites

2,593 posts | 793 followers
FollowKidd Ip - September 15, 2025
Alibaba Clouder - May 27, 2019
Alibaba Cloud Native - November 9, 2022
Alibaba Clouder - March 2, 2021
Alibaba Clouder - March 3, 2021
Alibaba Cloud Indonesia - October 3, 2023

2,593 posts | 793 followers
Follow Architecture and Structure Design
Customized infrastructure to ensure high availability, scalability and high-performance
Learn More Super App Solution for Telcos
Alibaba Cloud (in partnership with Whale Cloud) helps telcos build an all-in-one telecommunication and digital lifestyle platform based on DingTalk.
Learn More mPaaS
mPaaS
Help enterprises build high-quality, stable mobile apps
Learn More DevOps Solution
Accelerate software development and delivery by integrating DevOps with the cloud
Learn MoreMore Posts by Alibaba Clouder