The Kubernetes Container Service promotes decoupling of the technical stack and introduces stack layering to allow developers to concentrate more on their own applications and business scenarios. Decoupling of Kubernetes also witnesses further development. One of the prospects for the container technology is running containers on the serverless infrastructure.
When talking about the infrastructure, we often think of cloud. Currently, AWS, Alibaba Cloud, and Azure provide the serverless Kubernetes service on the cloud. On the serverless Kubernetes, we no longer care about clusters and machines. Applications can be started so far as the container image, CPU, memory, and external service mode are declared.

The preceding figure shows the classic Kubernetes and serverless Kubernetes. When the classic Kubernetes is transformed to the serverless Kubernetes, log collection becomes more complex:
What should be emphasized is that not all logs must be processed in real time. "T+1" delivery of logs is still important. For example, the day-level delay is sufficient for BI logs, and the 1-hour delay is sufficient for ctr logs.
However, in some scenarios, second-level or more timely logs are essential. The X coordinate in the following figure shows the importance of data timeliness on decision making from left to right.
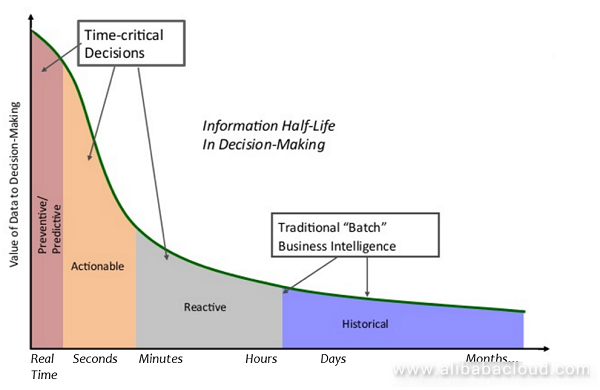
Two scenarios are provided to explain the importance of real-time logs on decision making:
Logs may come from various sources, such as files, database audit logs, and network packets. For the same copy of data, different users (such as developers, O&M personnel, and operation personnel) may have different ways of repeatedly consuming the log data for different purposes (such as alerting, data cleansing, real-time searching, and batch computing).
In regard to system integration of log data, the part from the data source to the storage node, and then to the computing node can be defined as a pipeline. As shown in the following figure, log processing is being transformed from O(N^2) pipelines to O(N) pipelines from top to bottom.
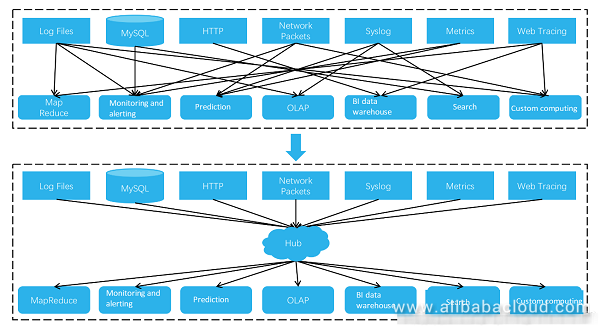
In the past, diversified logs are stored using different methods, and the collection to computing links cannot be shared or reused. The pipelines are very complex, and redundancy exists in data storage. Currently, a hub is used for log data integration to simplify complexity of the log architecture and optimize the storage usage. This infrastructure-level hub is very important. It must support real-time pub/sub, process highly concurrent write/read requests, and provide massive storage space.
The previous section summarizes the trend of Kubernetes log processing. This section will describe some common log collection solutions.
To view logs of a Kubernetes cluster, the most basic solution is to log on to the machine and run the kubectl logs command. Then the stdout/stderr written by the container is displayed.
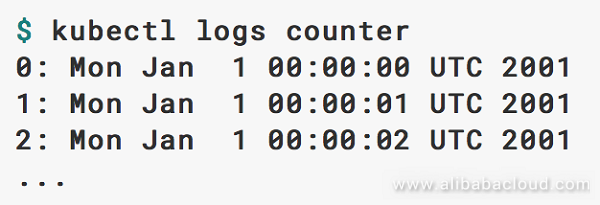
The basic solution has the following constraints:
Logs are processed in the Kubernetes node dimension. The docker engine redirect the container stdout/stderr to the logdriver. Multiple modes can be configured on the logdriver to achieve persistence of logs. For example, save files in JSON format to the local storage.
Compared with the kubectl command line, this solution implements local storage of logs. Linux tools, such as grep awk, can be used to analyze the log files.
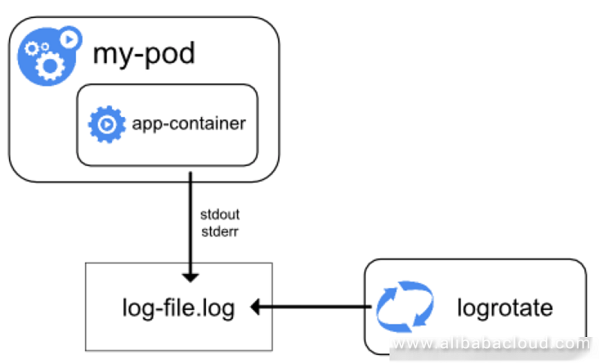
This solution brings us back to the era of physical machines, but still fails to solve many problems:
An upgraded version of this solution is to deploy the log collection client on the node to upload logs to the centralized log storage device. It is currently the recommended solution and will be introduced in the next section.
In sidecar mode, in addition to the service container, there is also a log client container in a pod. This log client container collects the standard outputs, files, and metrics of the containers inside the pod, and reports them to the server.
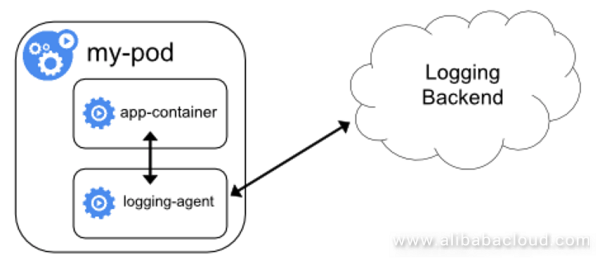
This solution address some basic function requirements, such as log persistent storage. However, the following two aspects are yet to be improved:
Generally, the application itself is modified to implement the direct write solution. Several logs are organized within the program and the HTTP API is called to send data to the log storage backend.

The benefit is that the log format can be customized as needed, and the log sources and destination routes can be configured as required.
This solution has the following constraints in use:
In the most architectures currently available, log collection is completed by a log client installed on each Kubernetes node. Kubernetes officially recommends the open source Fluentd released by treasure data. Fluentd is highlighted by its high performance and balanced plugin richness.
A lot of communities also use the open source Beats series released by Elastic. Beats delivers a high performance, but supports less plugins. For every type of data, a specific client must be deployed. For example, Filebeats must be deployed to collect text files.
Some architectures use Logstash. Logstash features rich ETL support, but implementation of JRuby results in a poor performance.

After formatting data, the log client uses the specified protocol to send data to the storage end. A common choice is Kafka. Kafka supports real-time subscription and repeated consumption. At the later stage, Kafka can synchronize data to other systems based on the business requirements. For example, Kafka sends service logs to Elastic Search for keyword query, and is used together with Kibana to implement log visualization analysis. In financial scenarios, logs must be stored for a long time. Kafka data can be delivered to the storage with a high cost performance, such as AWS S3.
This architecture looks simple and effective, but some problems are yet to be resolved under Kubernetes:
We propose the Kubernetes log processing architecture for the log service to supplement the community solutions, and try to resolve some experience issues of log processing in the Kubernetes scenario. This architecture can be summarized as "Logtail + Log service + Ecosystem".
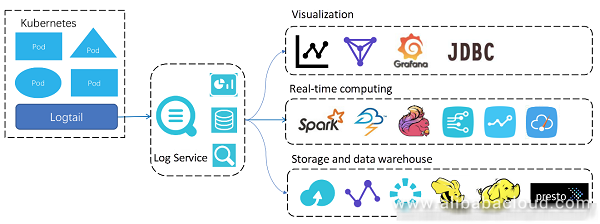
Logtail is a data collection client of the log service, which is designed to address some pain points in the Kubernetes scenario. According to the mode officially recommended by Kubernetes, only one Logtail client is deployed on a node to collect all the pod logs on this node.
For the two basic log requirements (including keyword search and SQL statistics), the log service provides the basic LogHub function to support real-time write-in and subscription of data. On the basis of the LogHub storage, users can enable or disable the data index analysis function. After this function is enabled, log keyword query and SQL syntax analysis are supported.
Data of the log service is open. The index data can be interconnected with a third-party system using the JDBC protocol. The SQL query results can be conveniently integrated with the Alibaba Cloud DataV or Grafana of the open source community. The high-throughput real-time read/write capability of the log service supports interconnection with the streaming systems. Streaming systems, such as Spark Streaming, Blink, and JStorm support the related connectors. Users can also use the fully-managed delivery function to write data into the Alibaba Cloud OSS. The delivery function supports the row storage (CSV or JSON) and column storage formats. The data can be used as the long-term low-cost backups, or used to implement data warehouse using the "OSS + E-MapReduce computing" architecture.
Characteristics of the log service are as follows:
By reviewing the trend and challenges for Kubernetes log processing, this section summarizes three advantages of the log service:
Kubernetes is originated from the communities. It is a correct choice to use open source software for Kubernetes log processing in some scenarios.
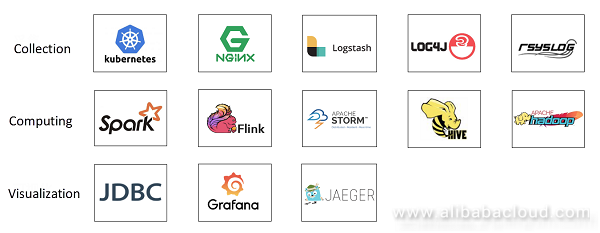
The log service ensures openness of data and interworks with the open source community to collect, compute, and visualize log data, enabling users to enjoy the technical achievements of communities.
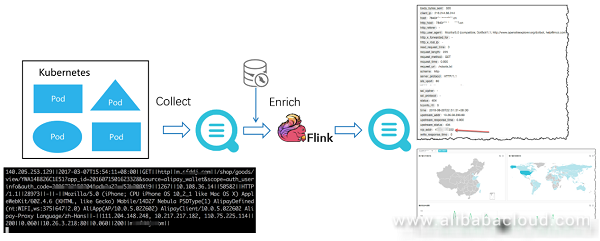
The following figure shows a simple example. The streaming engine Flink is used to consume the logstore data of the log service. Sharding of the source logstore and the Flink task are carried out concurrently to implement dynamic load balancing. After the data is joined with MySQL meta, the data is written into the logstore of another log service for visualized query through the streaming connector.
This section focuses on the design and optimization of the Logtail collection end, and details how Logtail address the pain points in Kubernetes log collection.
Logtail supports the at-least-once semantics, and use the file-level and memory-level checkpoint mechanisms to ensure resumable upload in the container restart scenario.
In the log collection process, many system or user configuration errors may occur, for example, log format parsing error. At this time, the parsing rules must be adjusted in time. Logtail provides the collection monitoring function, which sends the exception and statistical information to the logstore and supports the query and alarm functions.
The optimized computing performance resolves the problem of large-scale log collection on a single node. On the precondition that the log fields are not formatted (that is, in the singleline mode), Logtail can deliver a processing performance of 100 MB/s per CPU core. To handle the slow IO in network data sending, the client batch commits multiple logs to the server for persistence purpose, and meanwhile ensures the timeliness and high throughput of collection.
Within the Alibaba Group, millions of Logtail clients have been deployed and the stability is good.
To cope with complex and diversified collection requirements in the Kubernetes environment, Logtail supports the following data sources: stdout/stderr, log files of containers and host machines, and open protocol (such as syslog and lumberjack) data.
A log record is split into multiple fields based on semantics to obtain multiple key-value pairs, based on which the log record is mapped to the table model. In this way, the efficiency of log analysis is improved significantly. Logtail supports the following log formatting methods:
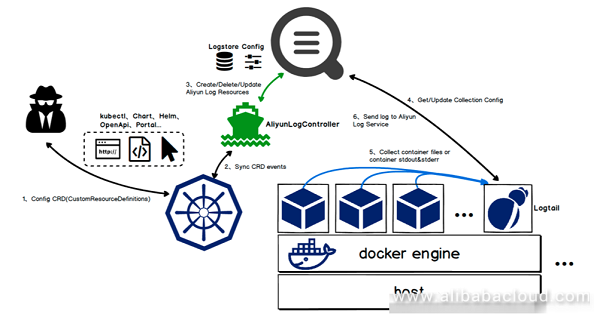
Containers can scale up or down by nature. Logs of a newly scale-up container must be collected in time; otherwise, the logs are lost. This requires the client to be able to dynamically sense the collection source, and the deployment and configuration must be easy enough. Logtail resolves the integrity issue of collected data from the following two aspects:
Deployment
Use the DaemonSet mode to quickly deploy Logtail on a Kubernetes node. This can be completed with only command. In addition, it is easy to release and integrate with the Kubernetes applications.
After the Logtail client is deployed on a node, it implements the dynamic container collection on the node through communication between the domain socket and docker engine. By means of increment scanning, the Logtail client can detect container changes on the node. Added with the periodical full scanning mechanism, the Logtail client ensures that no loss of a single container change event. This double assurance design enables the Logtail client to detect the candidate monitoring targets in a timely and complete manner.
Collection configuration management
From the very beginning, Logtail is designed with centralized collection configuration management on the server, which ensures that collection commands can be more efficiently sent from the server to the client. Such configuration management can be abstracted out as a "machine group + collection configuration" model. A Logtail instance in the machine group can instantly obtain the collection configuration associated with the machine group and then start the collection task.
For the Kubernetes scenario, Logtail is designed with the custom IDs to manage machines. A fixed machine ID can be declared for a type of pod. Logtail uses this machine ID to report the heartbeat to the server. Meanwhile, the machine group uses this custom ID to mange Logtail instances. When more Kubernetes nodes are deployed, Logtail reports the custom machine ID of the pod to the server, and the server sends the collection configuration associated with this machine group to Logtail. Currently, on an open source collection client, a common practice is to use the machine IP address or hostname to identify the client. When the container scales up or down, you must add or delete the machine IP address or hostname in the machine group; otherwise, data is lost before being collected. This must be ensured by a complex resizing process.
Logtail provides two collection configuration management methods, which can be selected by users based on their preferences:
The path from the log source to the log destination (logstore) is defined as a collection route. It is inconvenient to use a traditional solution to customize collection routes. The configuration must be completed on the local client, and the collection route must be hardcoded for every pod container. This results in the strong dependence on container deployment and management. Logtail uses environment variables to solve this problem. The Kubernetes env consists of multiple key-value pairs. You can configure the env when deploying a container Two configuration items, IncludeEnv and ExcludeEnv, are designed for the Logtail collection configuration to add or remove collection sources. As shown in the following figure, when the pod service container is started, the log_type environment variable is configured. In addition, IncludeEnv: log_type=nginx_access_log is defined in the Logtail collection configuration to collect the Nginx pod logs to a specified logstore.
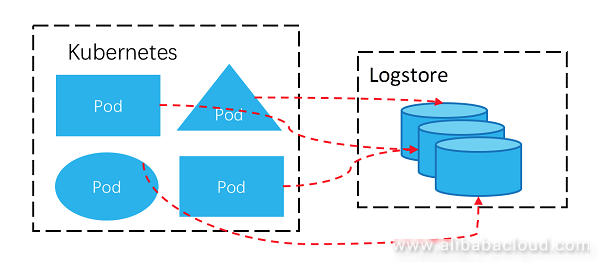
For all data collected on Kubernetes, Logtail automatically adds the pod, namespace, container, and image labels to facilitate subsequent data analysis.
Context query means that a user specifies a log record and then views its next or previous log records on the original machine or file location. It is similar to grep -A -B in Linux.
In some scenarios such as DevOps, this time sequence is need to help locate the logical exceptions. With the context viewing function, the troubleshooting efficiency can be improved. In the distributed system, it is difficult to ensure the original log sequence on both the source and destination.
On the collection client, Kubernetes may generate a lot of logs. The log collection software must use multiple CPU cores of the machine to parse and pre-process logs, and use the multithread concurrency or single thread asynchronous callback mode to handle the slow IO problem in network data sending. As a result, log data cannot arrive at the server according to the event generation sequence on the machine.
On the server of the distributed server, due to the horizontally expanded multi-node load balancing architecture, logs on the same client machine are distributed to multiple storage nodes. It is difficult to restore the original sequence based on logs that are distributed to multiple storage nodes.
In the traditional context query solutions, logs are sequence twice based on the time that logs arrive at the server and the log service time field, respectively. When the amount of data is huge, such solutions have the sequencing performance and insufficient time accuracy problems, and the real sequence of events cannot be restored.
Logtail is integrated with the keyword query function of the log service to solve this problem.
When logs of a container file are being collected and uploaded, the data packets are composed of multiple logs, which correspond to a block (for example, 512 KB) of a specific file. Multiple logs in this data packet are sequenced based on the log sequence of the source file. This means, the next log of a log may be in the same or the next data packet.
When collecting logs, Logtail sets a unique log source ID (sourceId) for this data packet, and a packet auto incrementing ID (packageID) in the uploaded packet. In each package, any log contains the package offset.
Although data packets are stored on the server in a disordered way, the log service has the indexes that help accurately seek the data packet with the specified sourceId and packageId.
If you specify the No.2 log (source_id: A, package_id: N, offset: M) of container A and view its context, the system first checks the offset of the log to determine whether the log is the last log in the current packet. The number of logs in the packet is defined as L, and the offset of the last log in the packet is (L - 1). If the offset (M) is smaller than (L - 1), the location of the next log is (source_id: A, package_id: N, offset: M+1). If the current log is the last log of the packet, the location of the next log is (source_id: A, package_id: N+1, offset: 0).
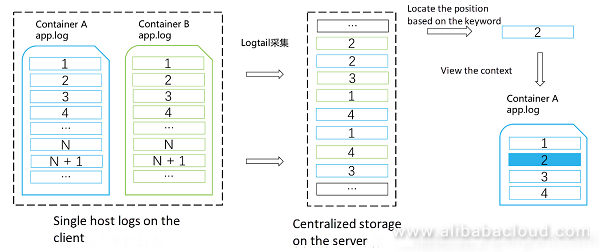
In most scenarios, for a packet obtained through keyword-based random query, context query for L times (current packet length) is supported. This not only improves the query efficiency, but also significantly reduces the random IO times of the backend service.
Running an ASP.NET Core Web Application on Alibaba Cloud Elastic Computing Service (ECS)

2,593 posts | 793 followers
FollowAlibaba Clouder - September 24, 2020
Alibaba Clouder - February 19, 2021
Alibaba Clouder - January 12, 2021
Alibaba Developer - March 3, 2020
Alibaba Container Service - August 25, 2020
Alibaba Developer - March 3, 2020

2,593 posts | 793 followers
Follow Container Service for Kubernetes
Alibaba Cloud Container Service for Kubernetes is a fully managed cloud container management service that supports native Kubernetes and integrates with other Alibaba Cloud products.
Learn More Simple Log Service
An all-in-one service for log-type data
Learn More Function Compute
Alibaba Cloud Function Compute is a fully-managed event-driven compute service. It allows you to focus on writing and uploading code without the need to manage infrastructure such as servers.
Learn MoreMore Posts by Alibaba Clouder