By Jeremy Pedersen
Welcome back! This week we're taking a look at PAI Studio, a drag-and-drop machine learning tool that makes it easy for anybody to build and train machine learning models.
PAI Studio is a drag-and-drop tool for building Machine Learning systems. It's a built-in part of Alibaba Cloud's Machine Learning Platform for AI (also called "PAI"), alongside other tools like PAI DSW (a Jupyter notebook service) and PAI EAS (a model deployment service).
The idea behind PAI Studio is to make it easy for people who are new to Machine Learning to get started training and deploying models, with little to no coding required.
PAI studio lets you build Machine Learning workflows by dragging-and-dropping components onto a dashboard, like this one:
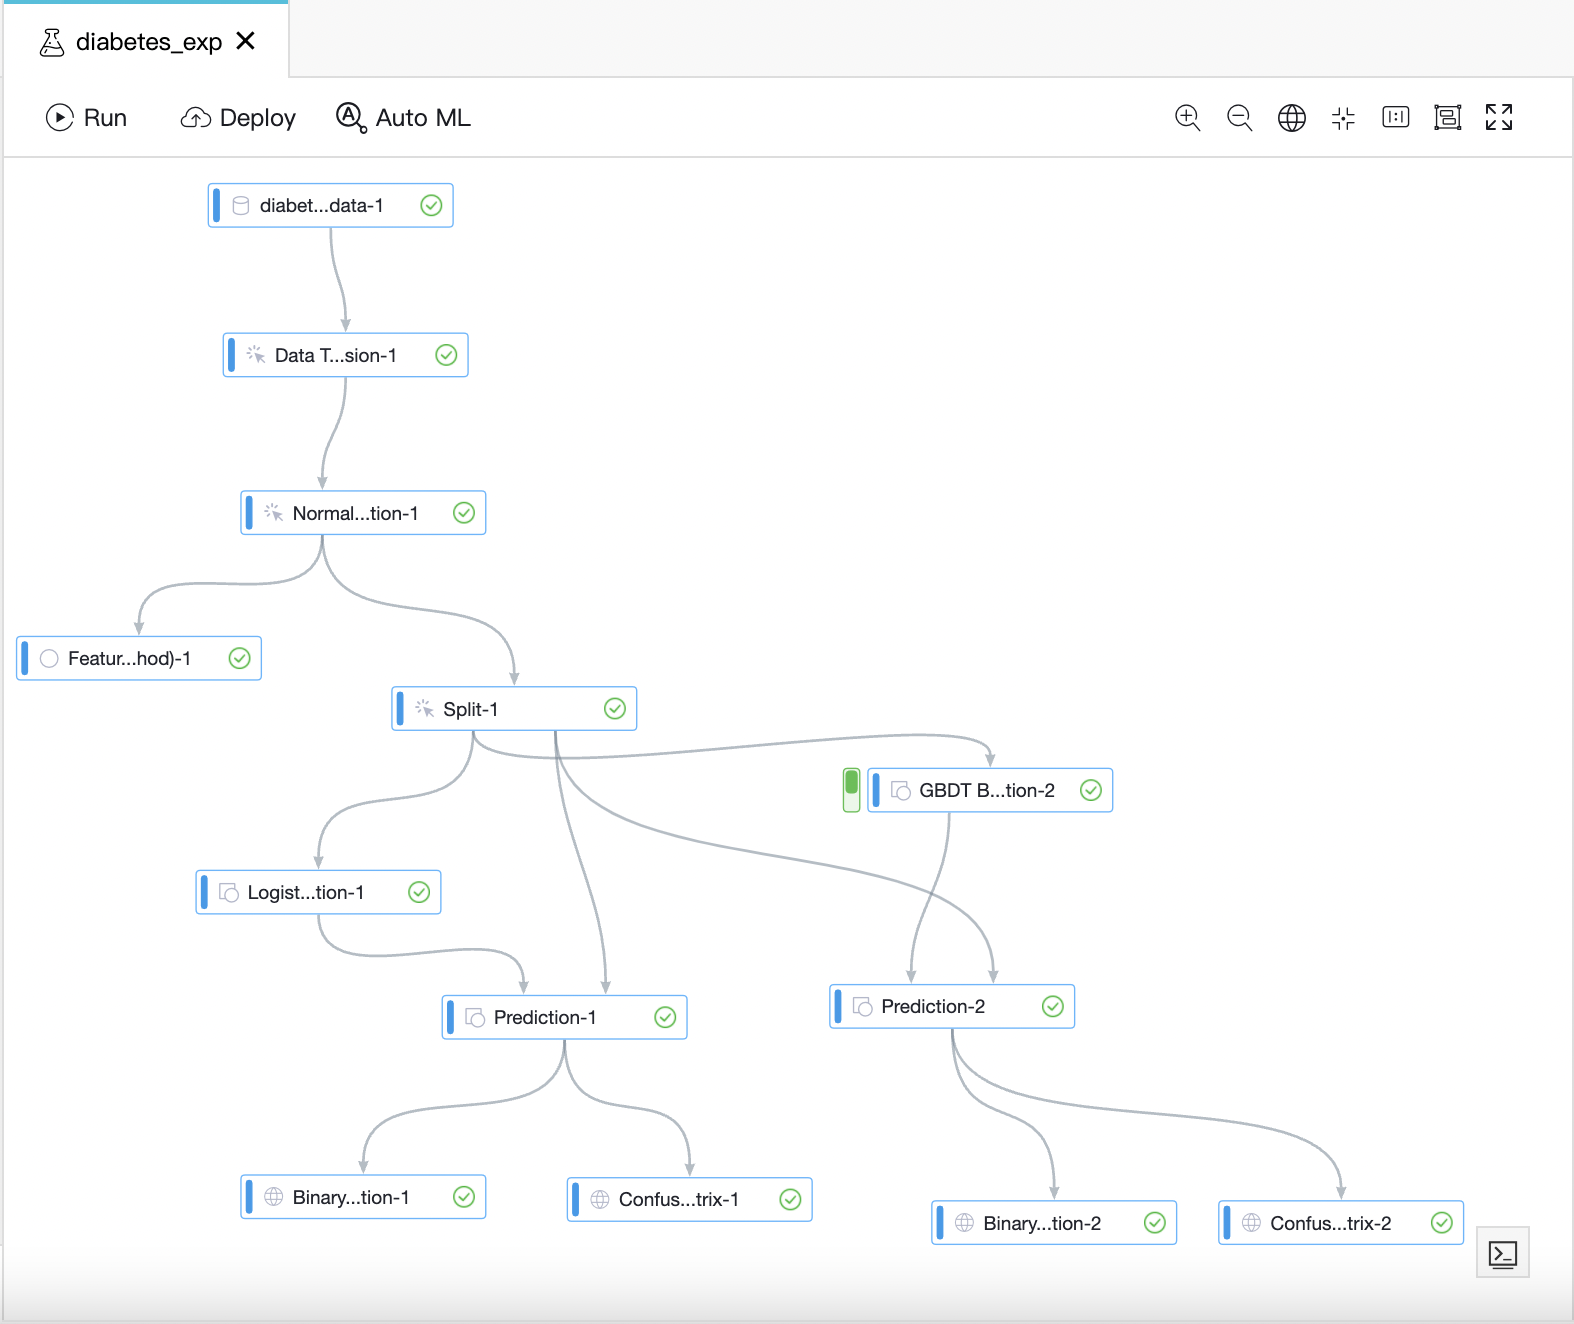
Of course, the best way to understand PAI Studio is to try it for yourself. The rest of this blog post will take you through the steps needed to build and train your own Logistic Regression model to detect diabetes.
We'll use sample data from Kaggle, which I will provide links to later.
First, a little background: PAI Studio runs its machine learning tasks on top of Alibaba Cloud's batch computing engine, MaxCompute.
MaxCompute itself is just a compute engine. To interact with MaxCompute, we use another tool called DataWorks.
Thus, to start using PAI Studio, we need to:
Although this might seem complicated, it's quite easy to do from the Alibaba Cloud web console. Follow along with the steps below to create your own PAI Studio project.
Note: You should use the "basic edition" of DataWorks, which is free, and the Pay-As-You-Go version of MaxCompute. This will ensure that you are only charged when your model is being actively trained, and even then the fees will be very low, since our example dataset is so small. Running all the steps in this blog should cost you well below 1.00 USD.
First, we need to create a DataWorks Workspace:
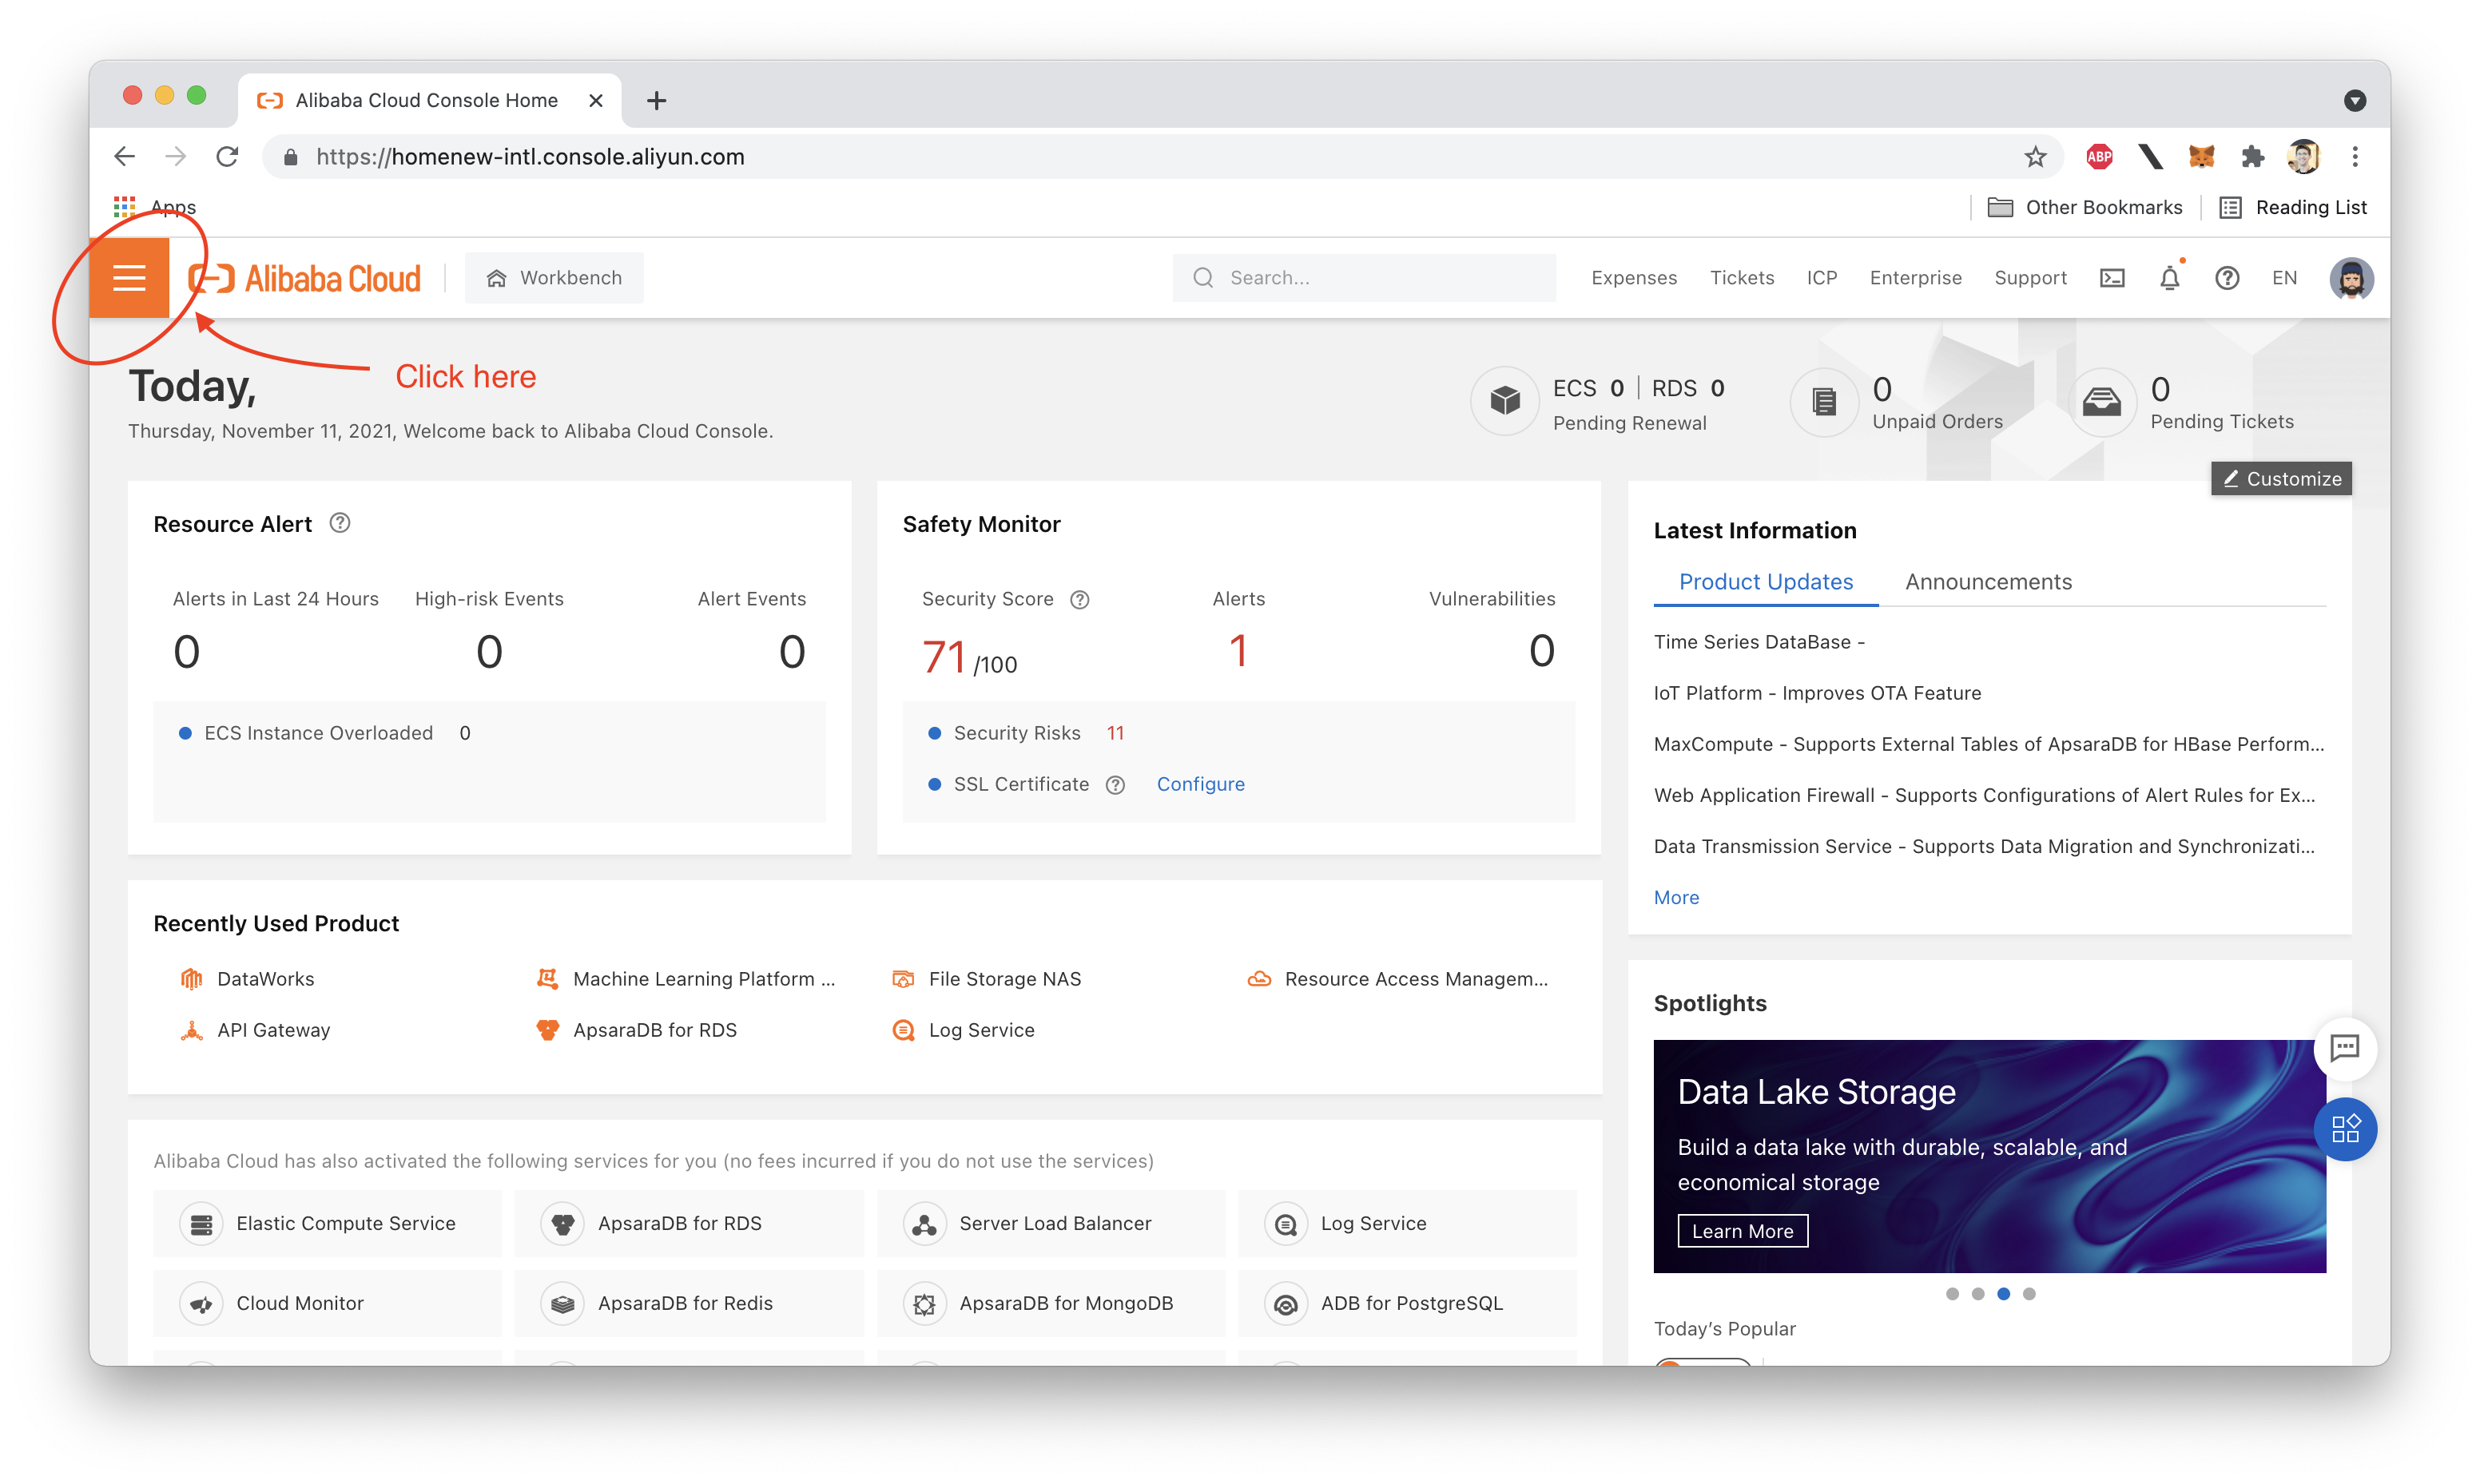
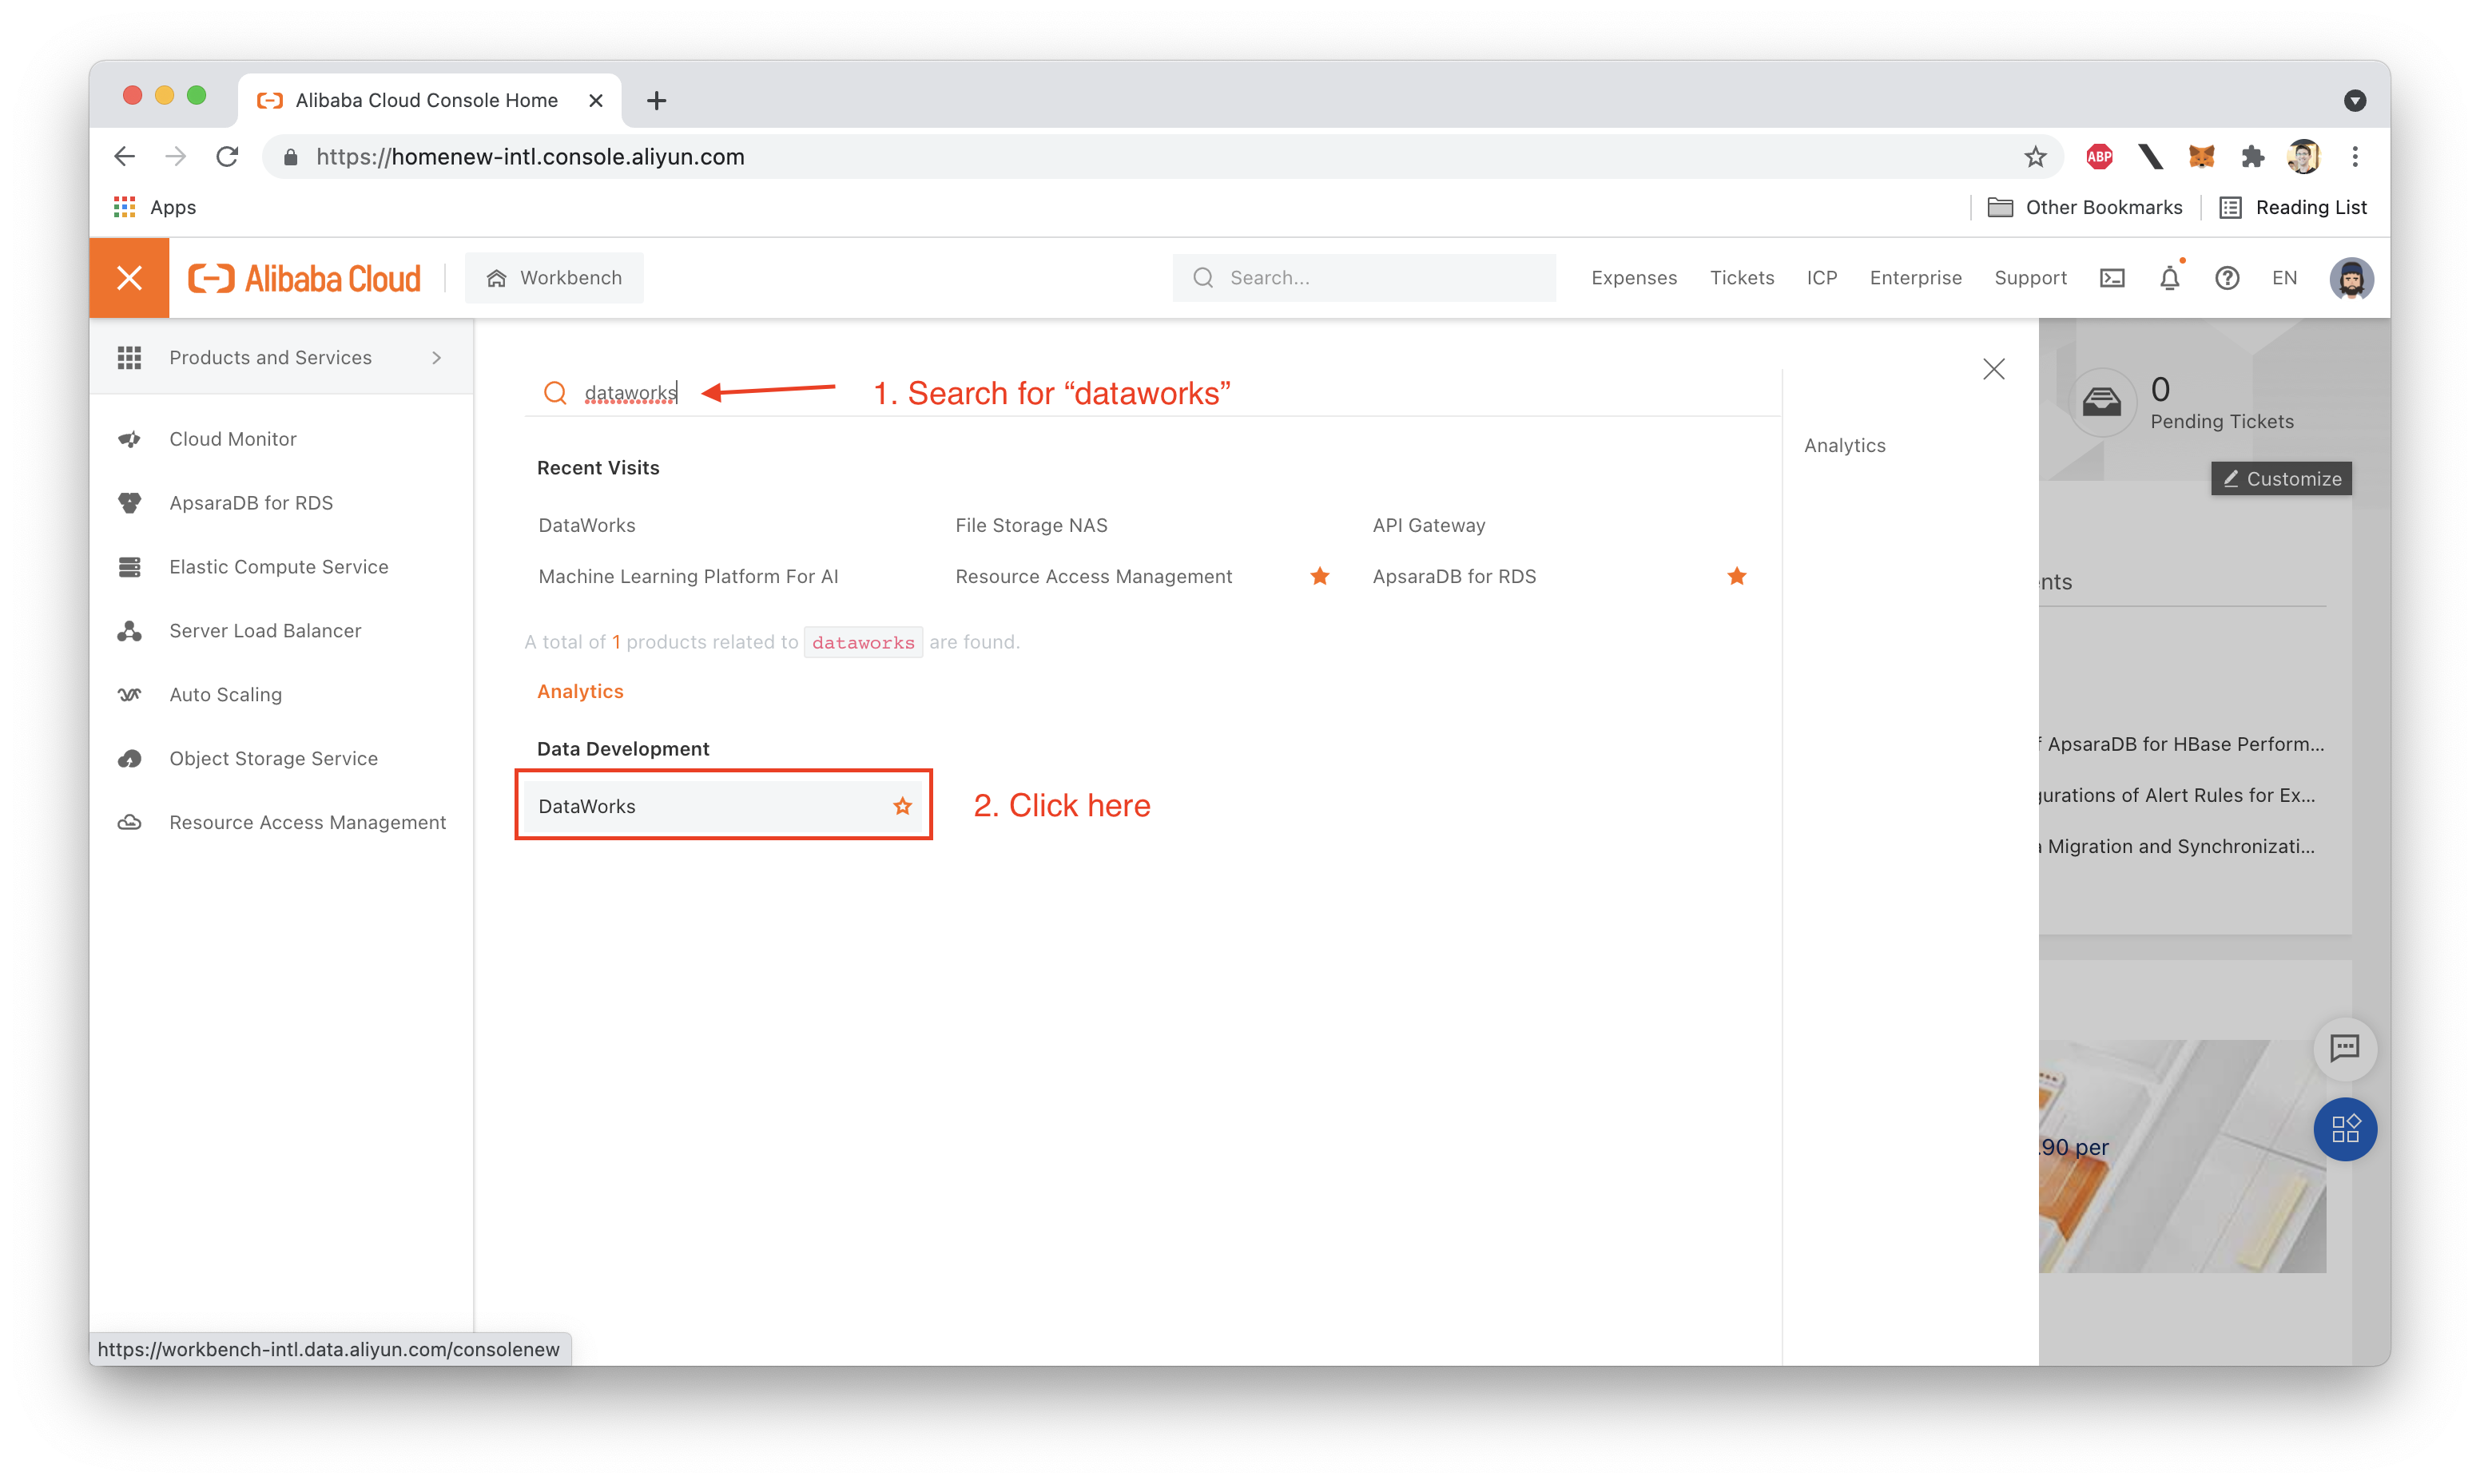
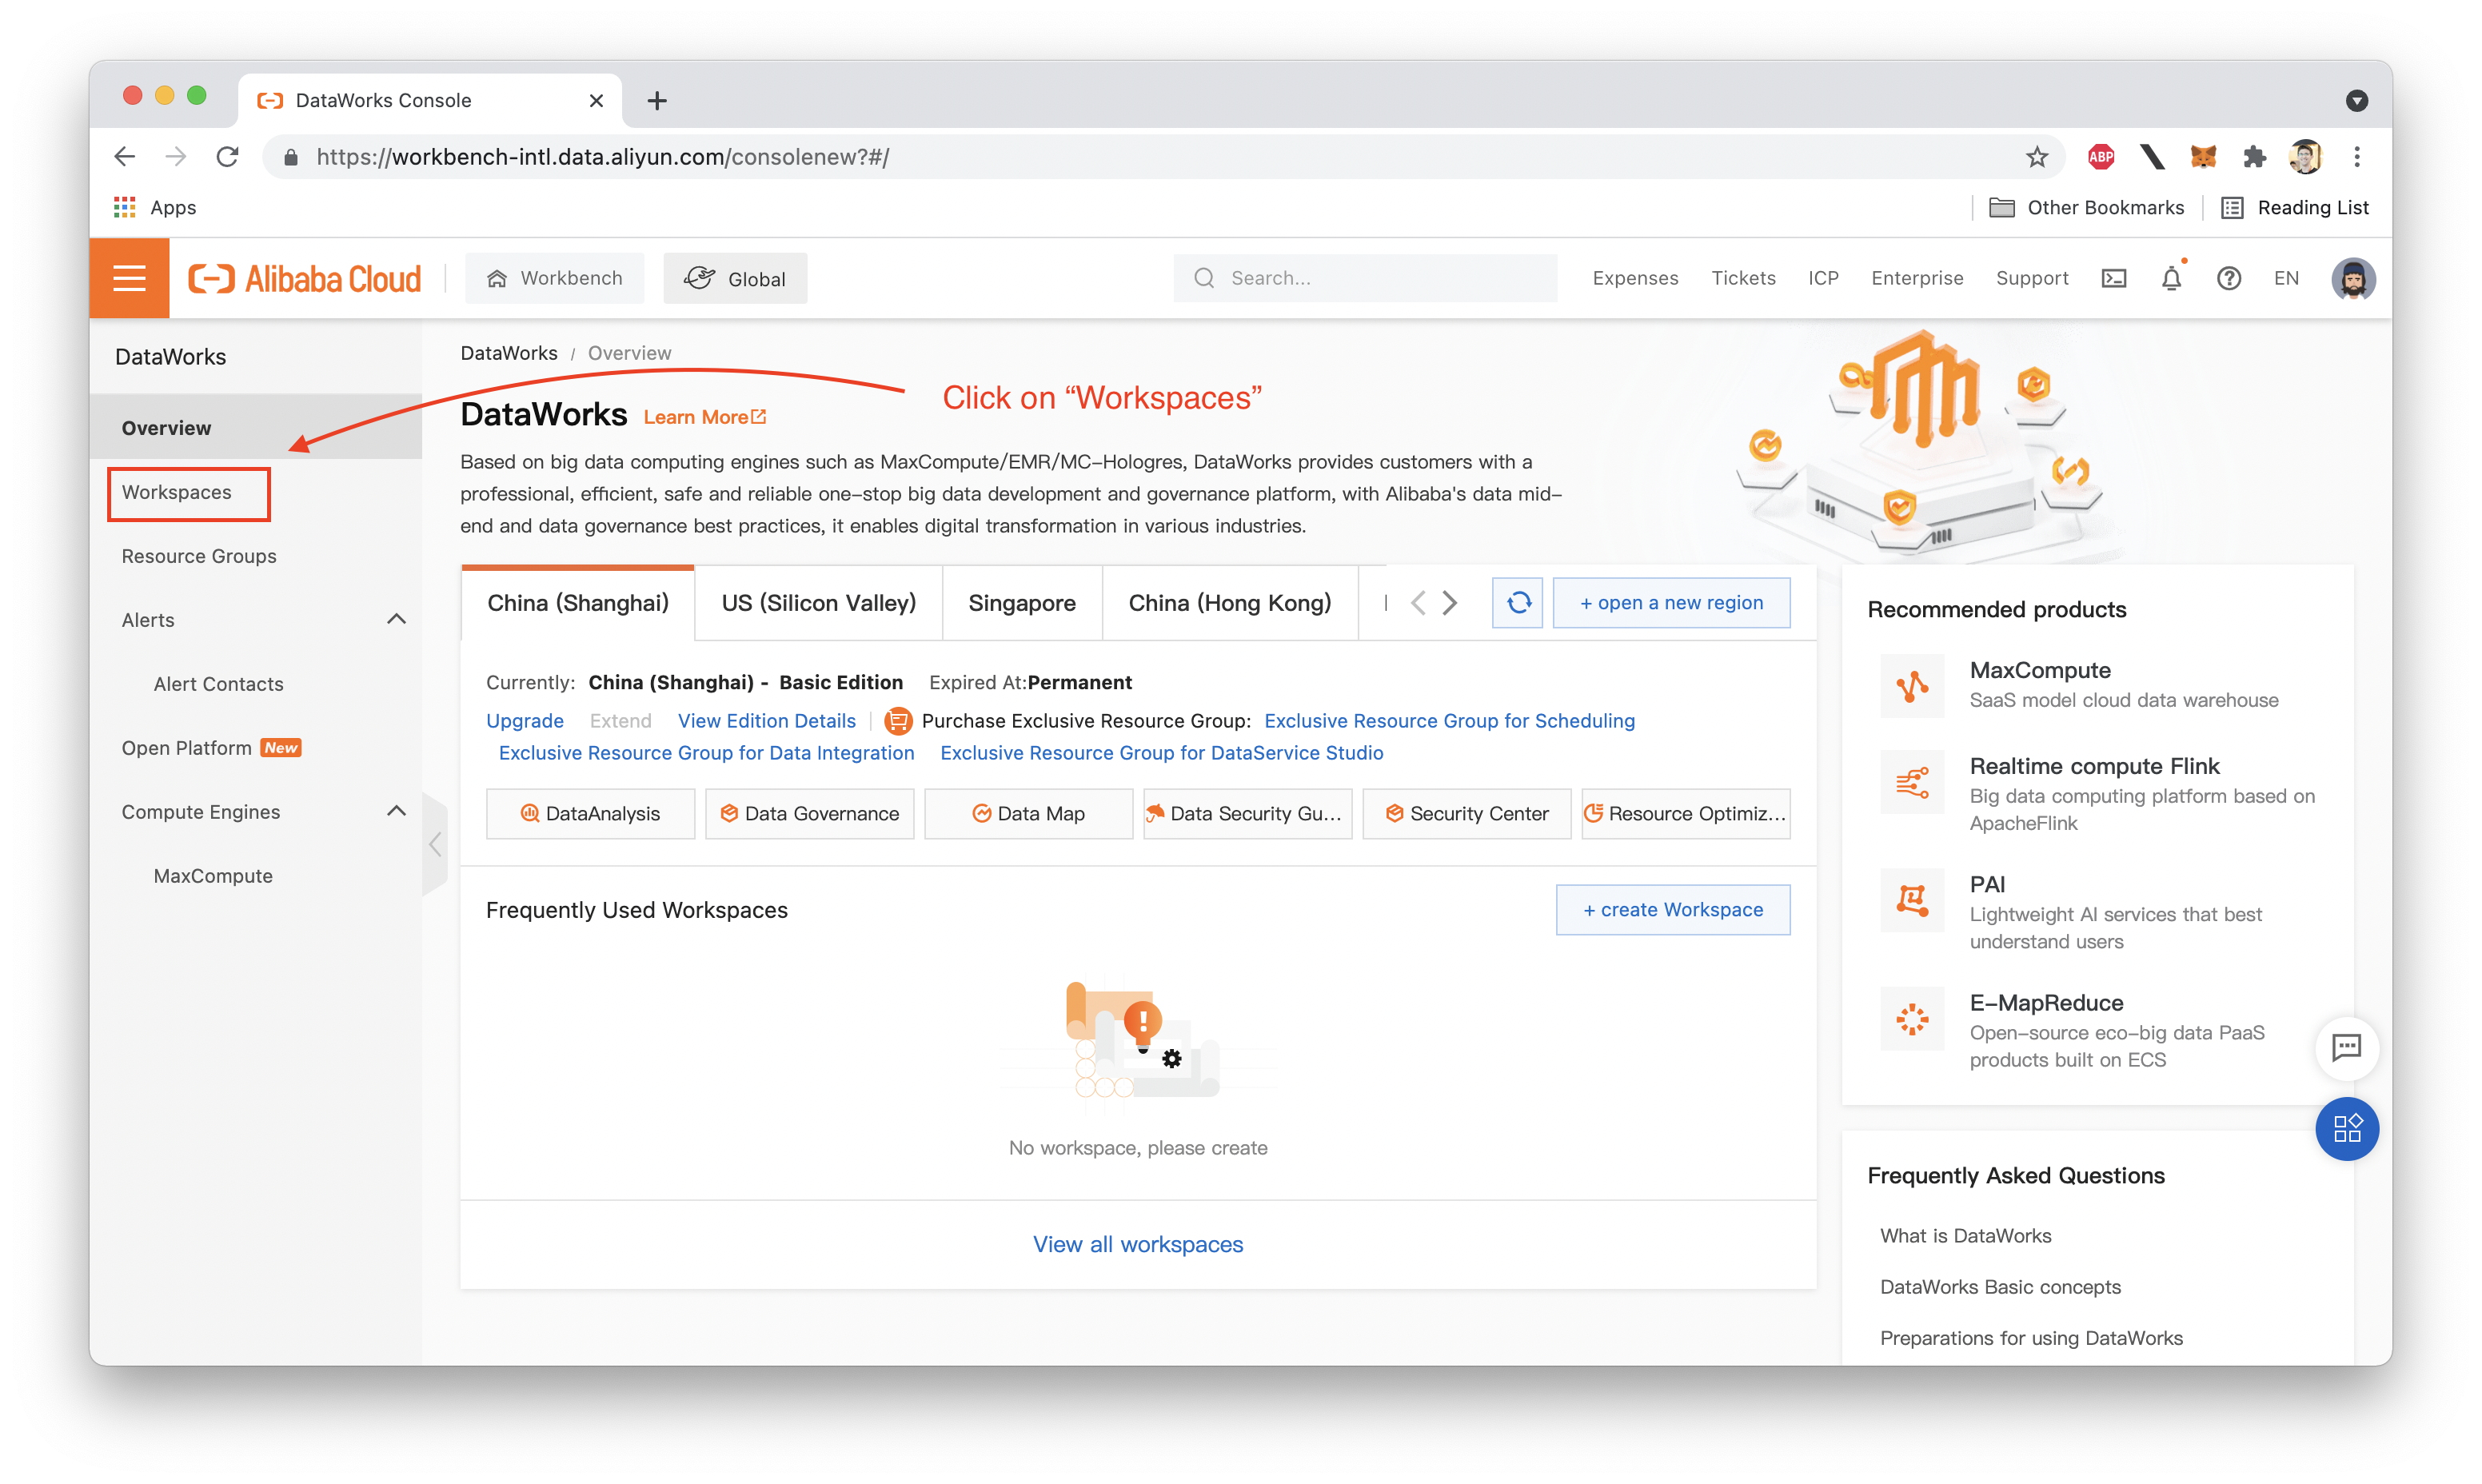
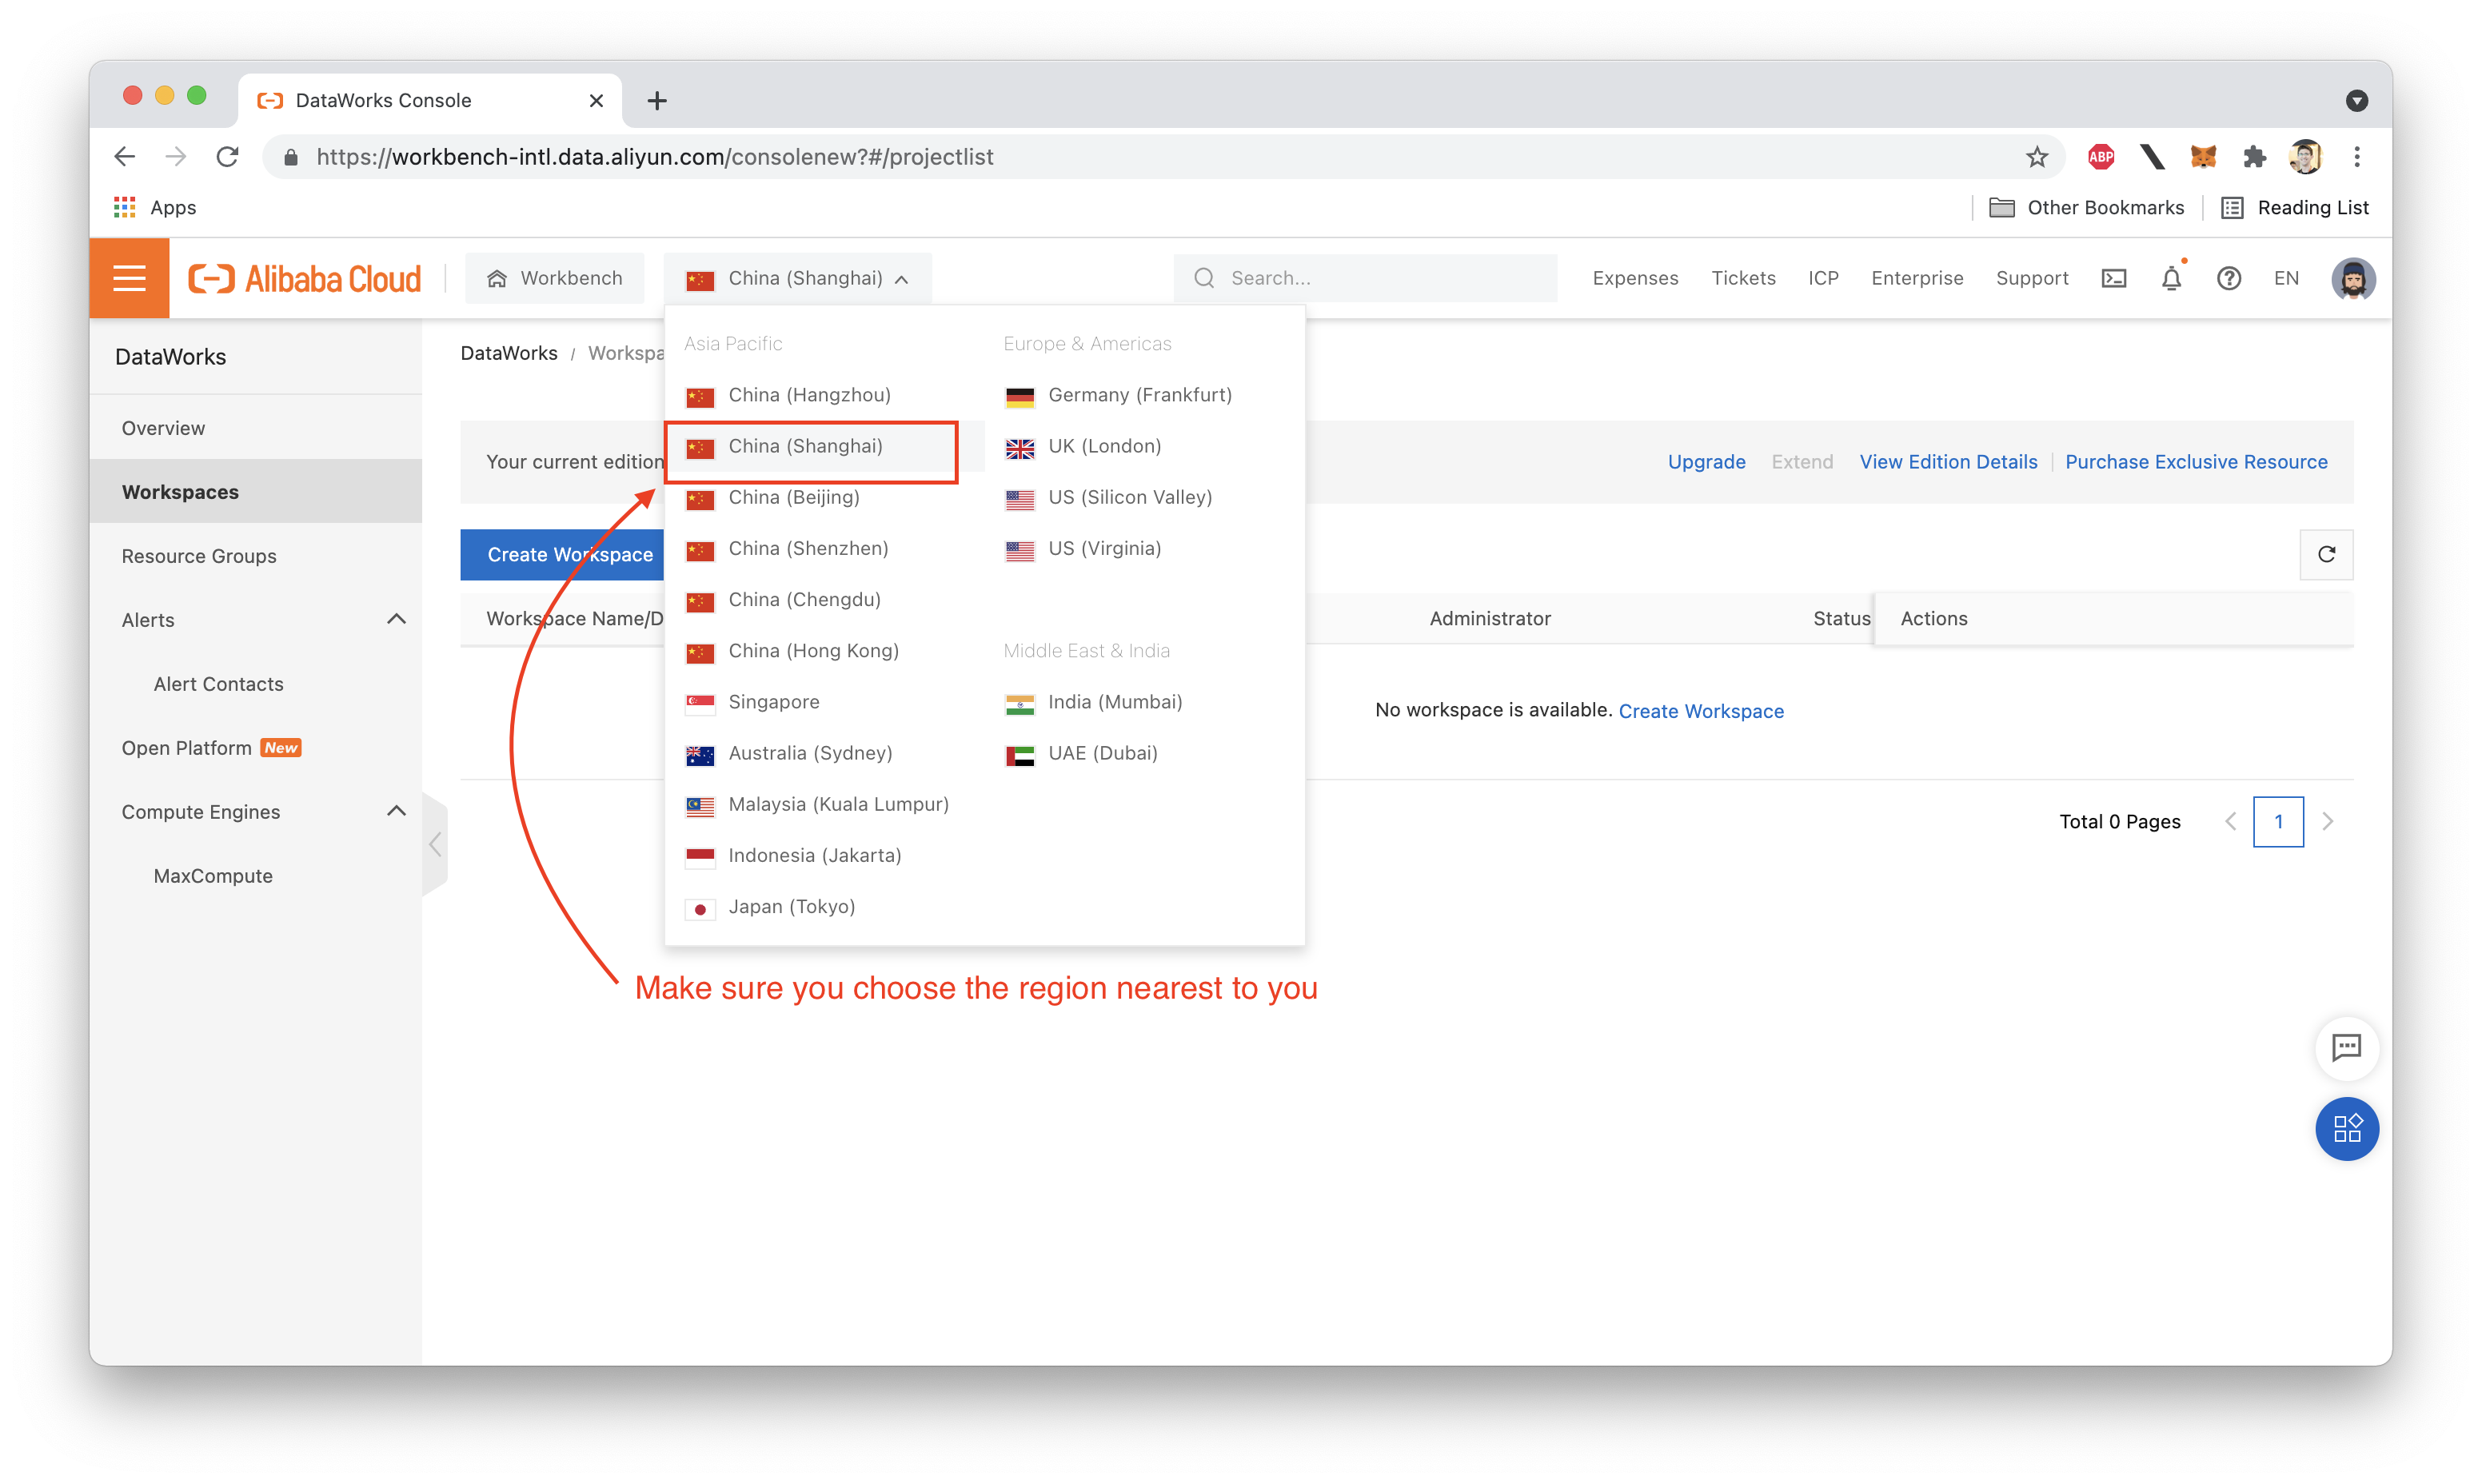
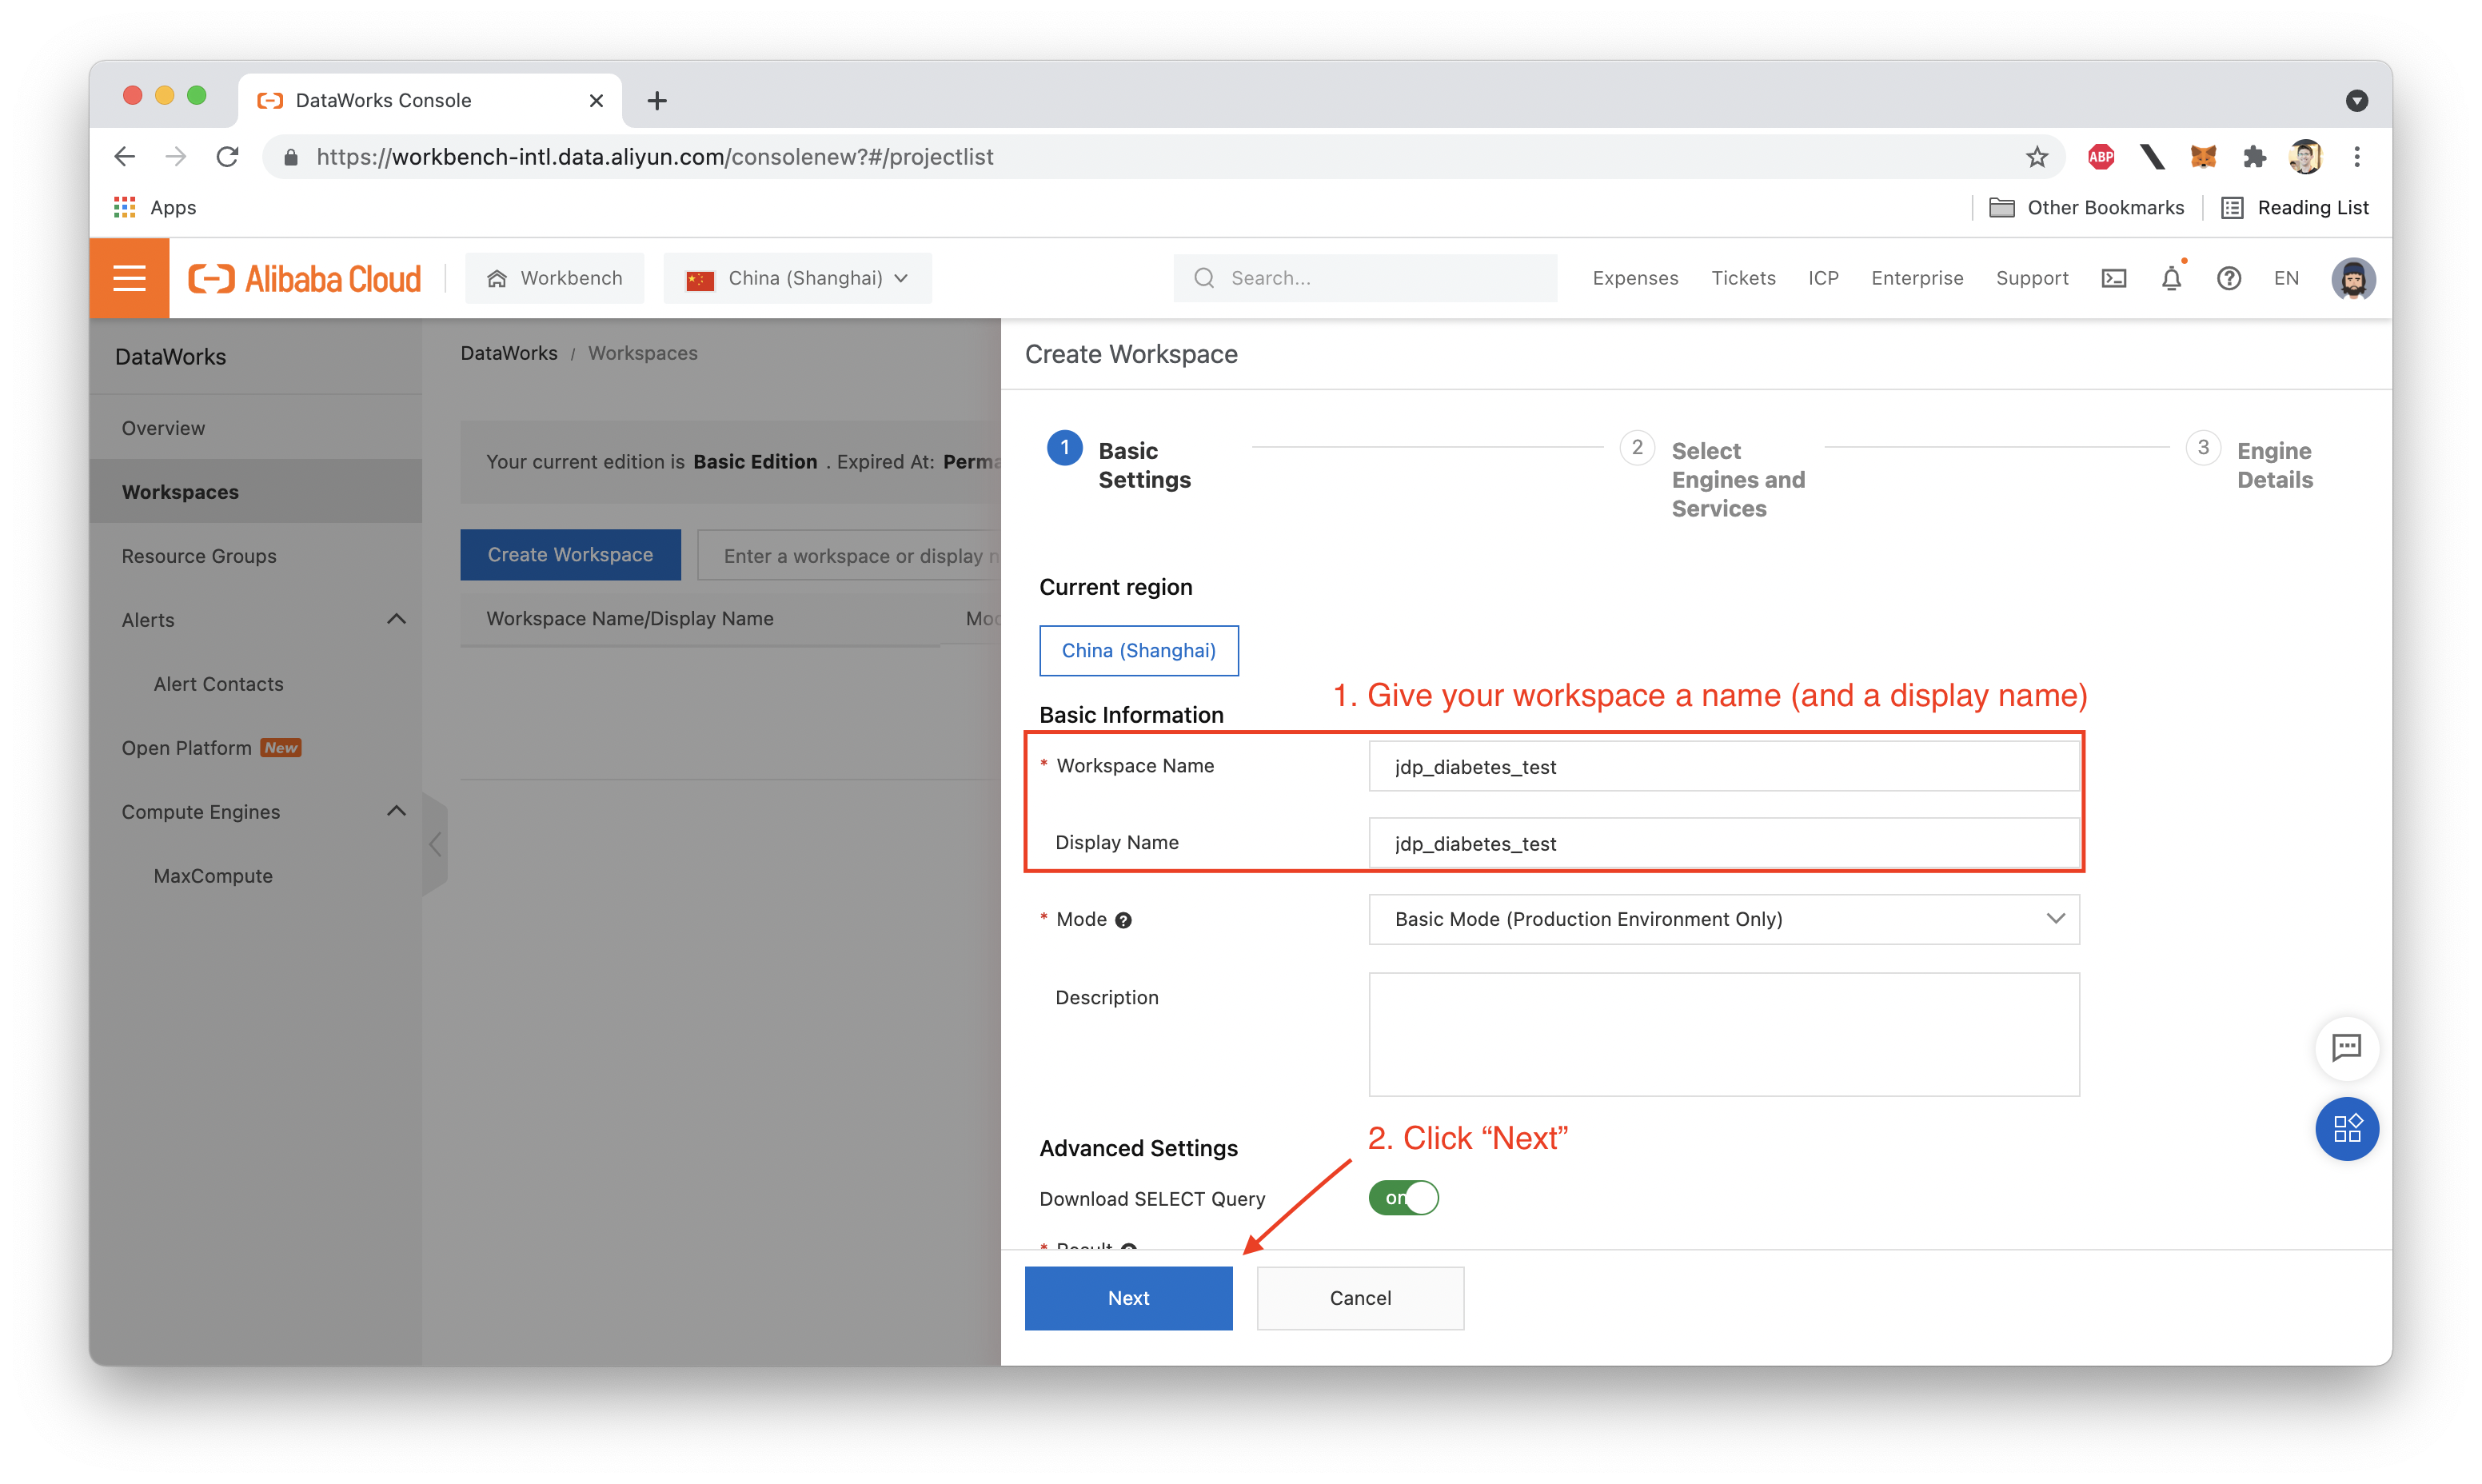
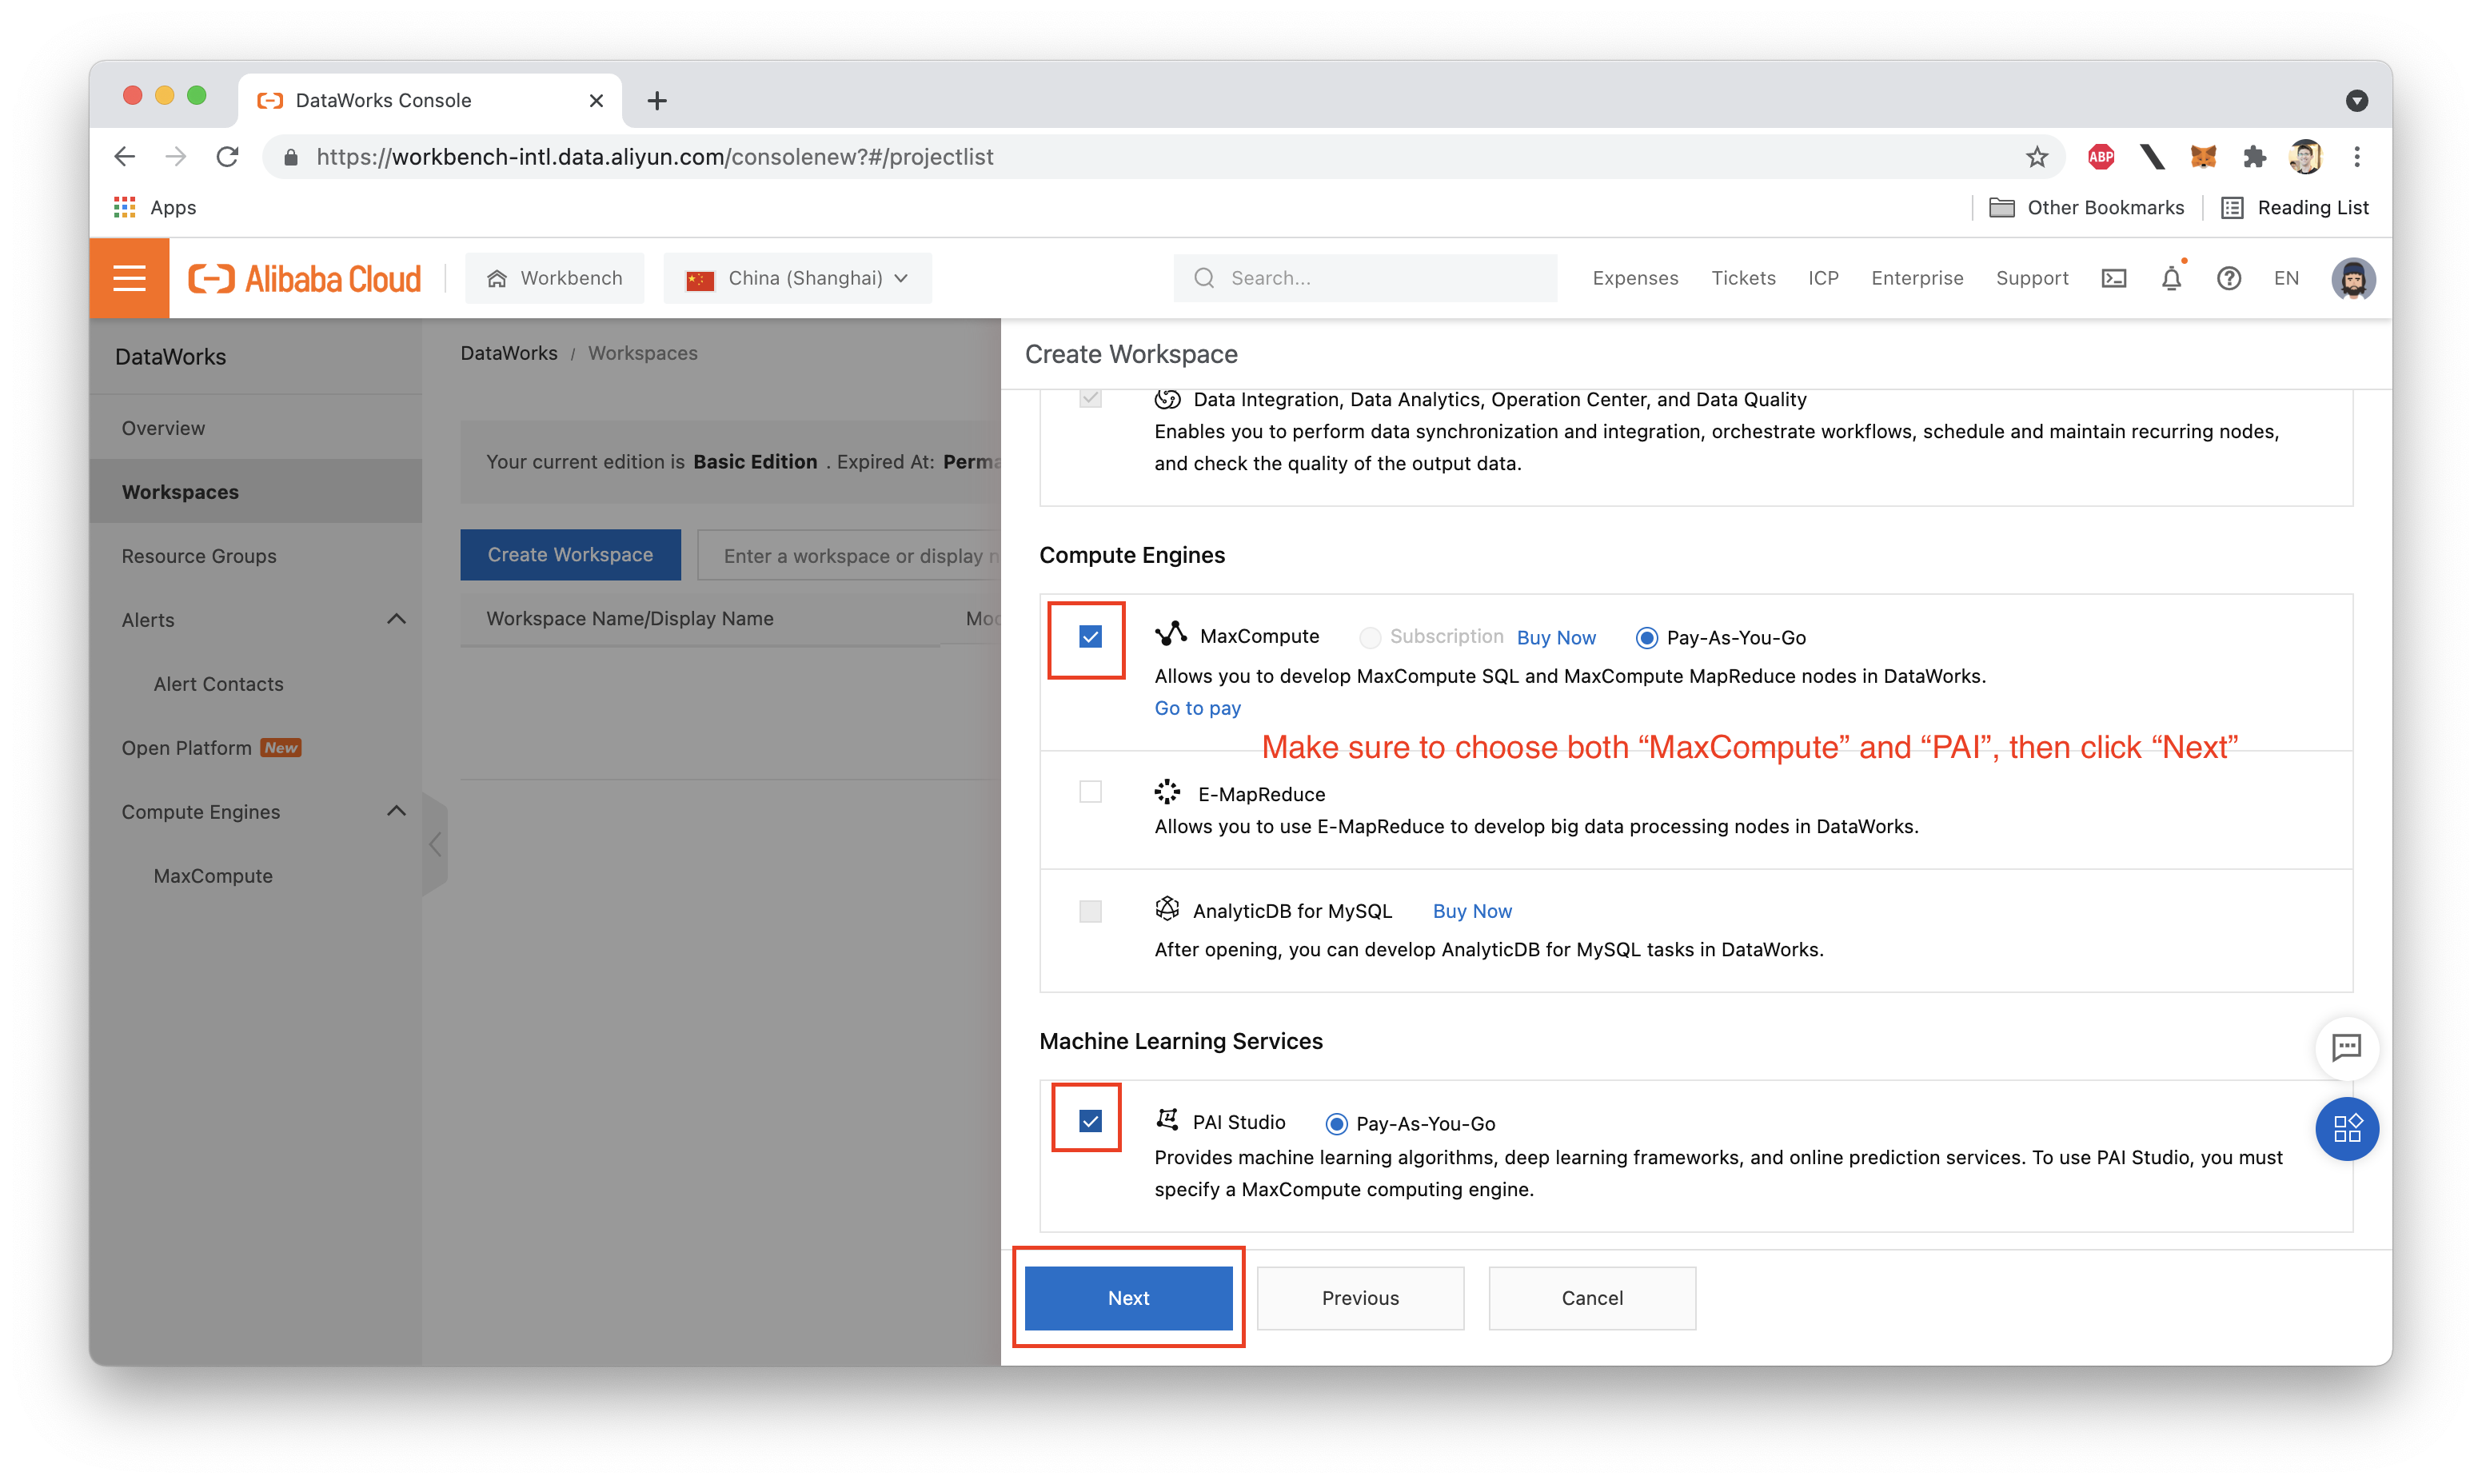
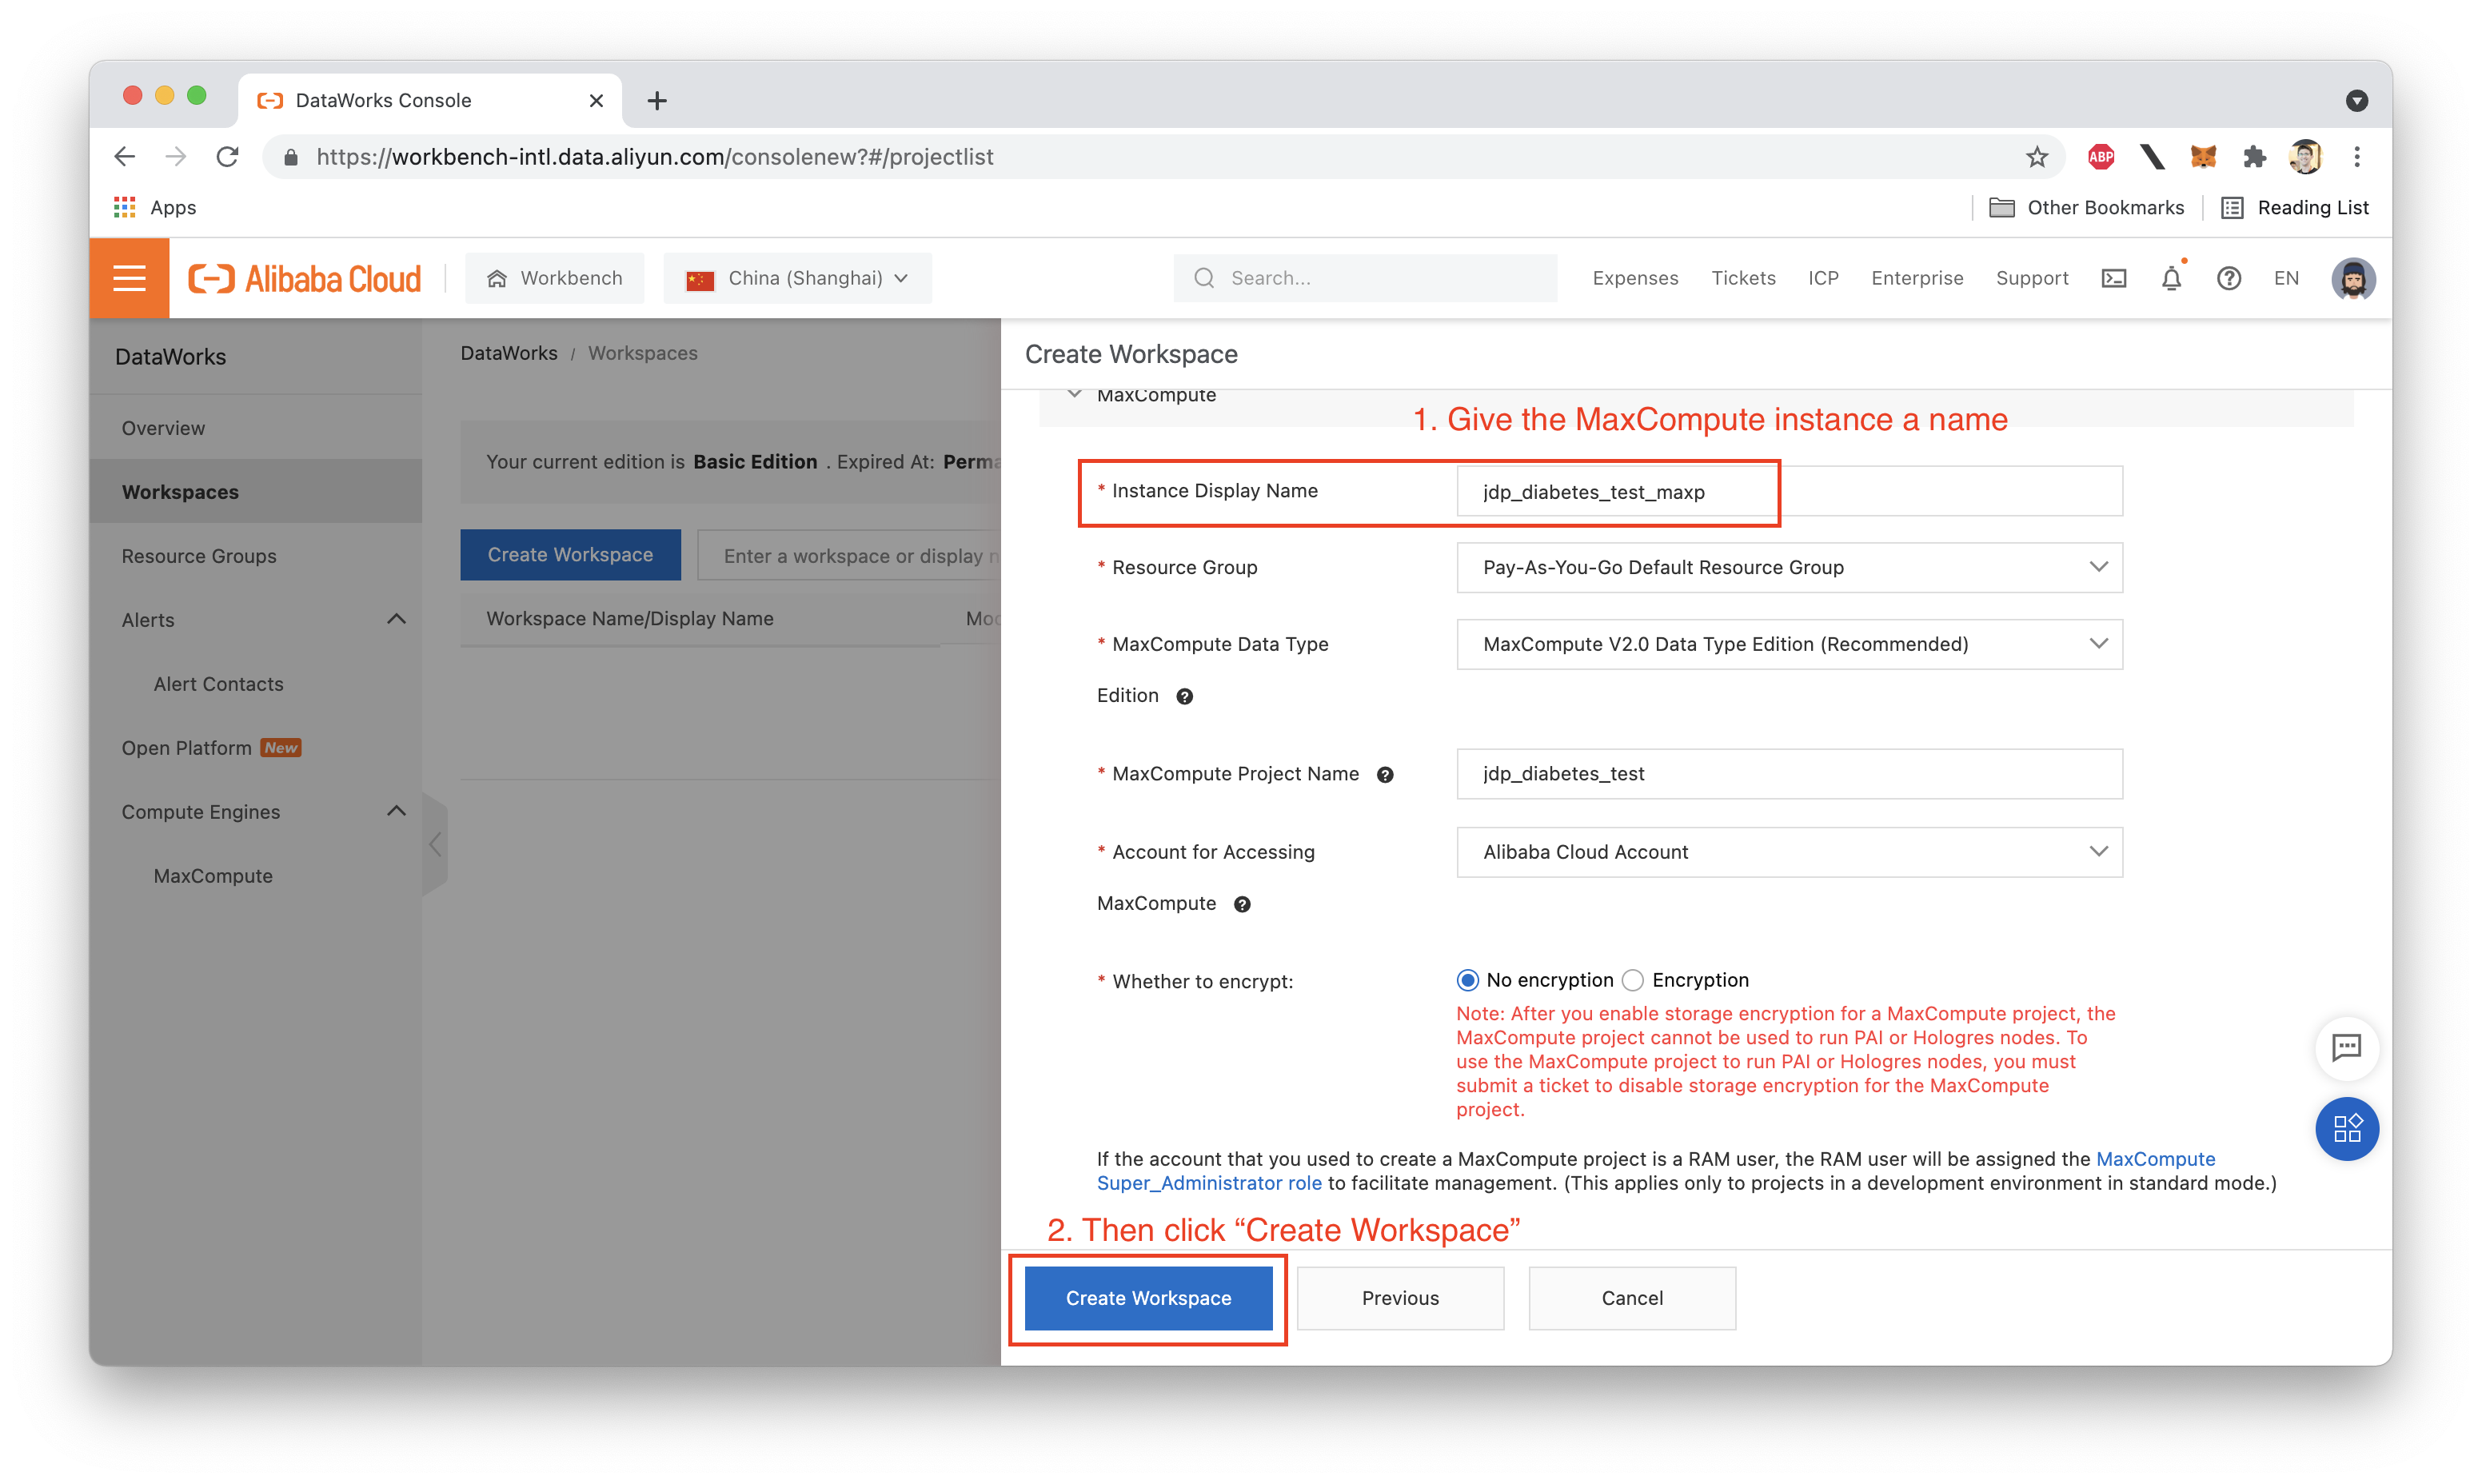
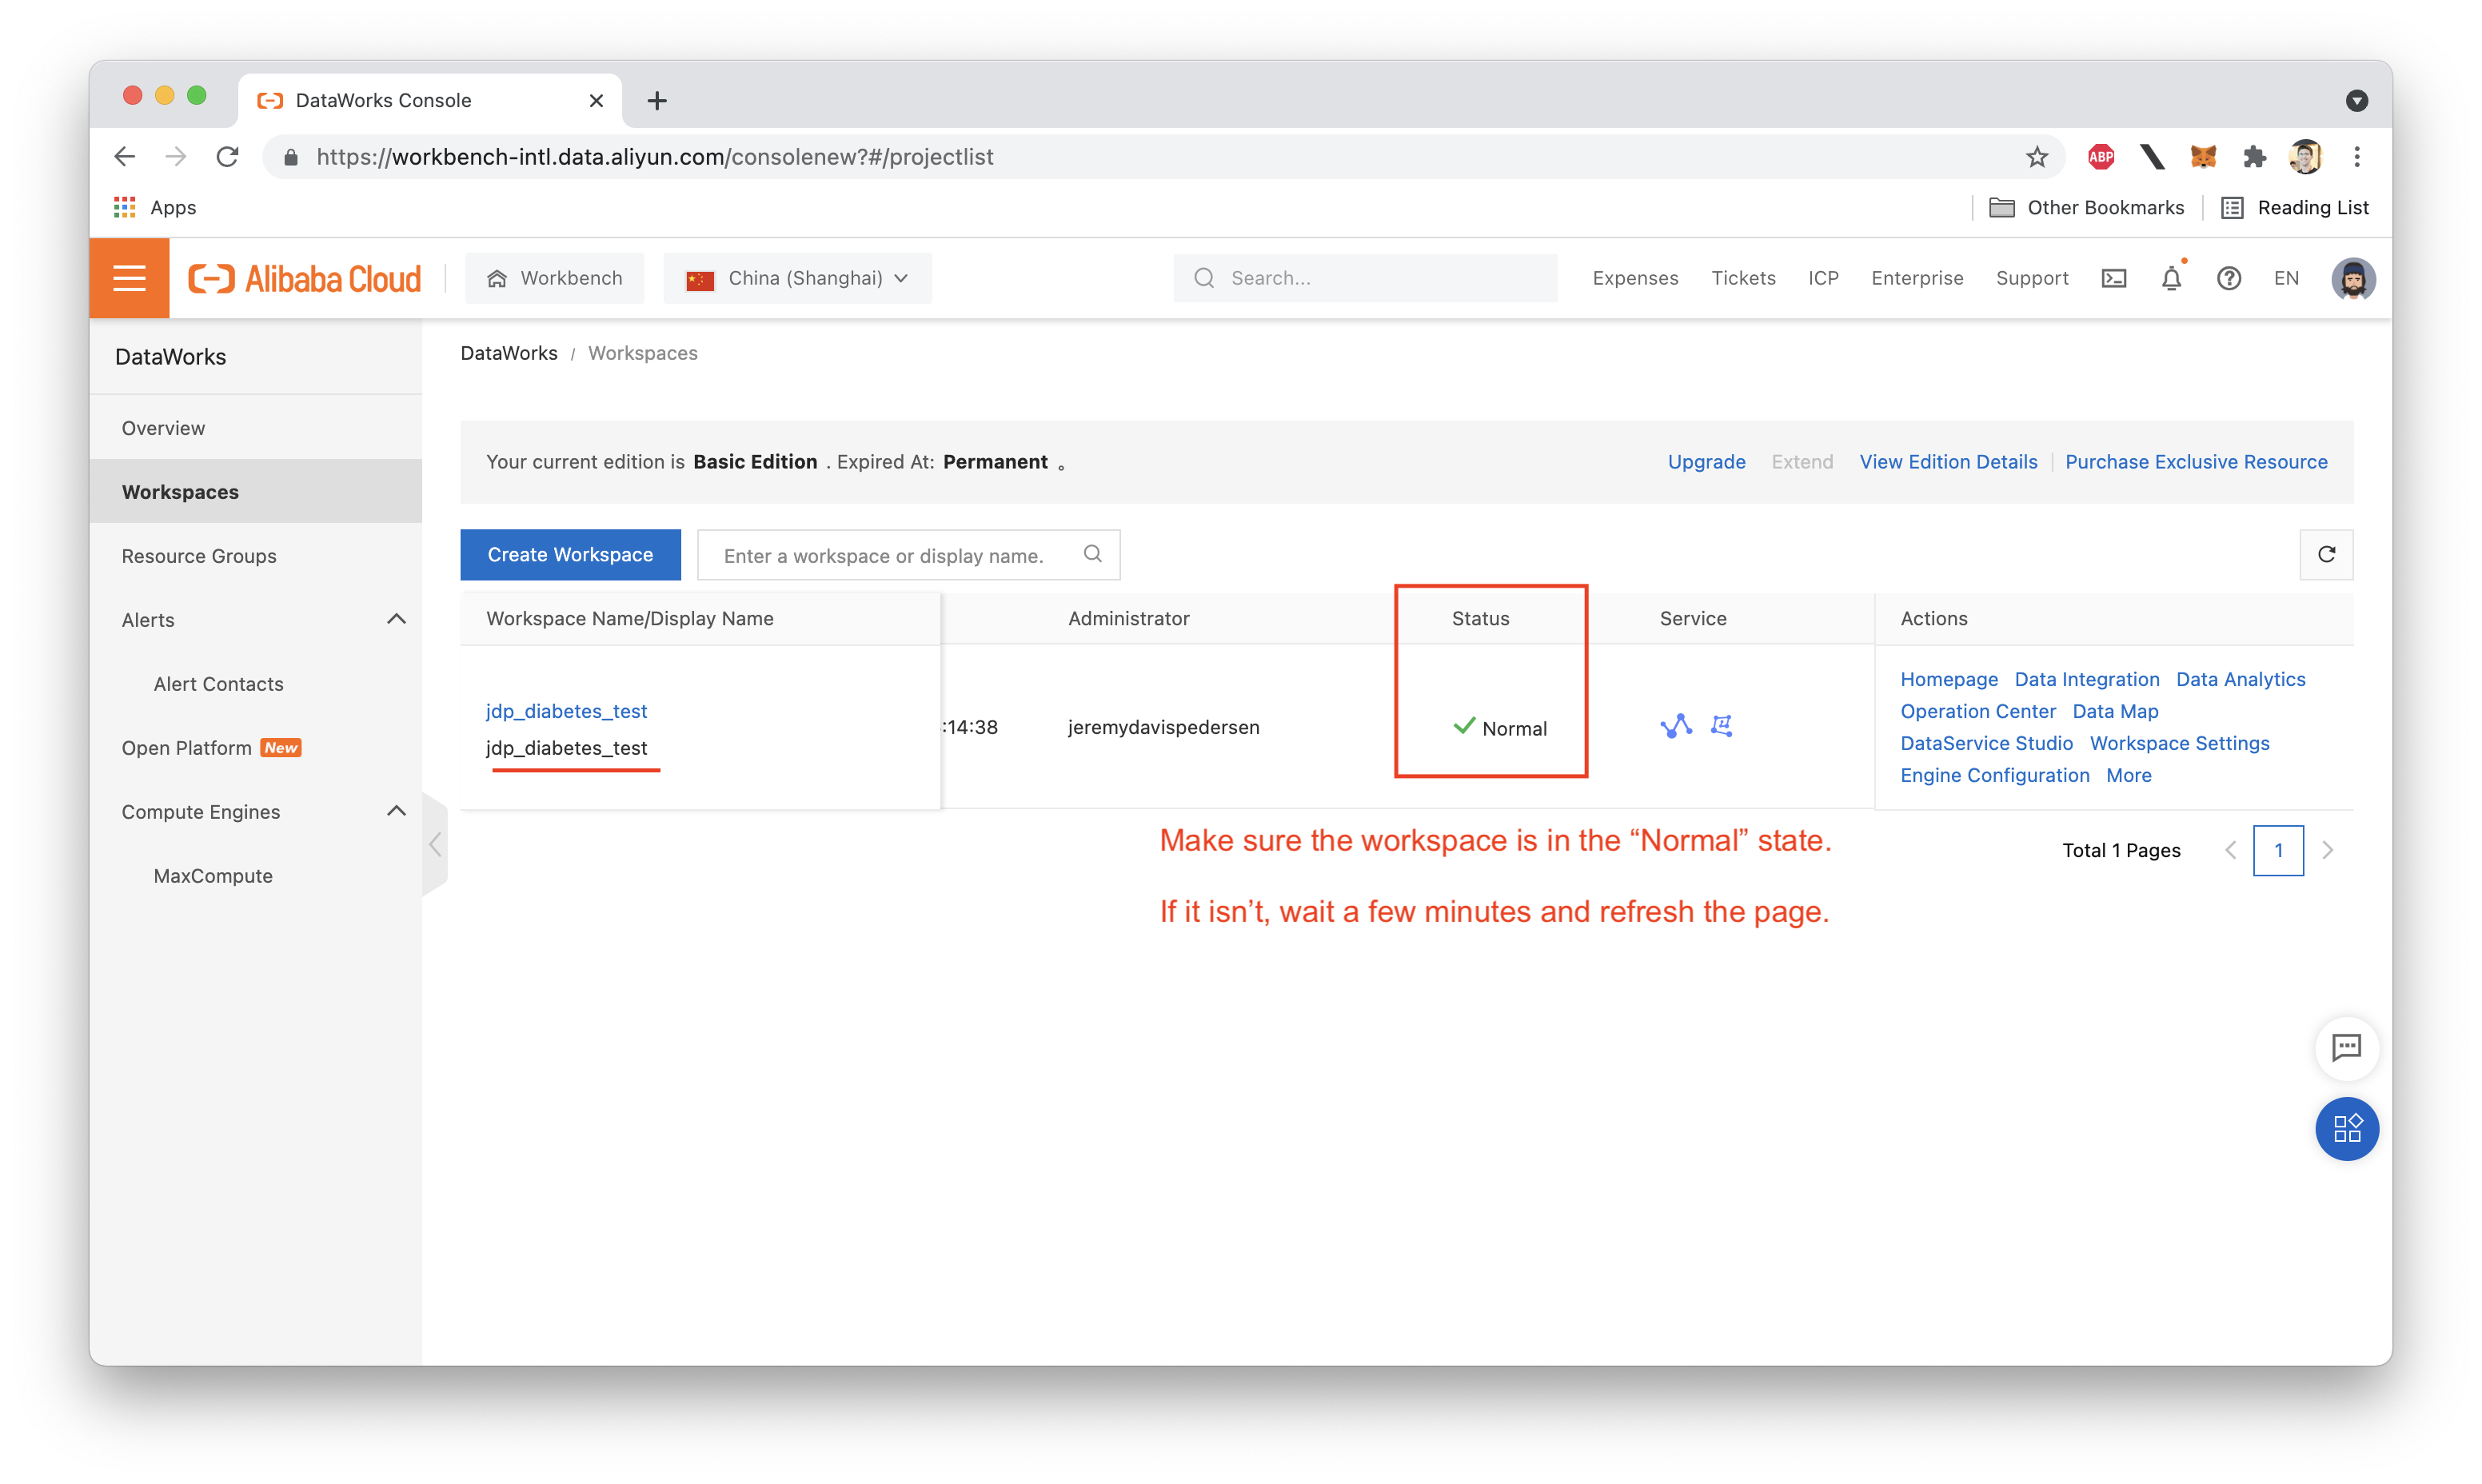
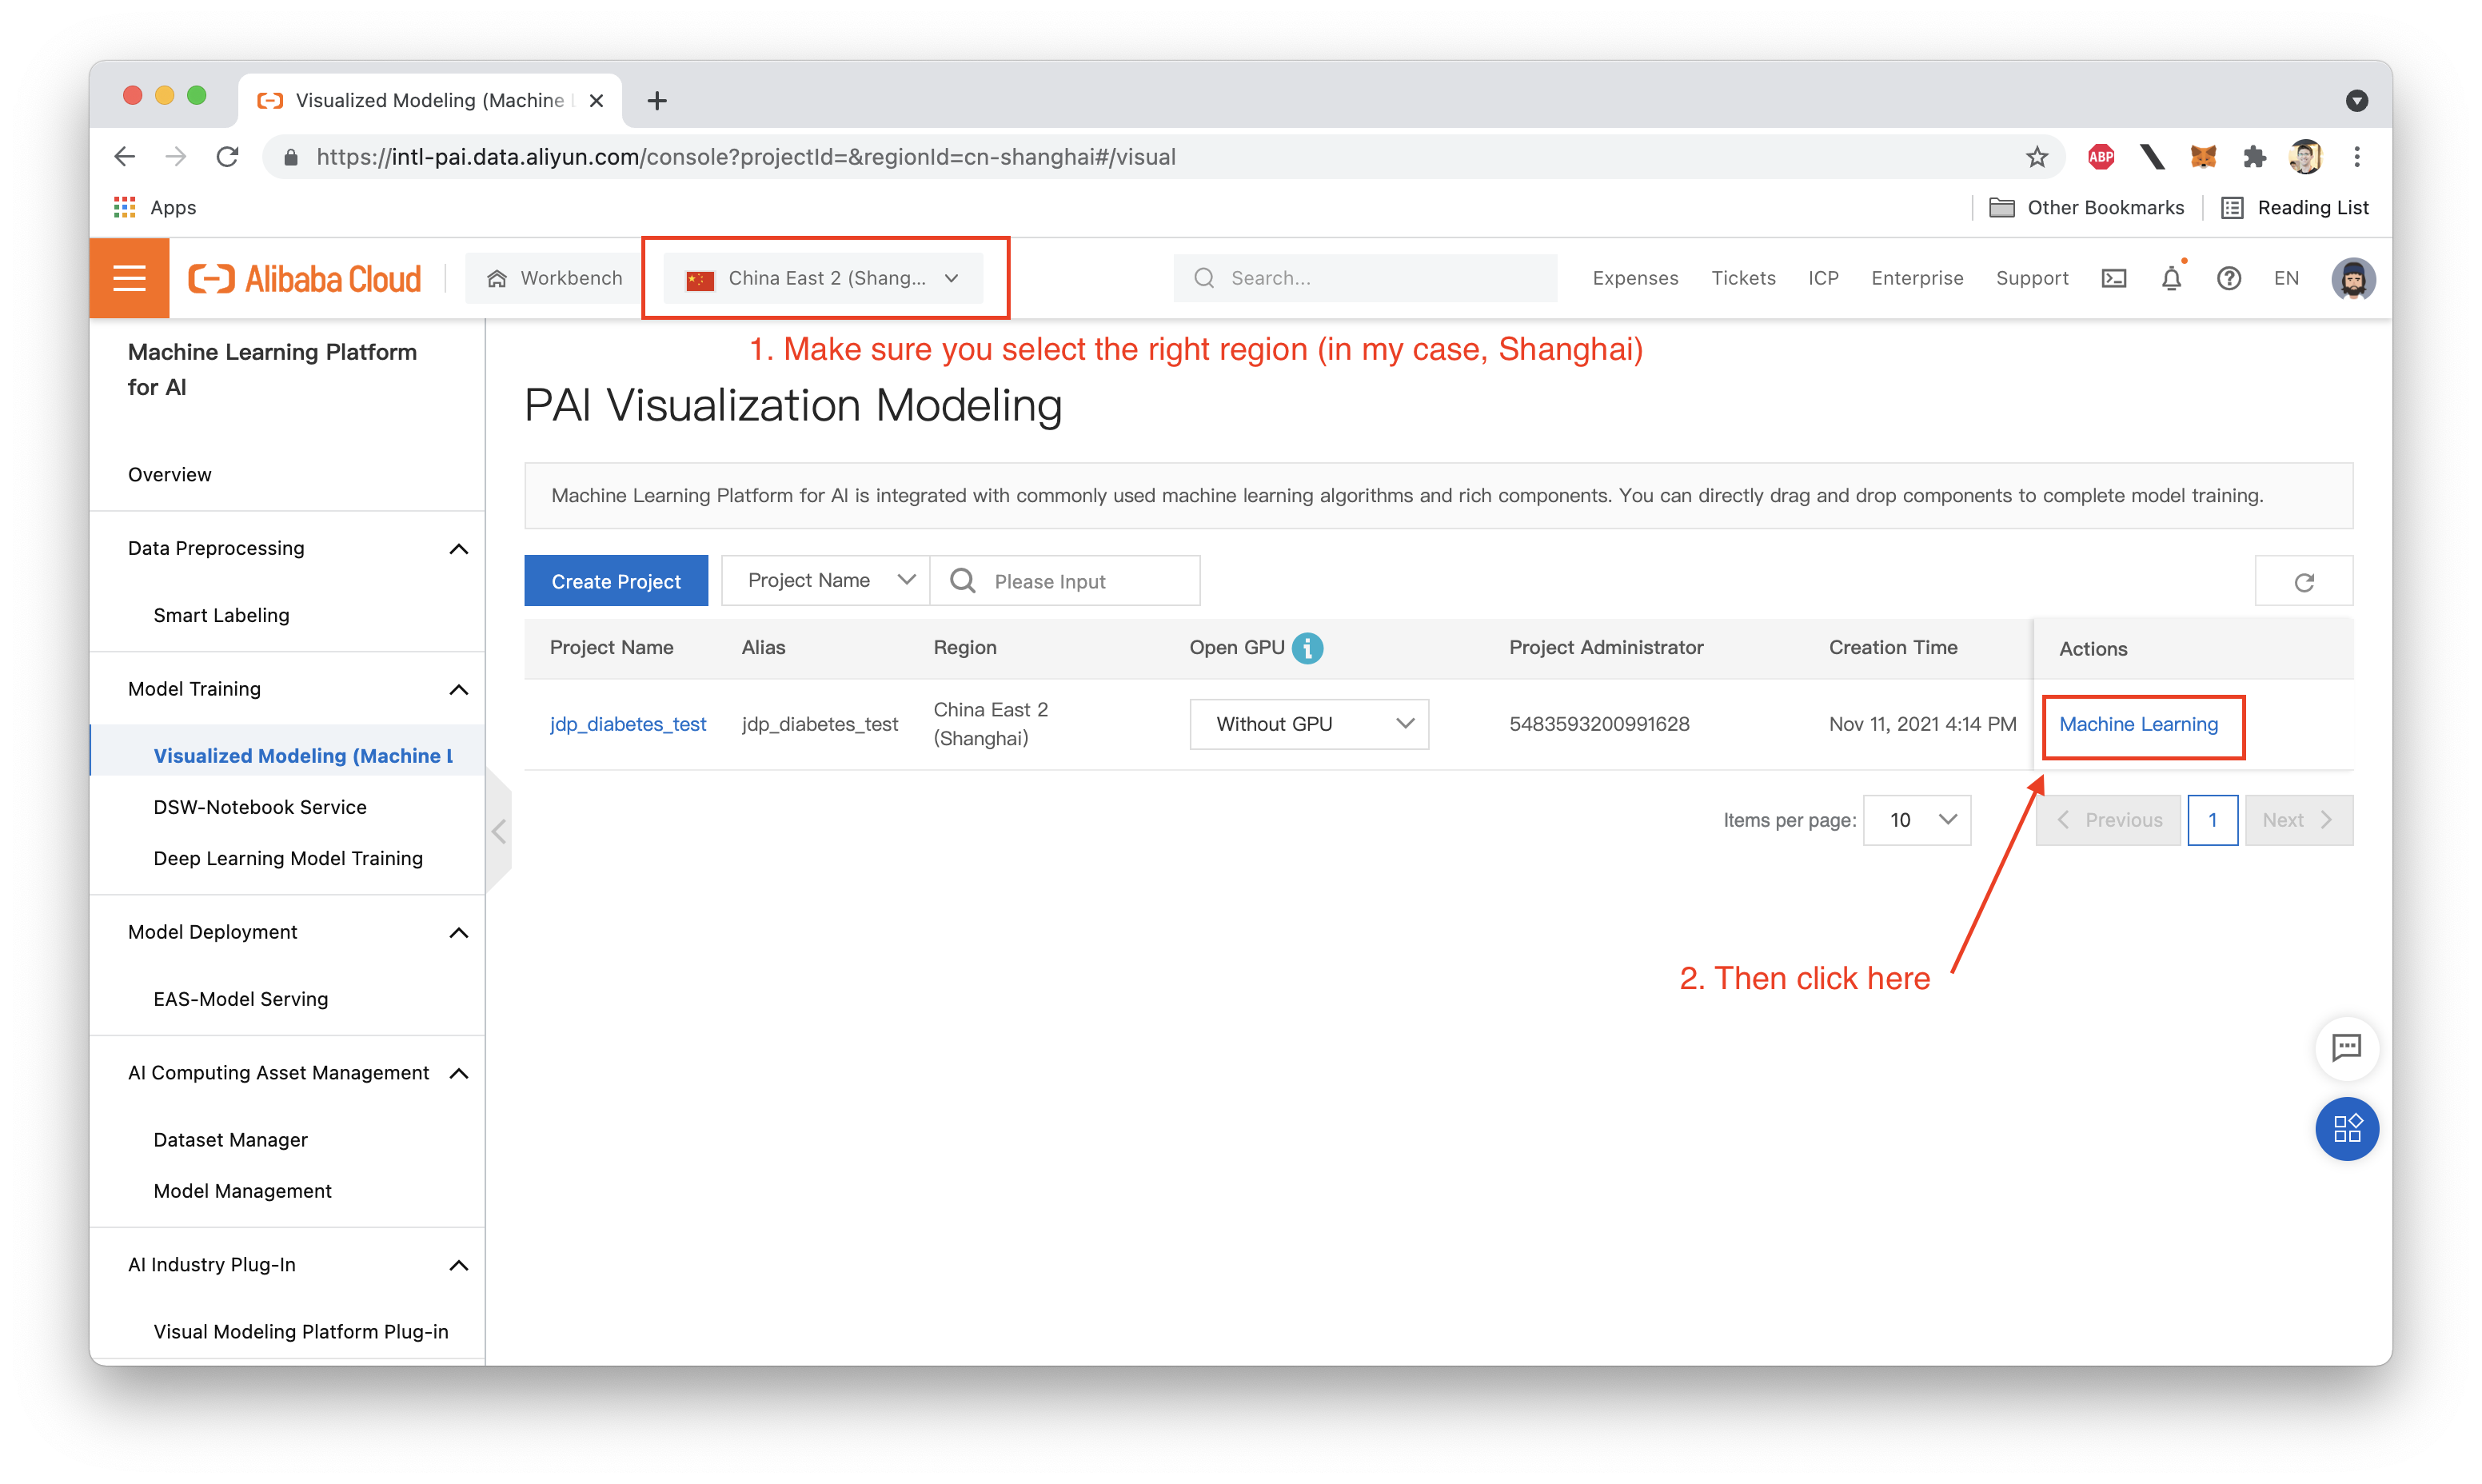
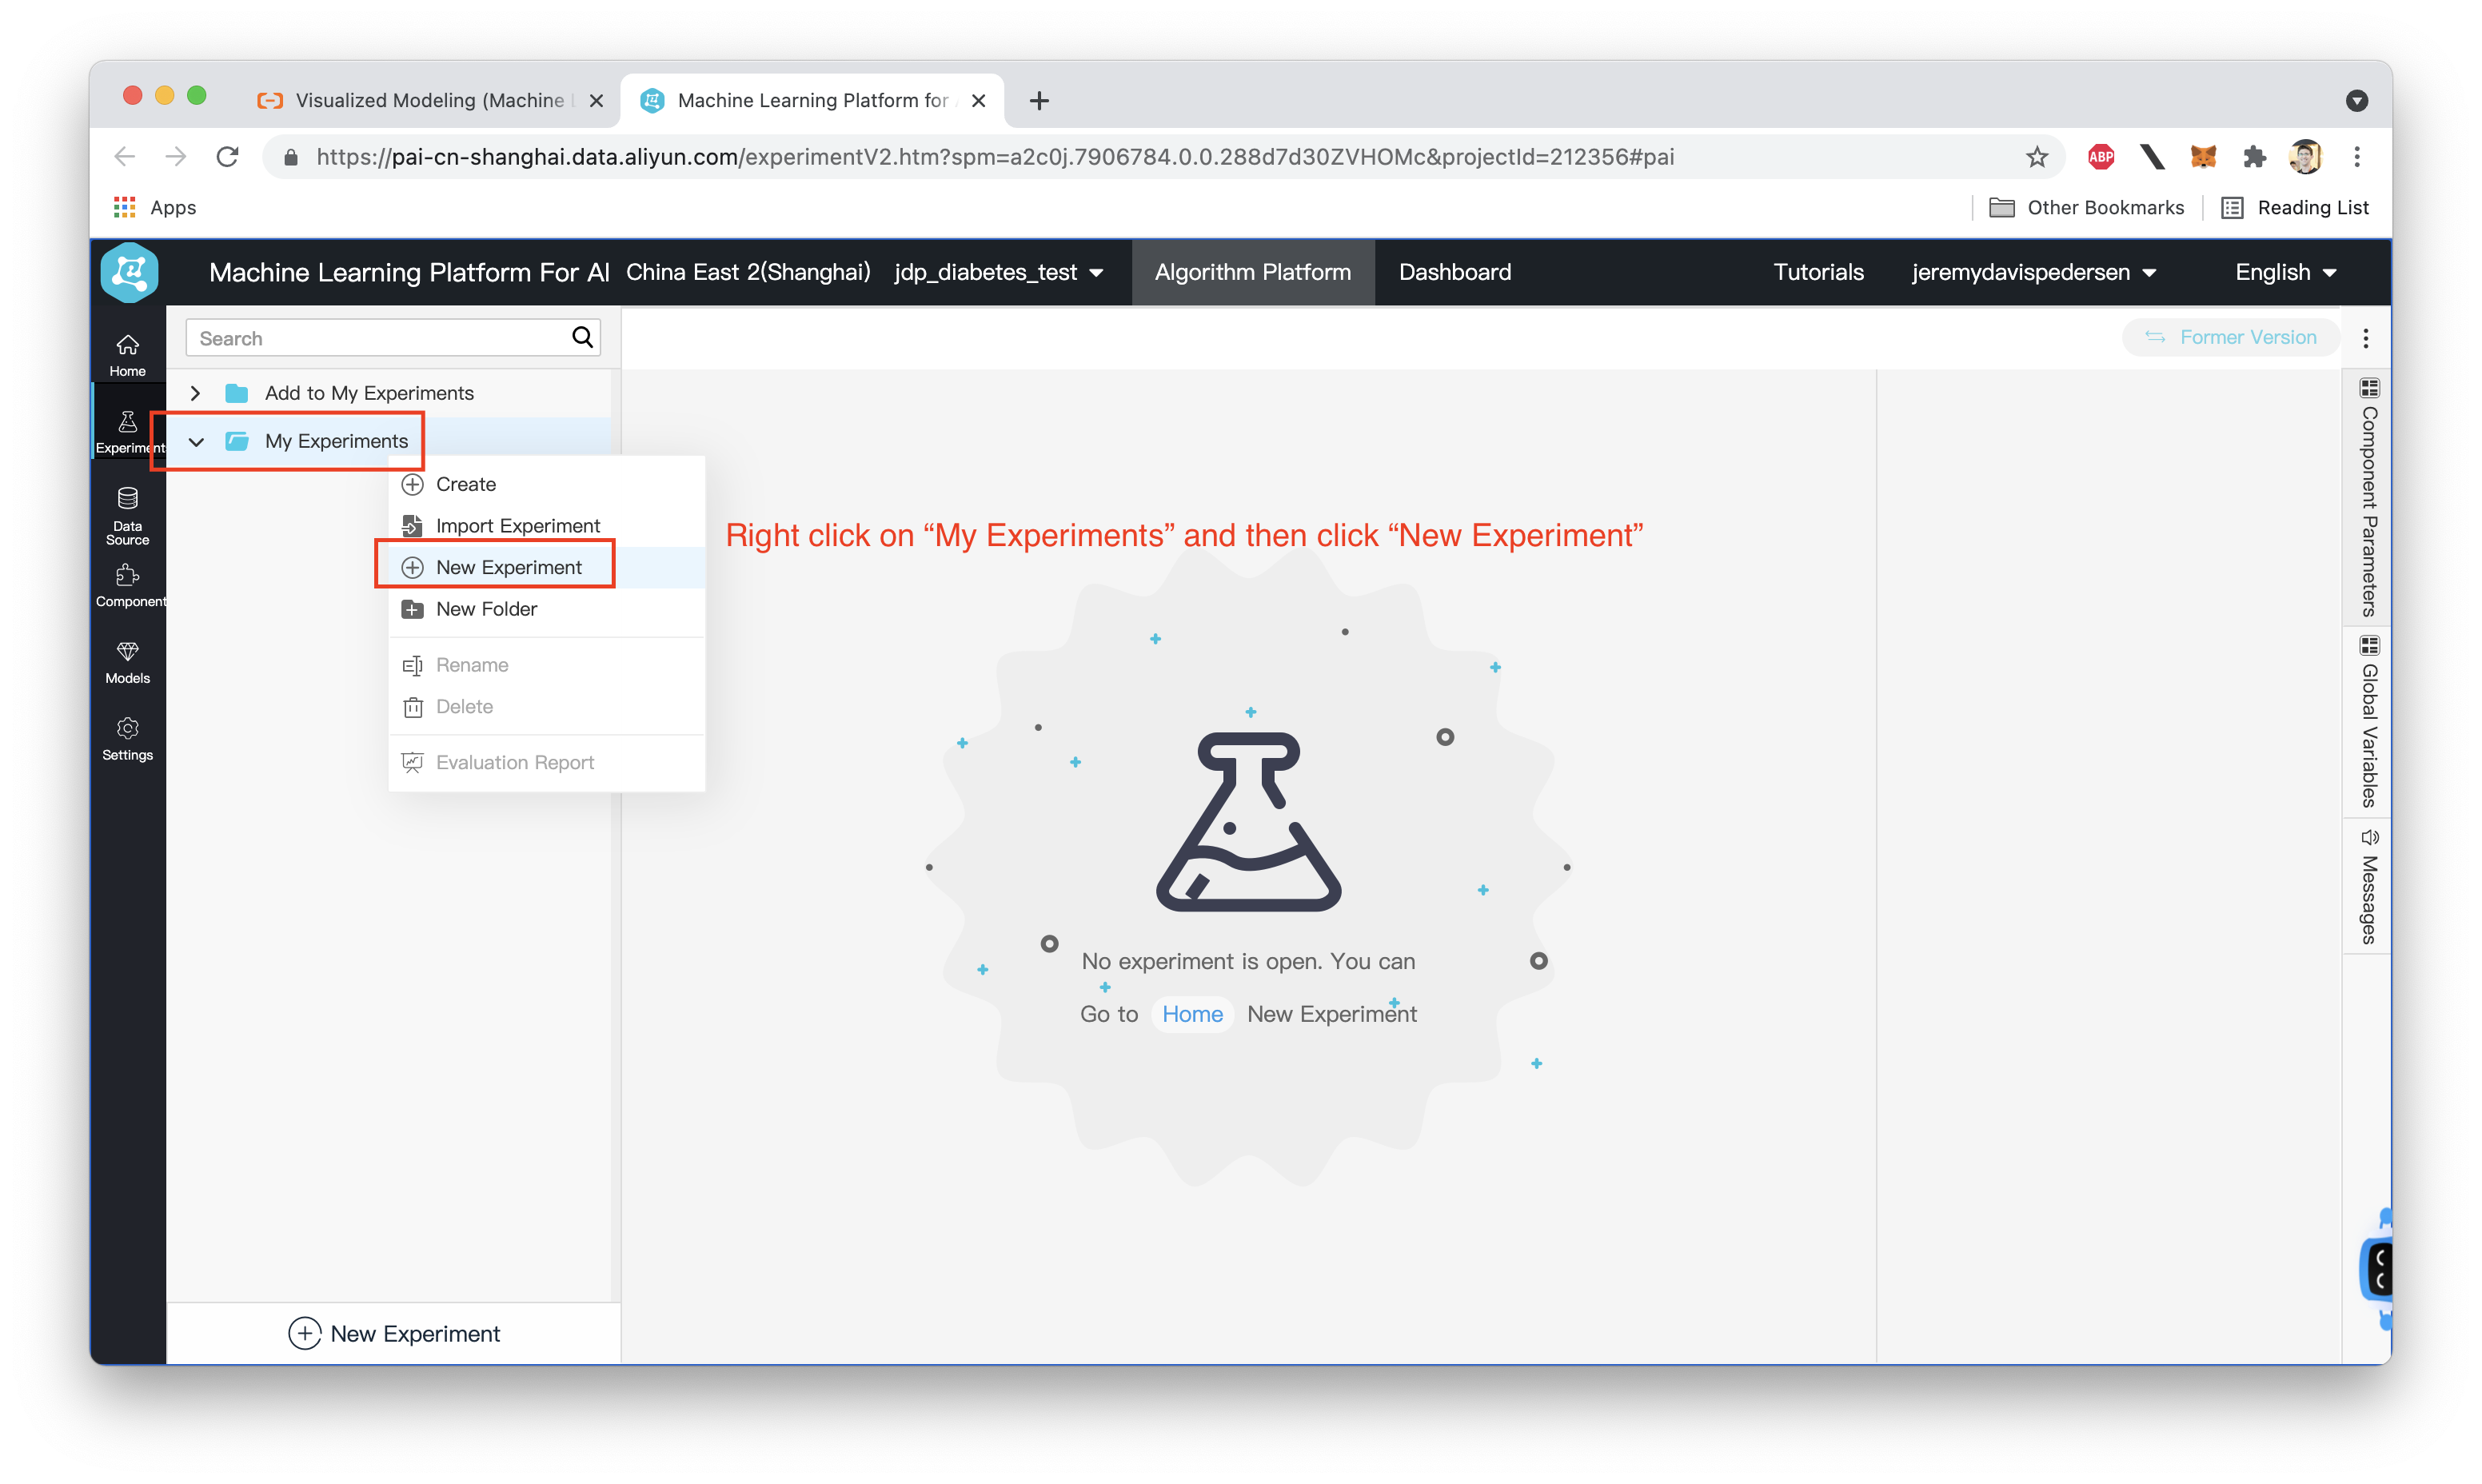
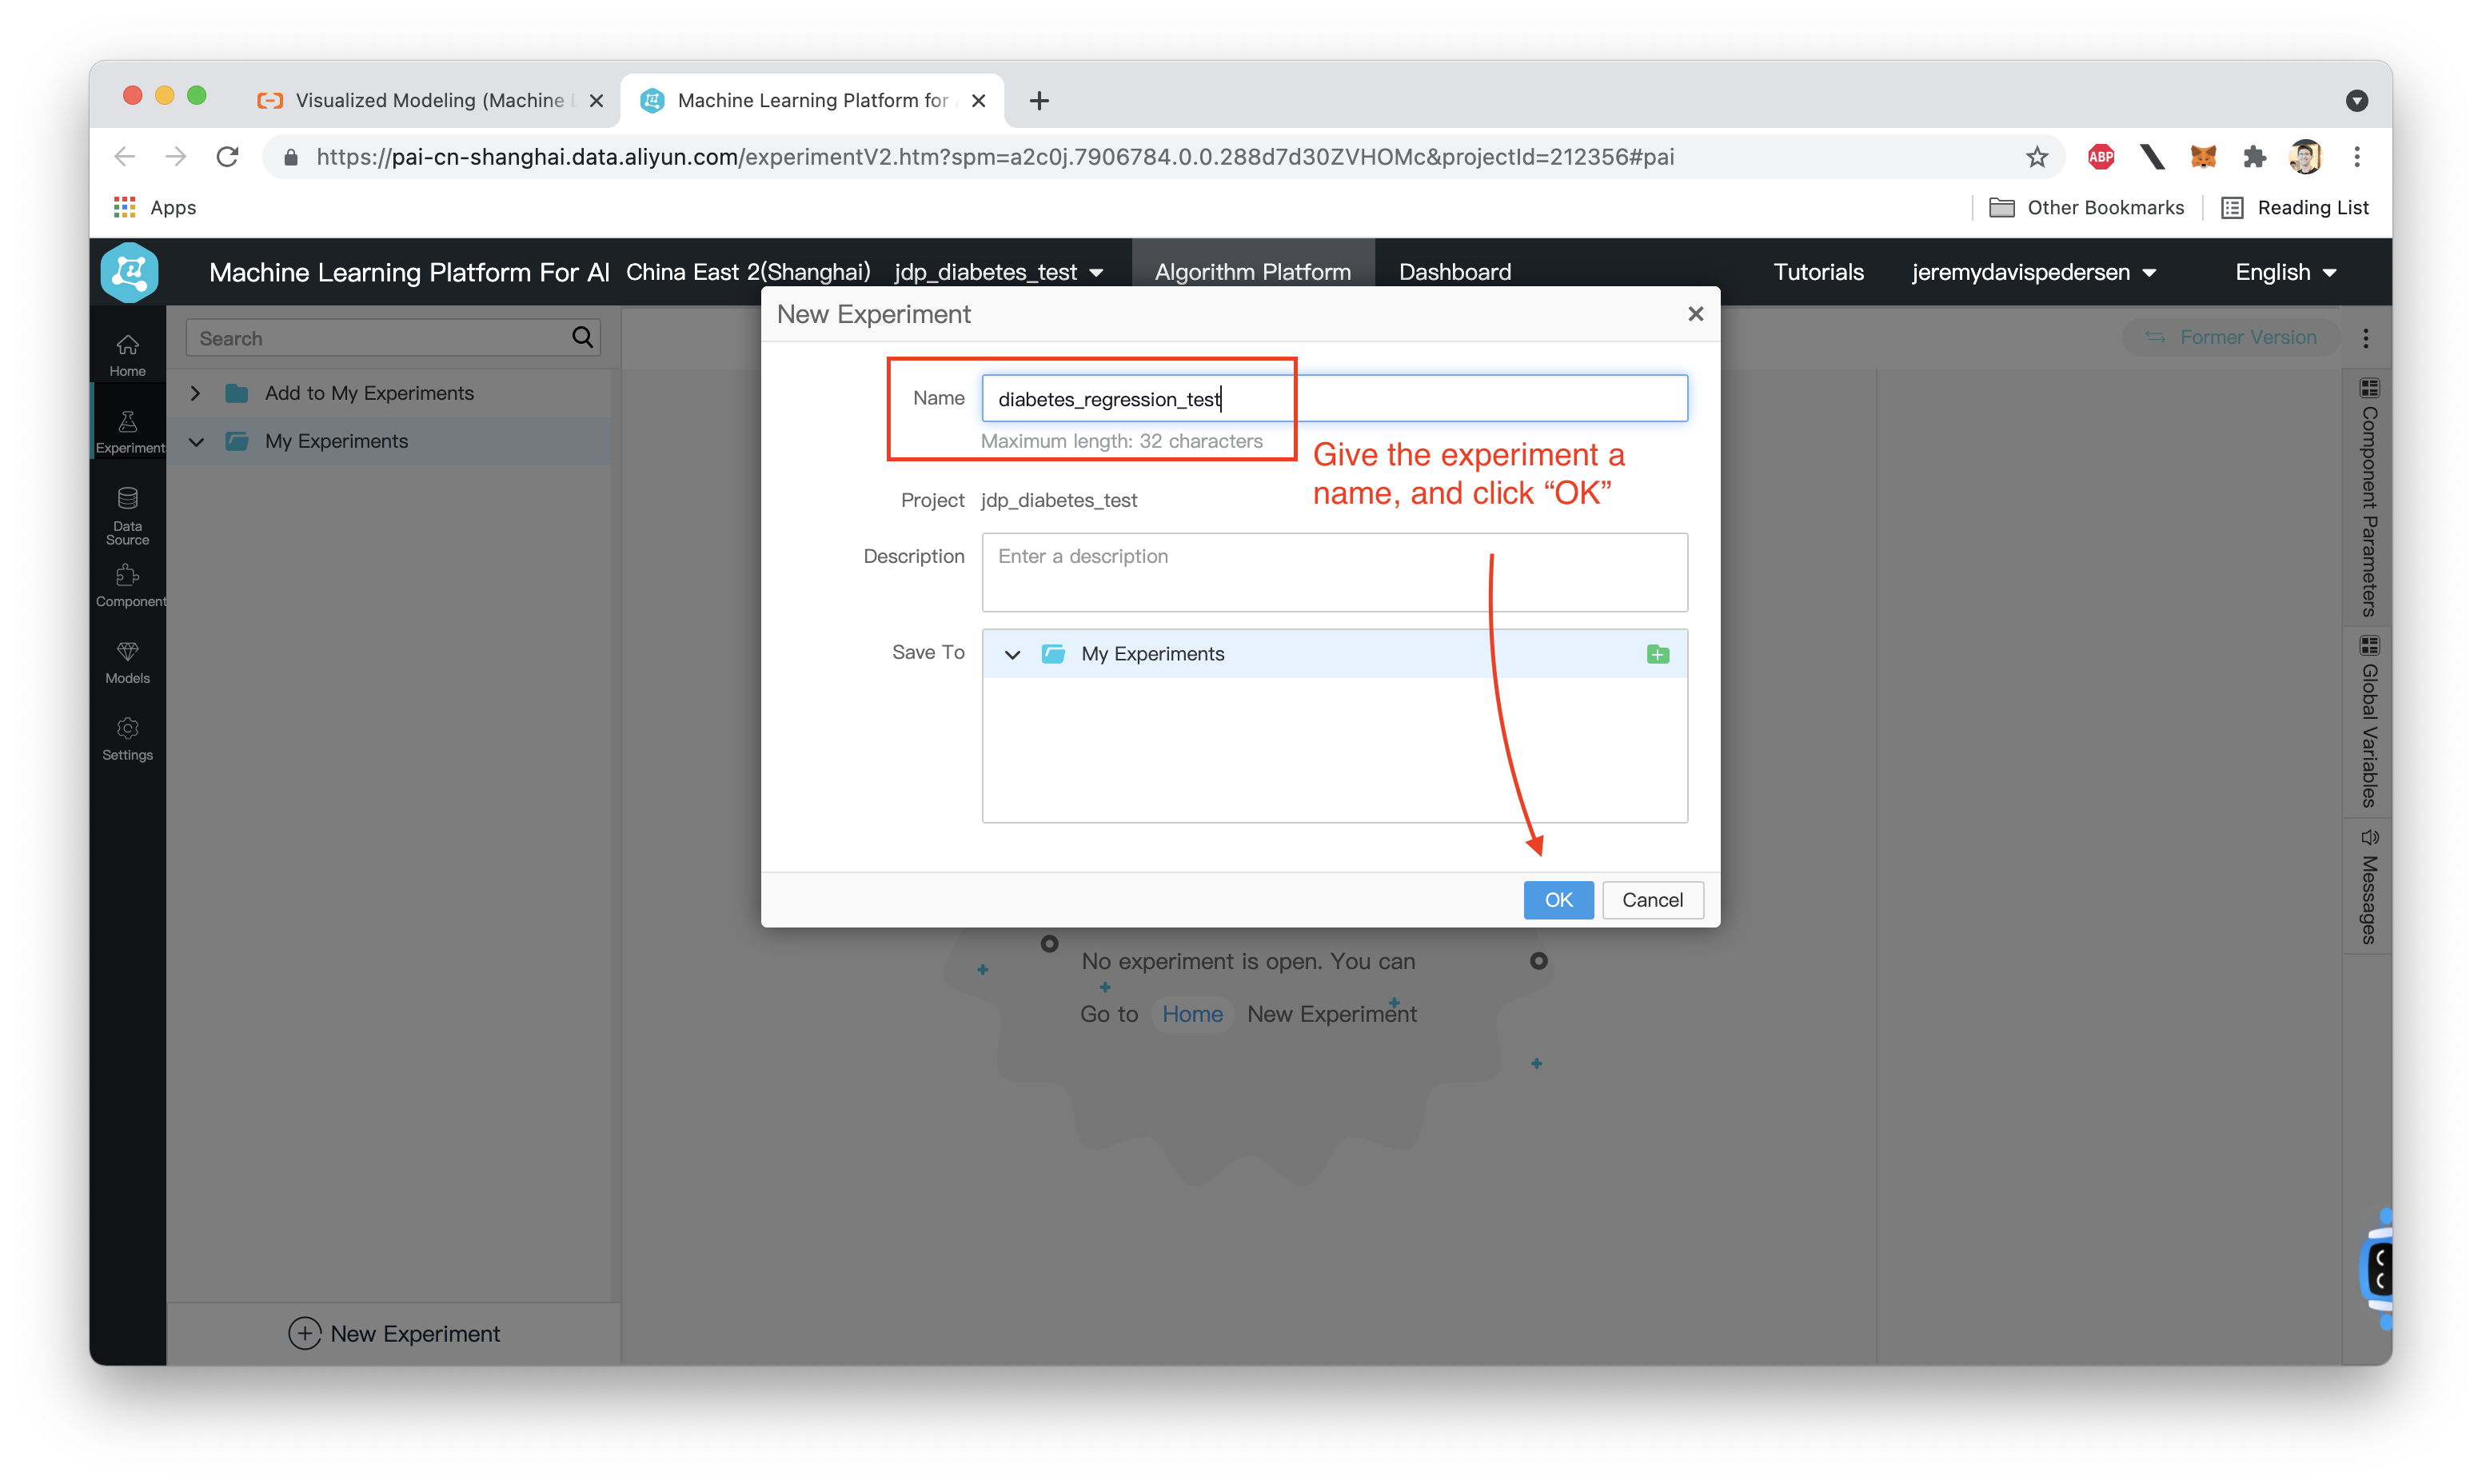
That's it! We have now created our DataWorks Workspace and MaxCompute project. The next step is to switch over to the PAI Studio console and create a new Experiment:
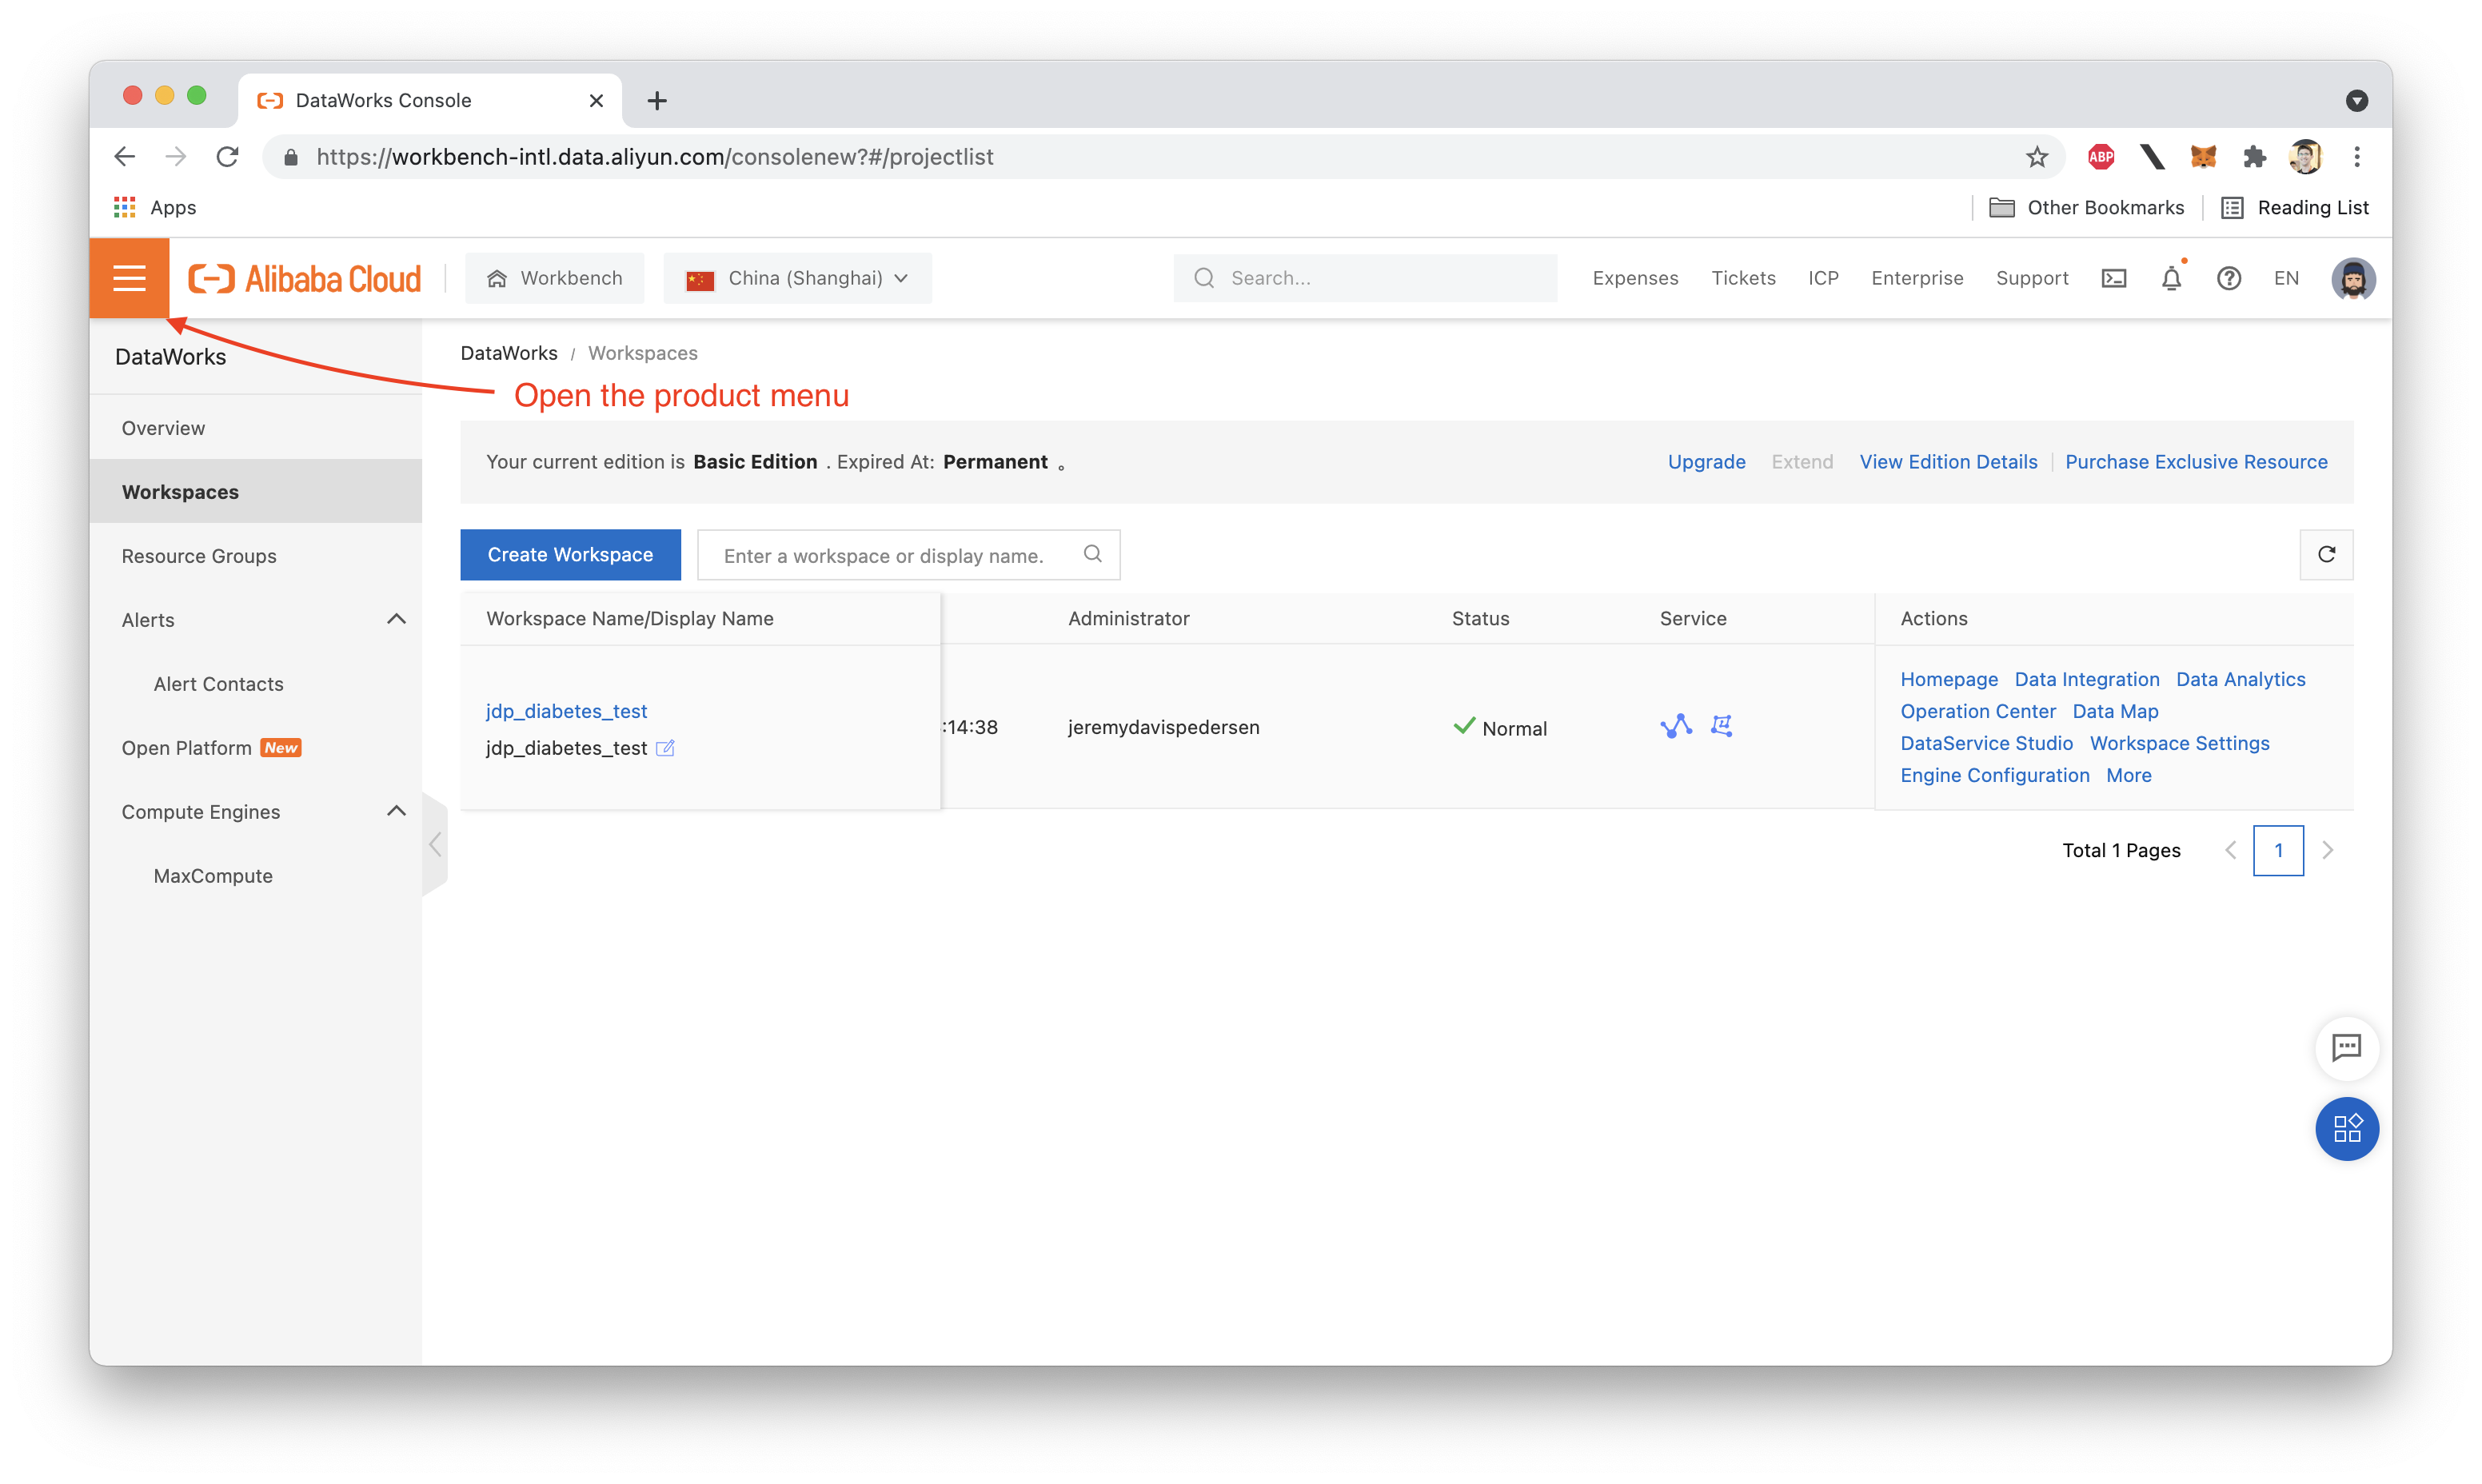
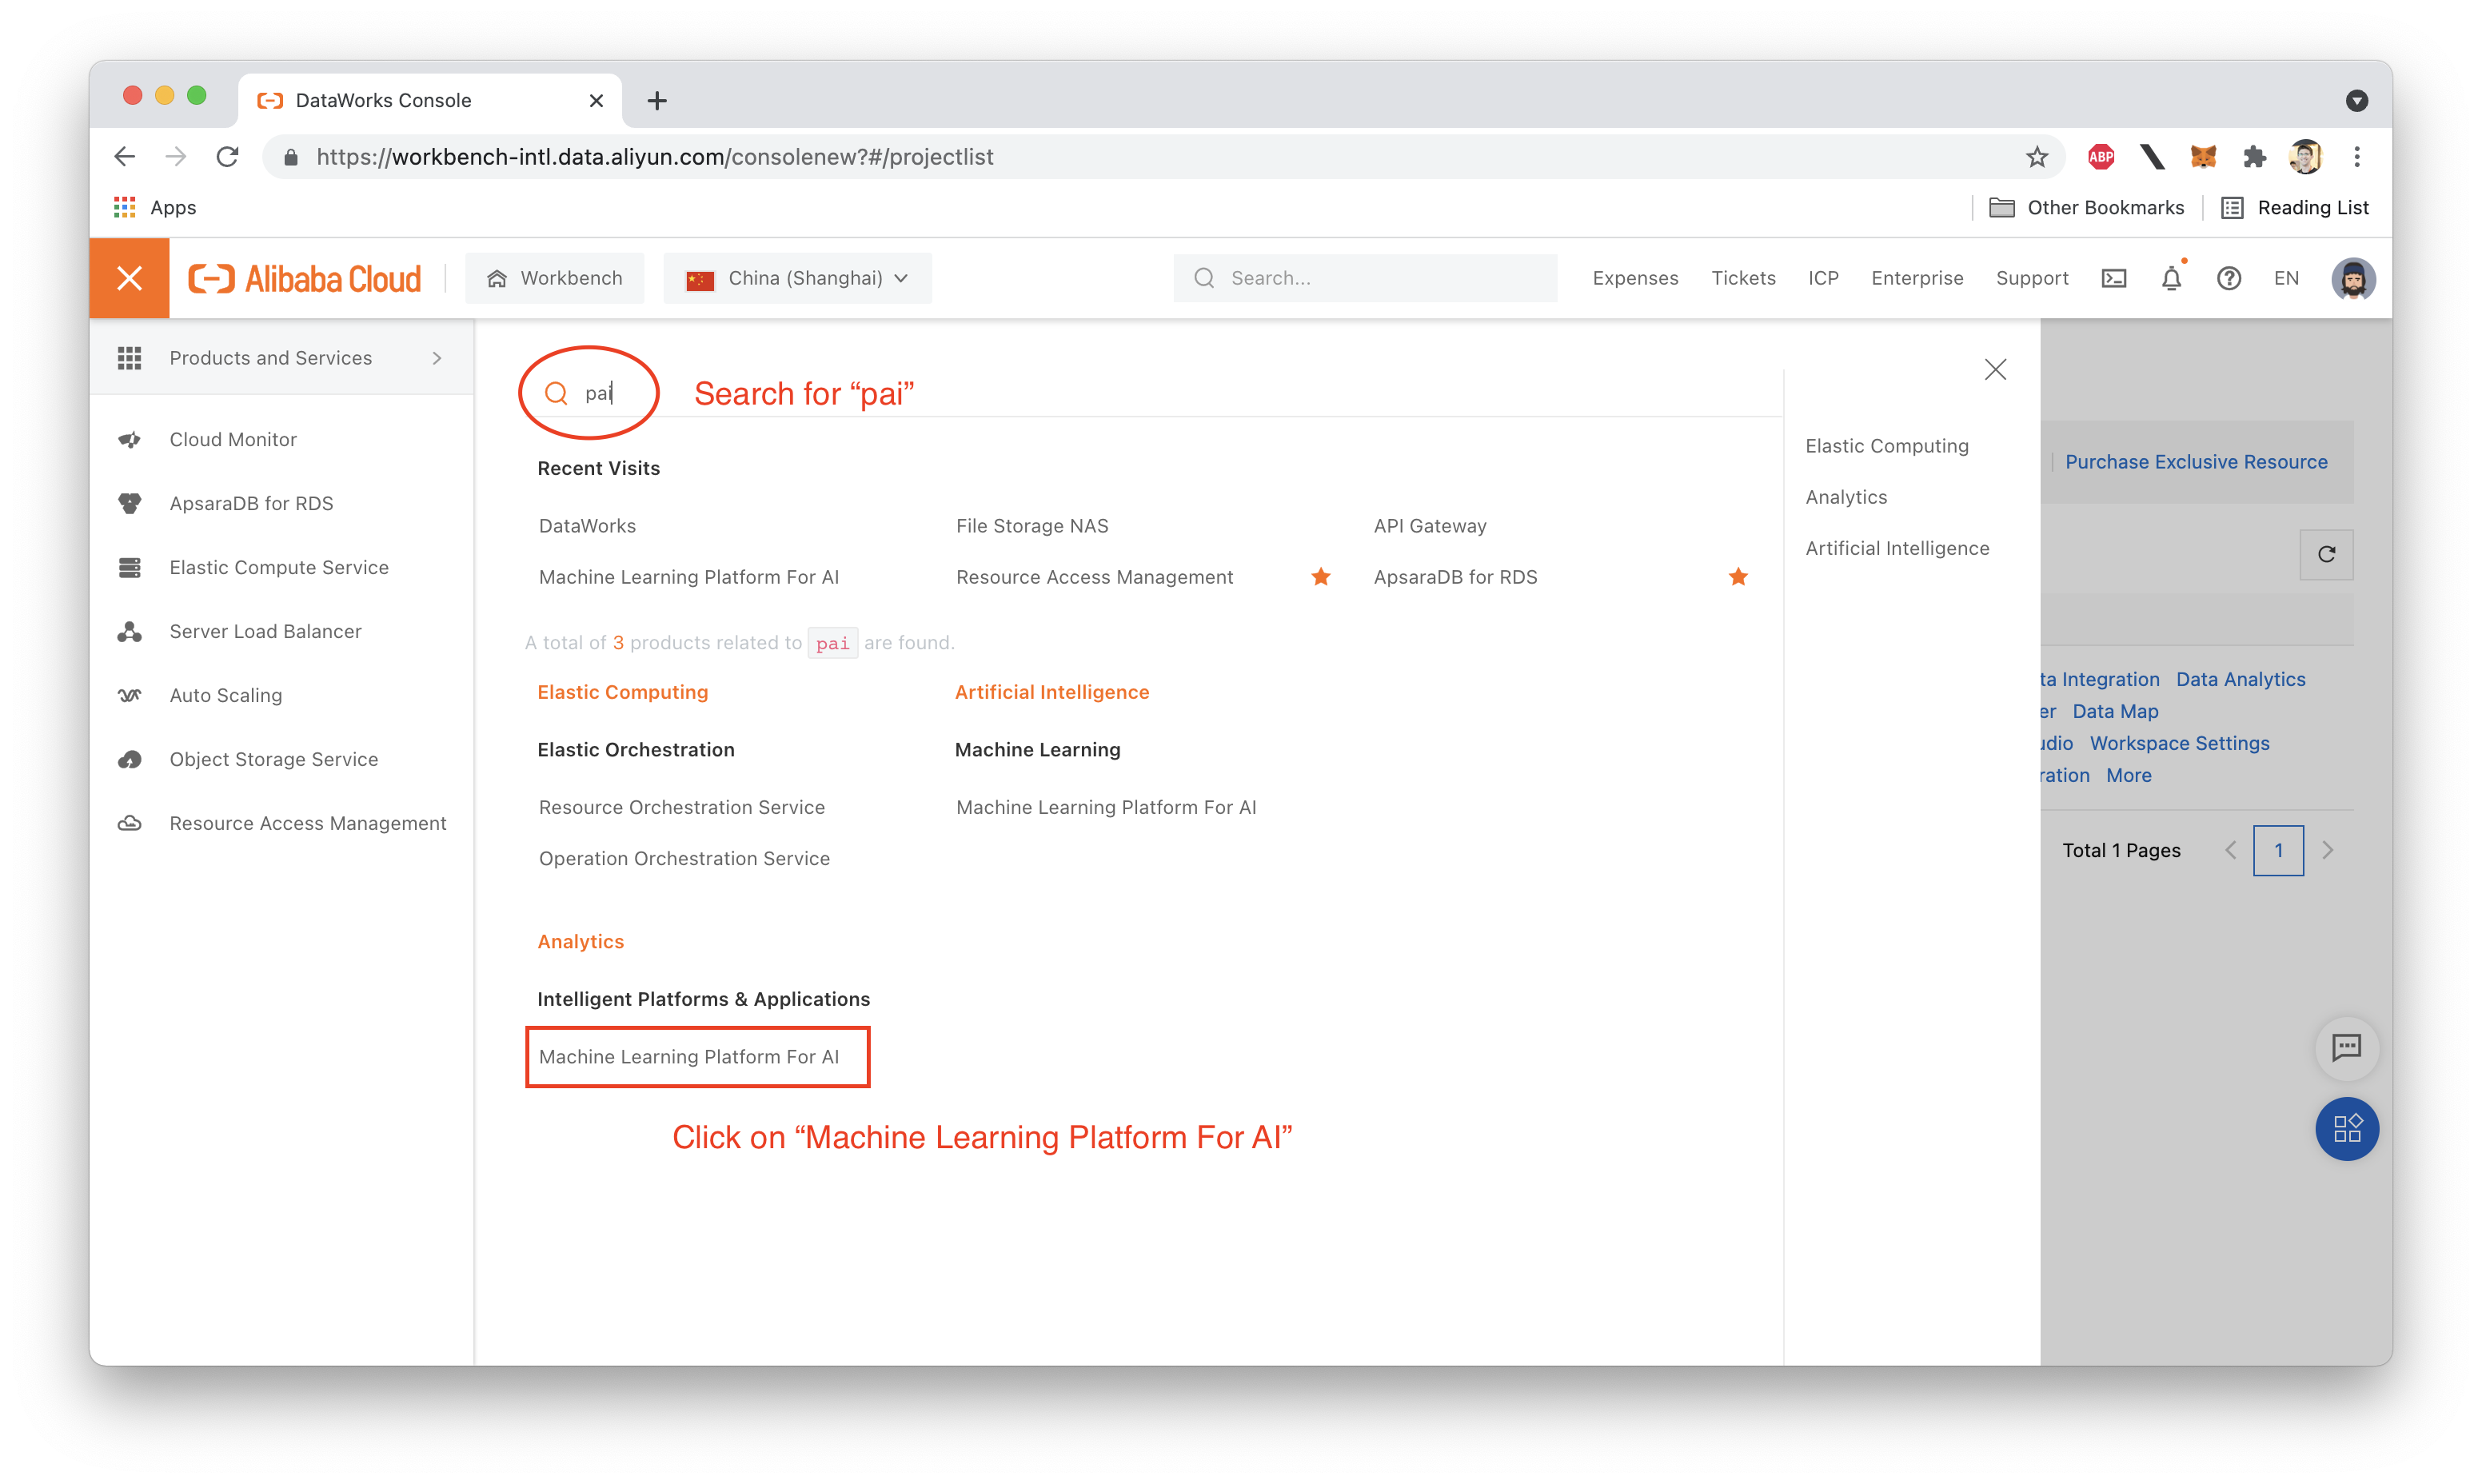
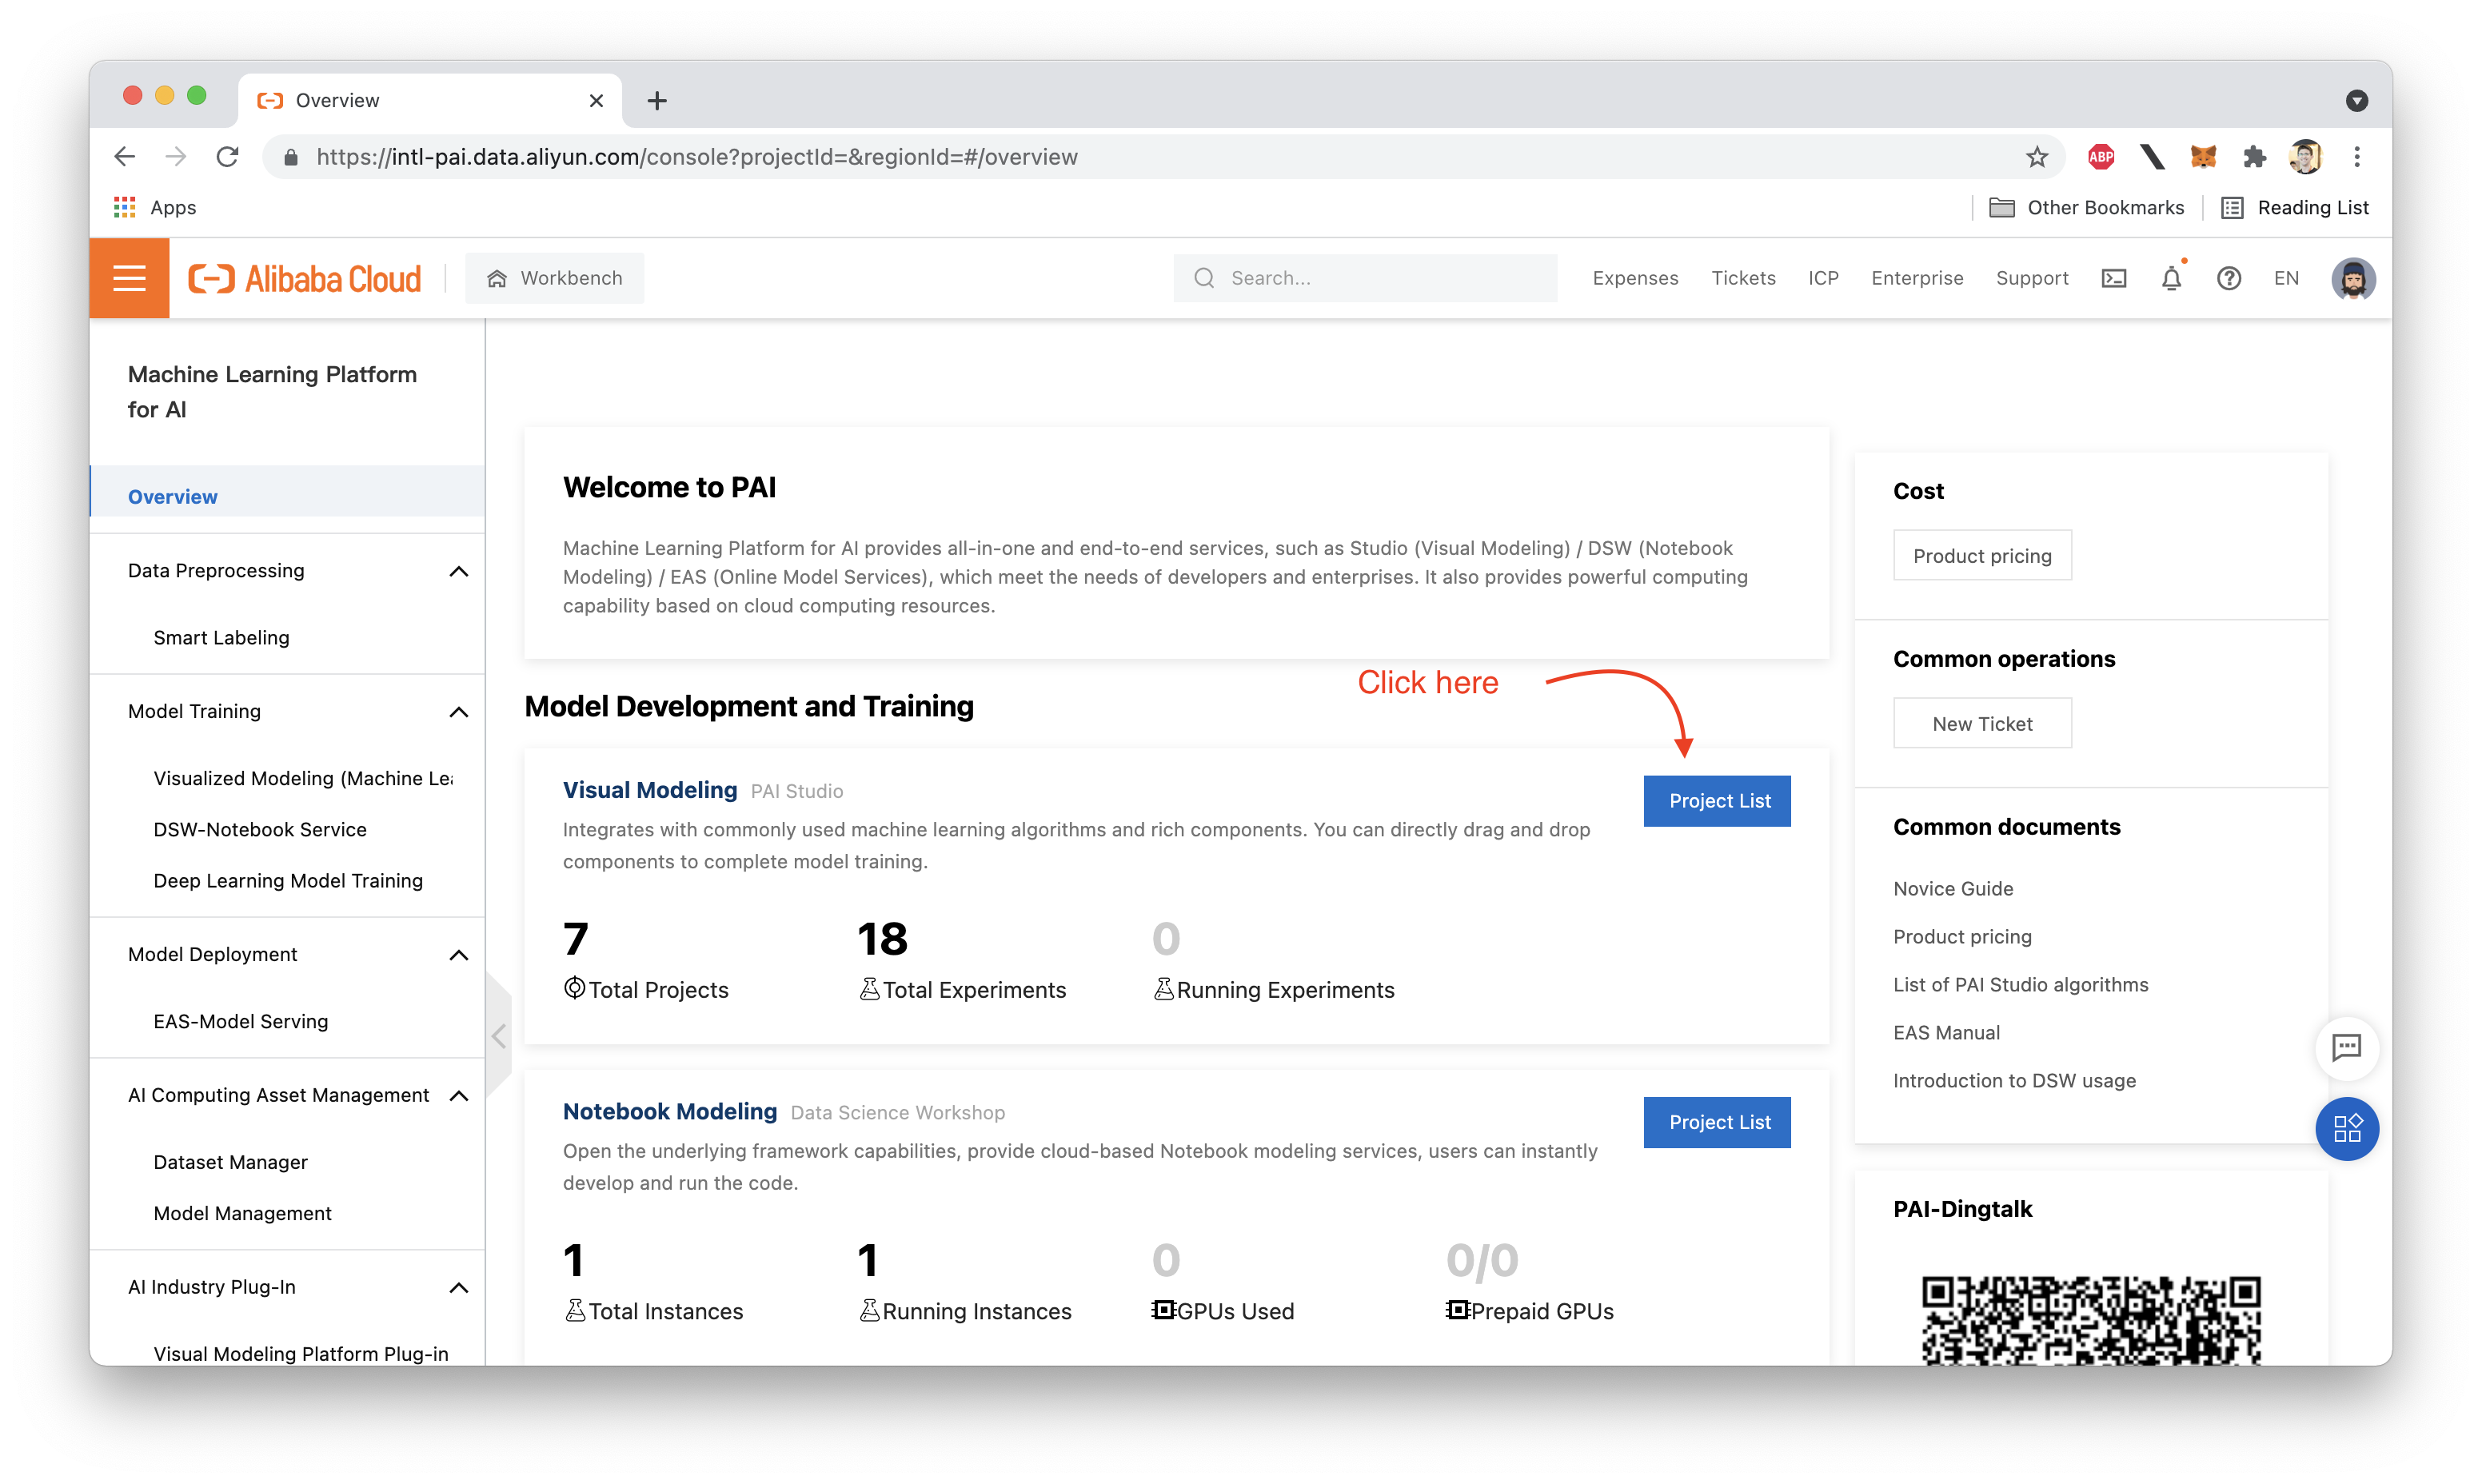
We need some data on which to train our model. One great source of openly available Machine Learning data is Kaggle.
Just in case you aren't familiar with Kaggle: it's a machine learning community site where people post open datasets and take part in competitions to see who can train the most accurate machine learning models.
What we will be doing in this walkthrough is training a logistic regression model. Logistic Regression models are a kind of binary classifier, meaning they divide a dataset into two classes.
This makes them great for scenarios where we want to use input data to answer a yes or no question like "should we give this person a loan?" or "does this person have cancer?"
In our case, we'll be trying to predict whether or not a given patient has diabetes, using this diabetes dataset from Kaggle.
You may need to create a Kaggle account to download the dataset: don't worry, it's free.
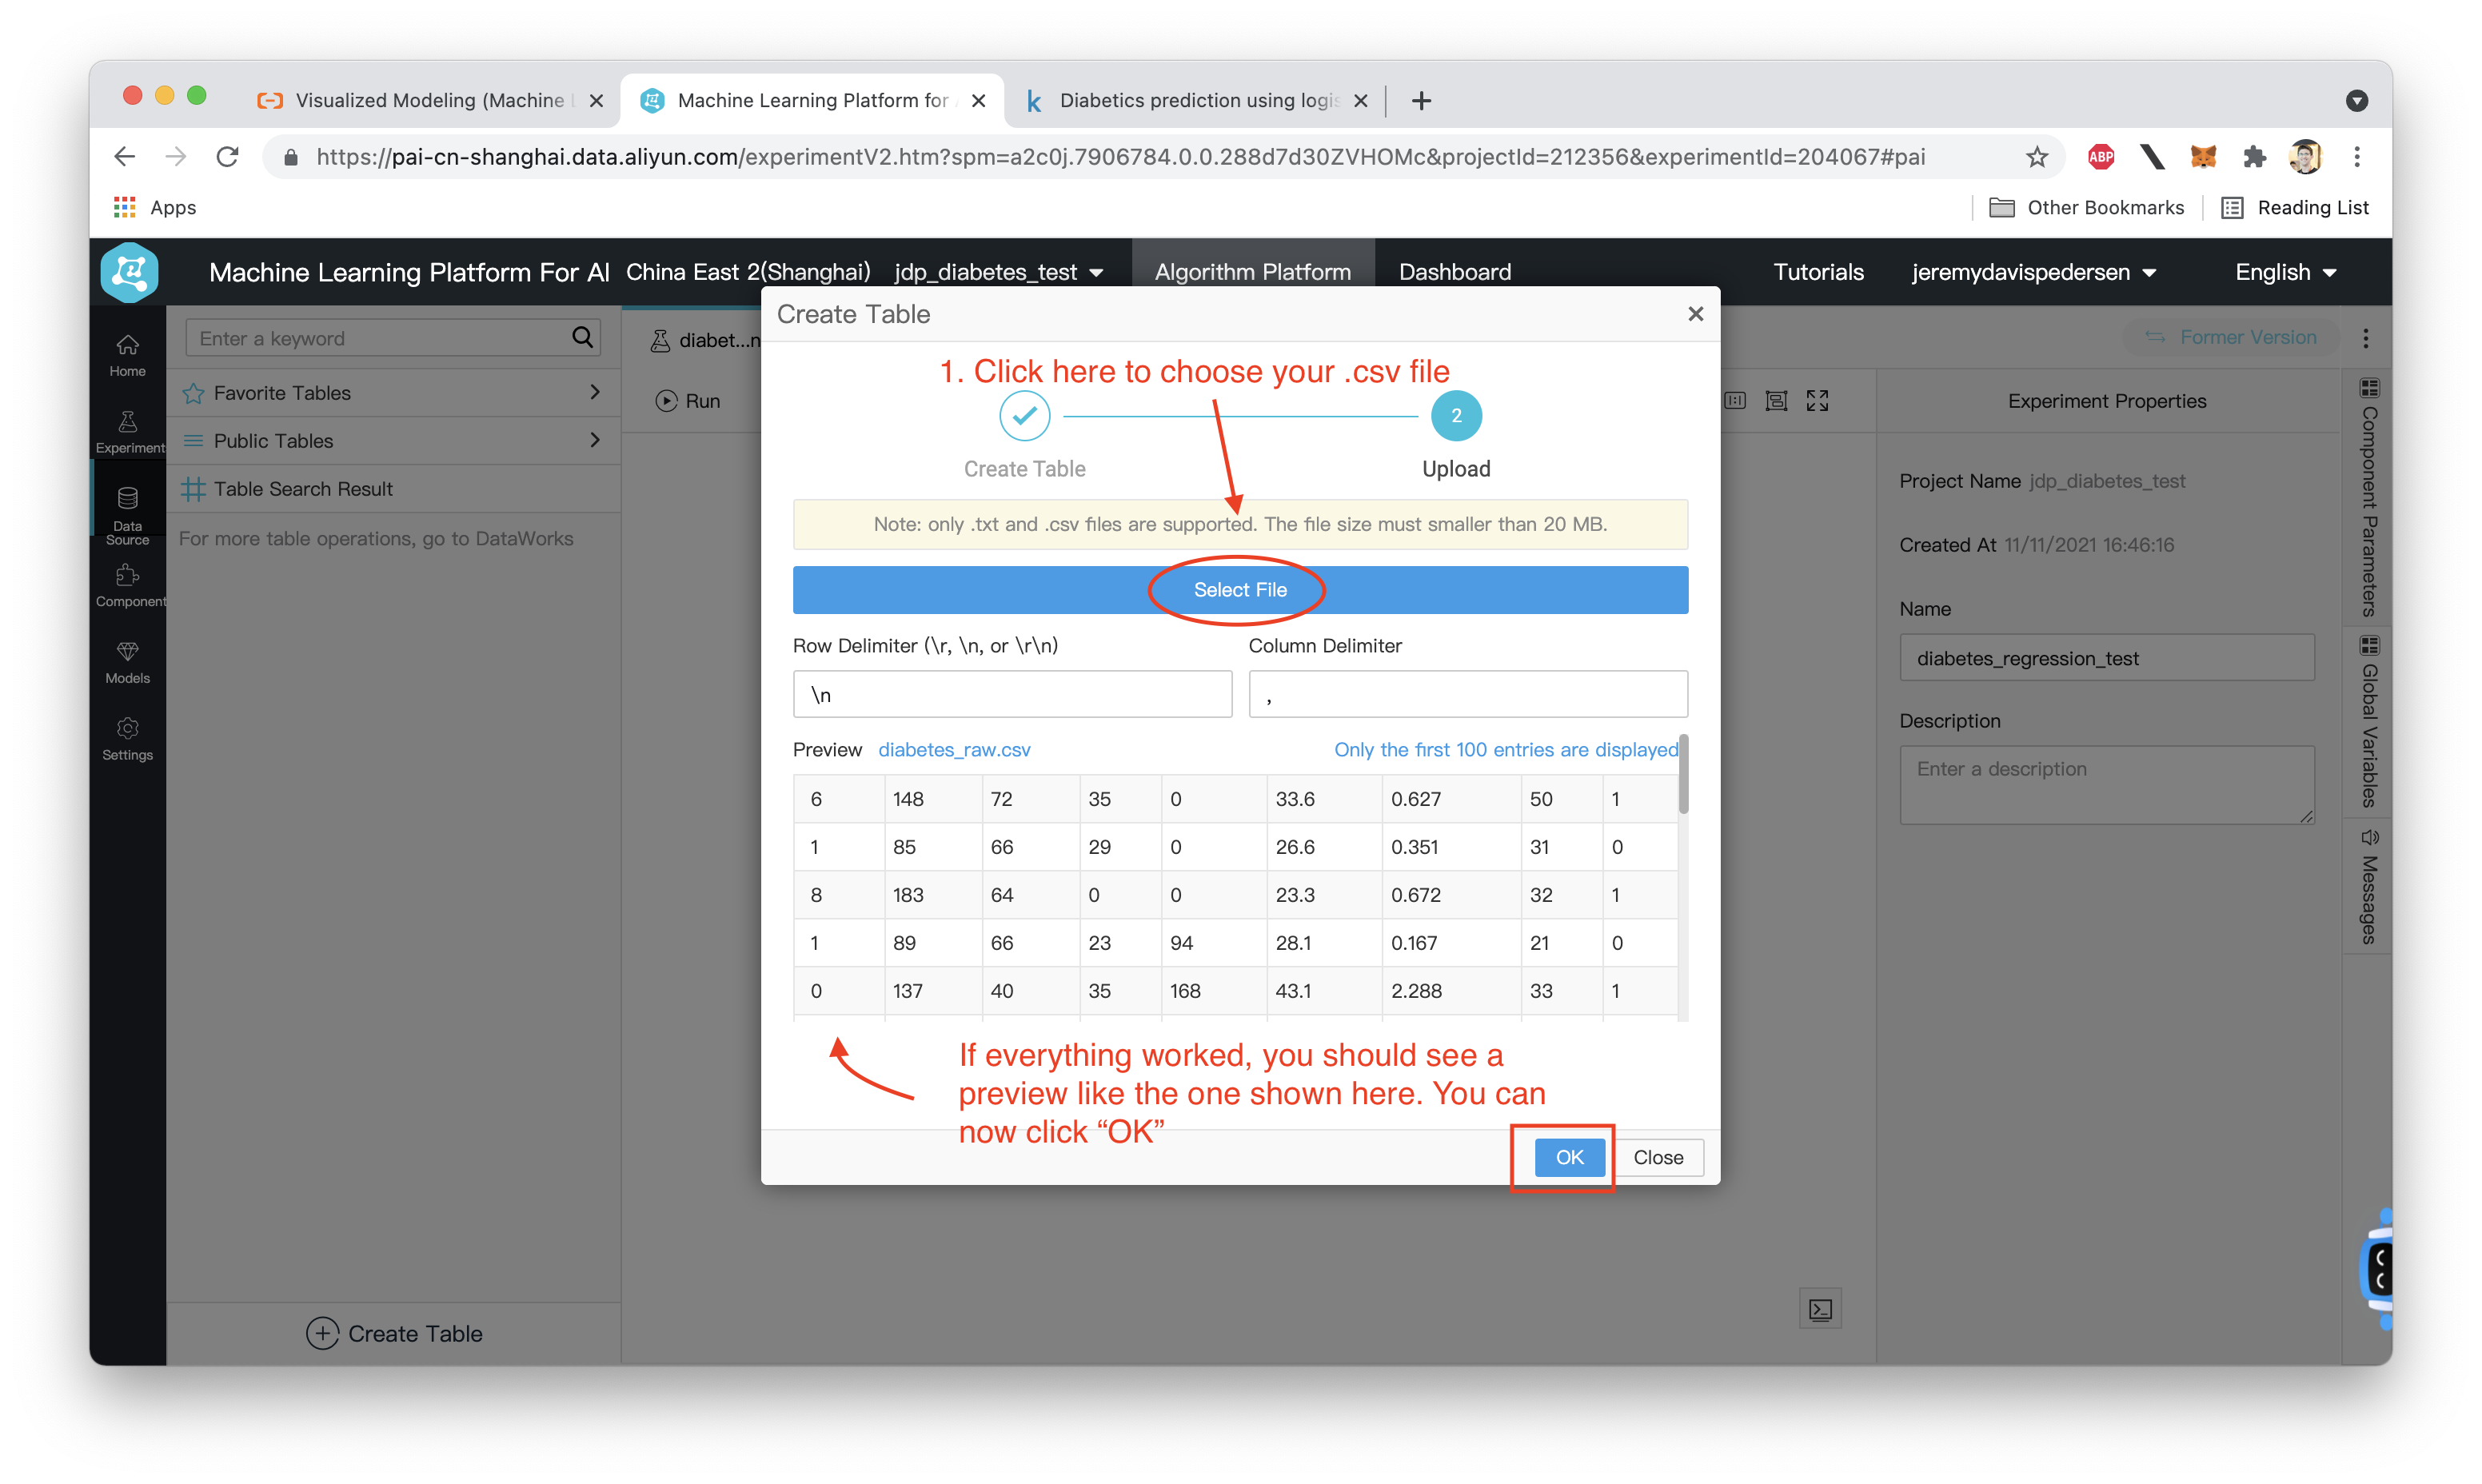
Once you've downloaded the dataset, open it up in a spreadsheet program like Excel or Numbers (or a text editor if you prefer - it's a .csv file after all). You should see something like this:
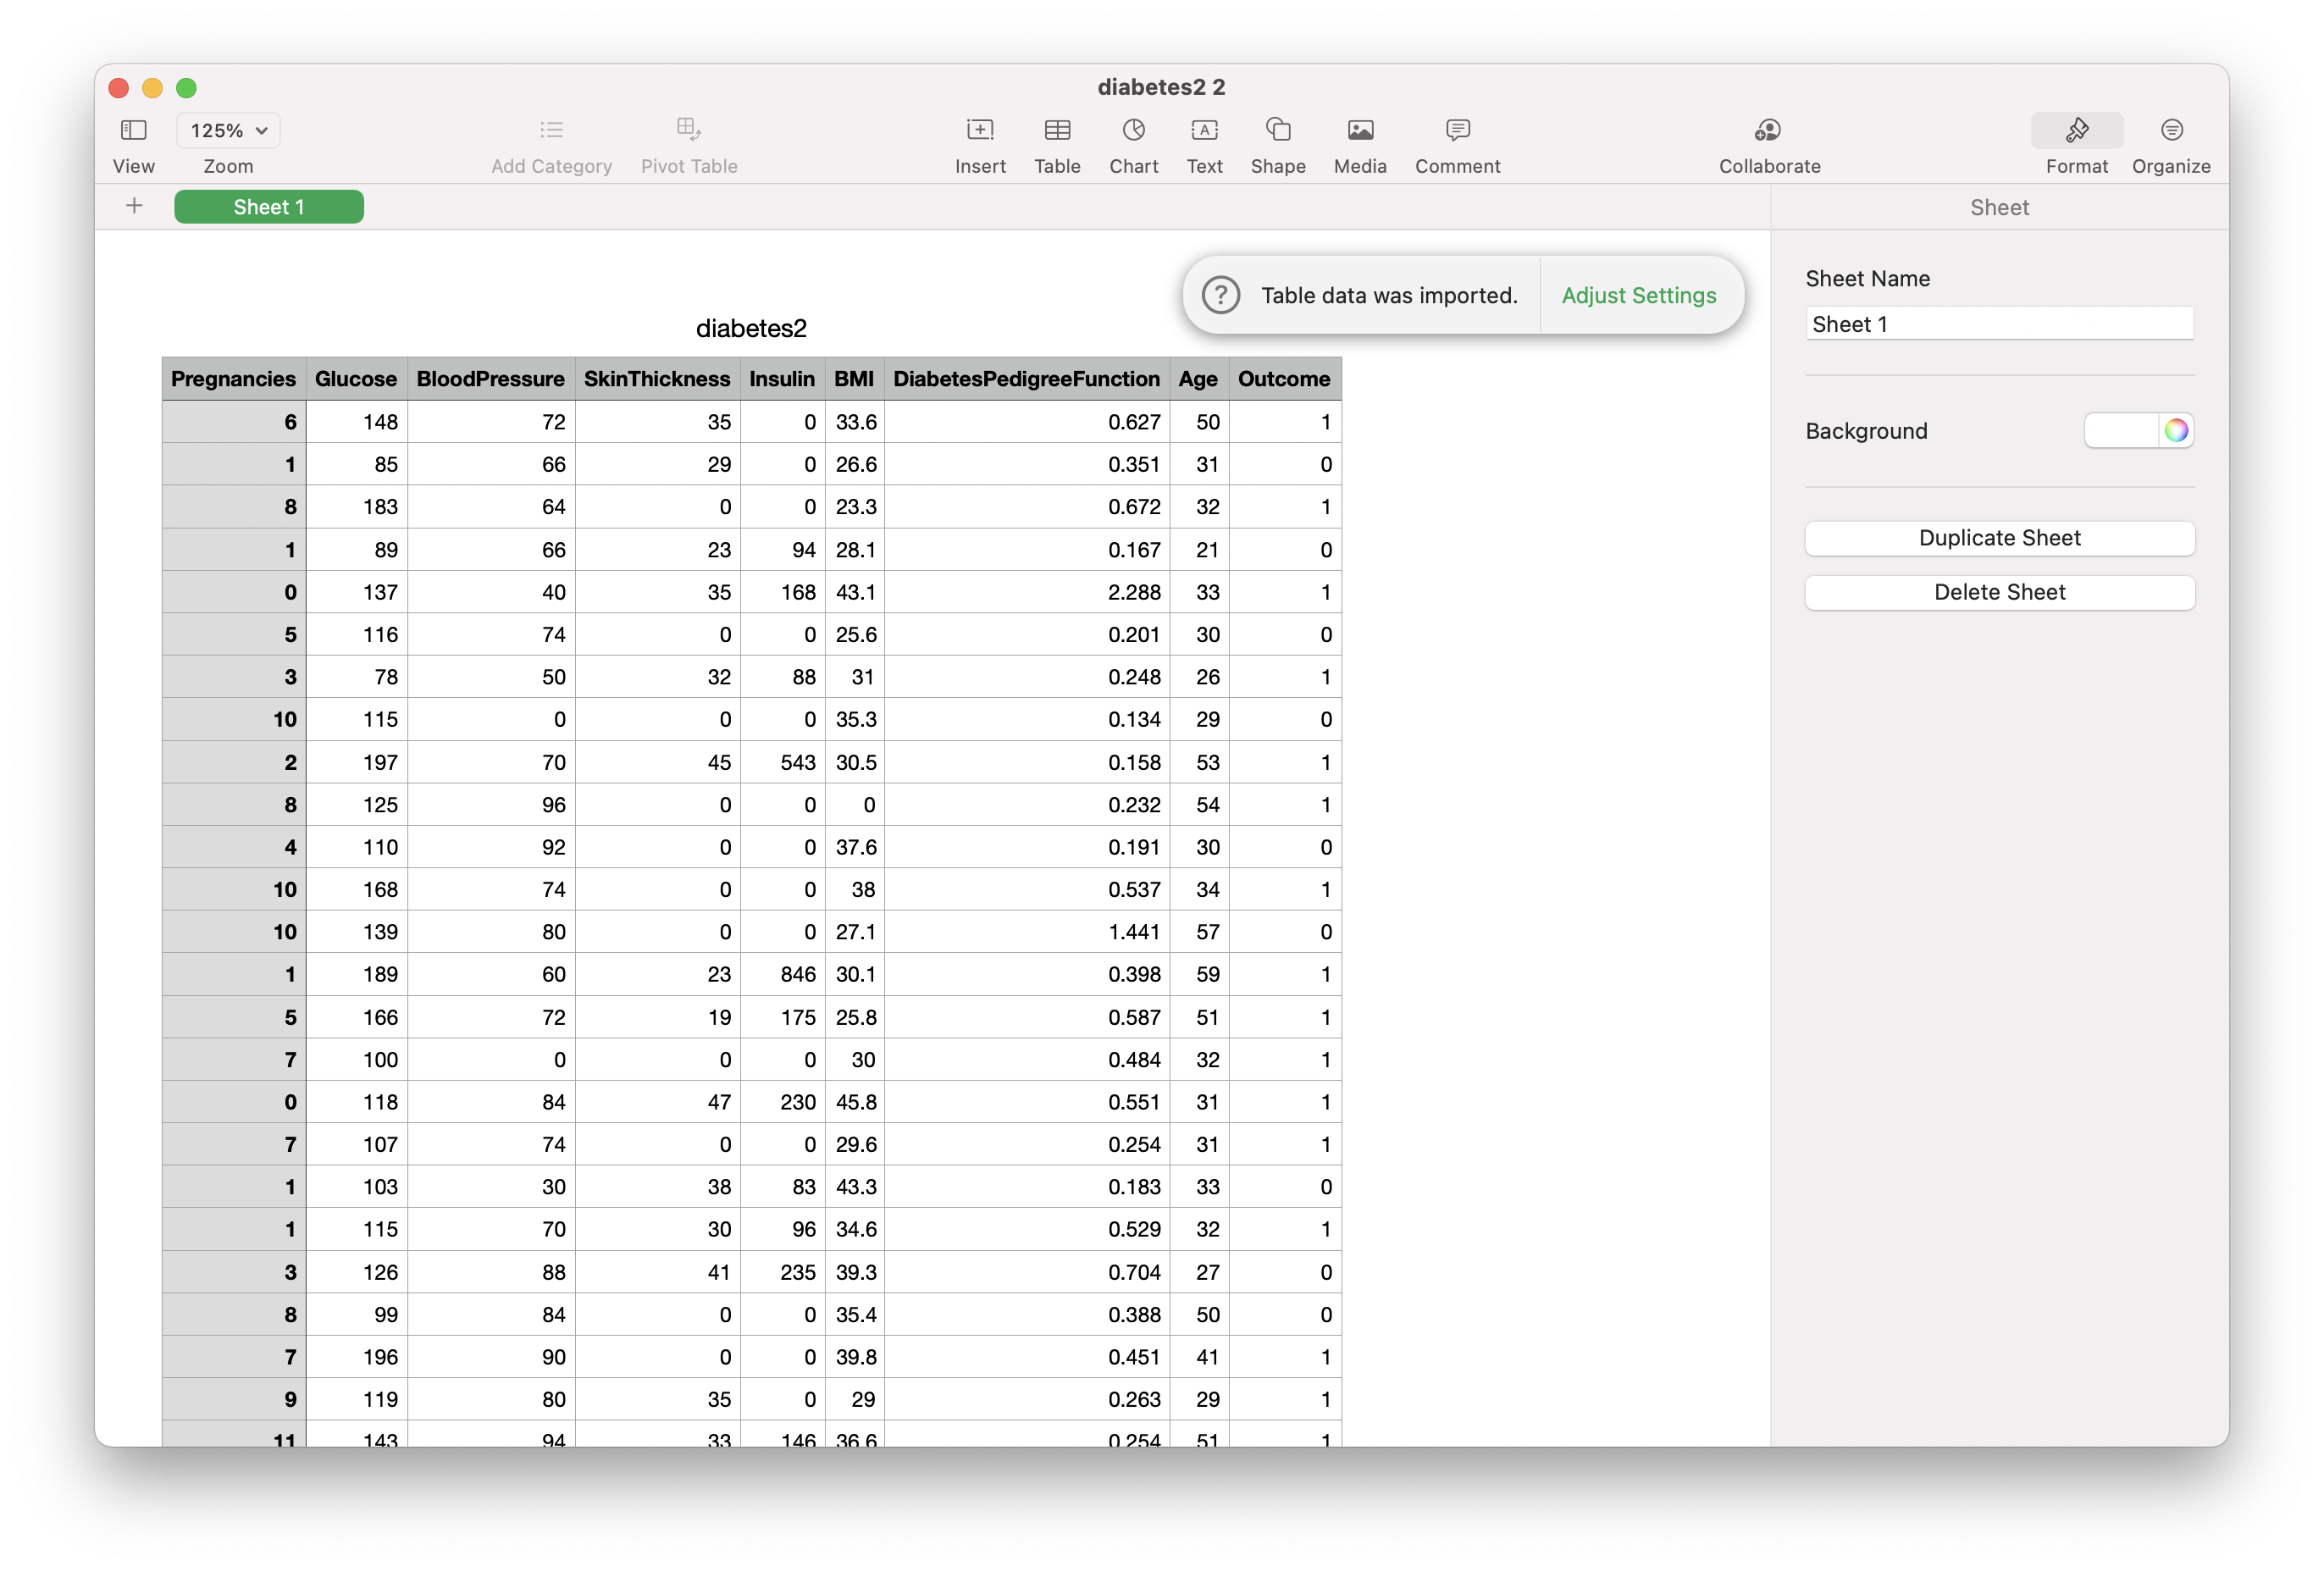
Note that you will need to remove the header row before passing the data to PAI. Take a minute to save a copy of the file with the header row removed, before moving on to the next step.
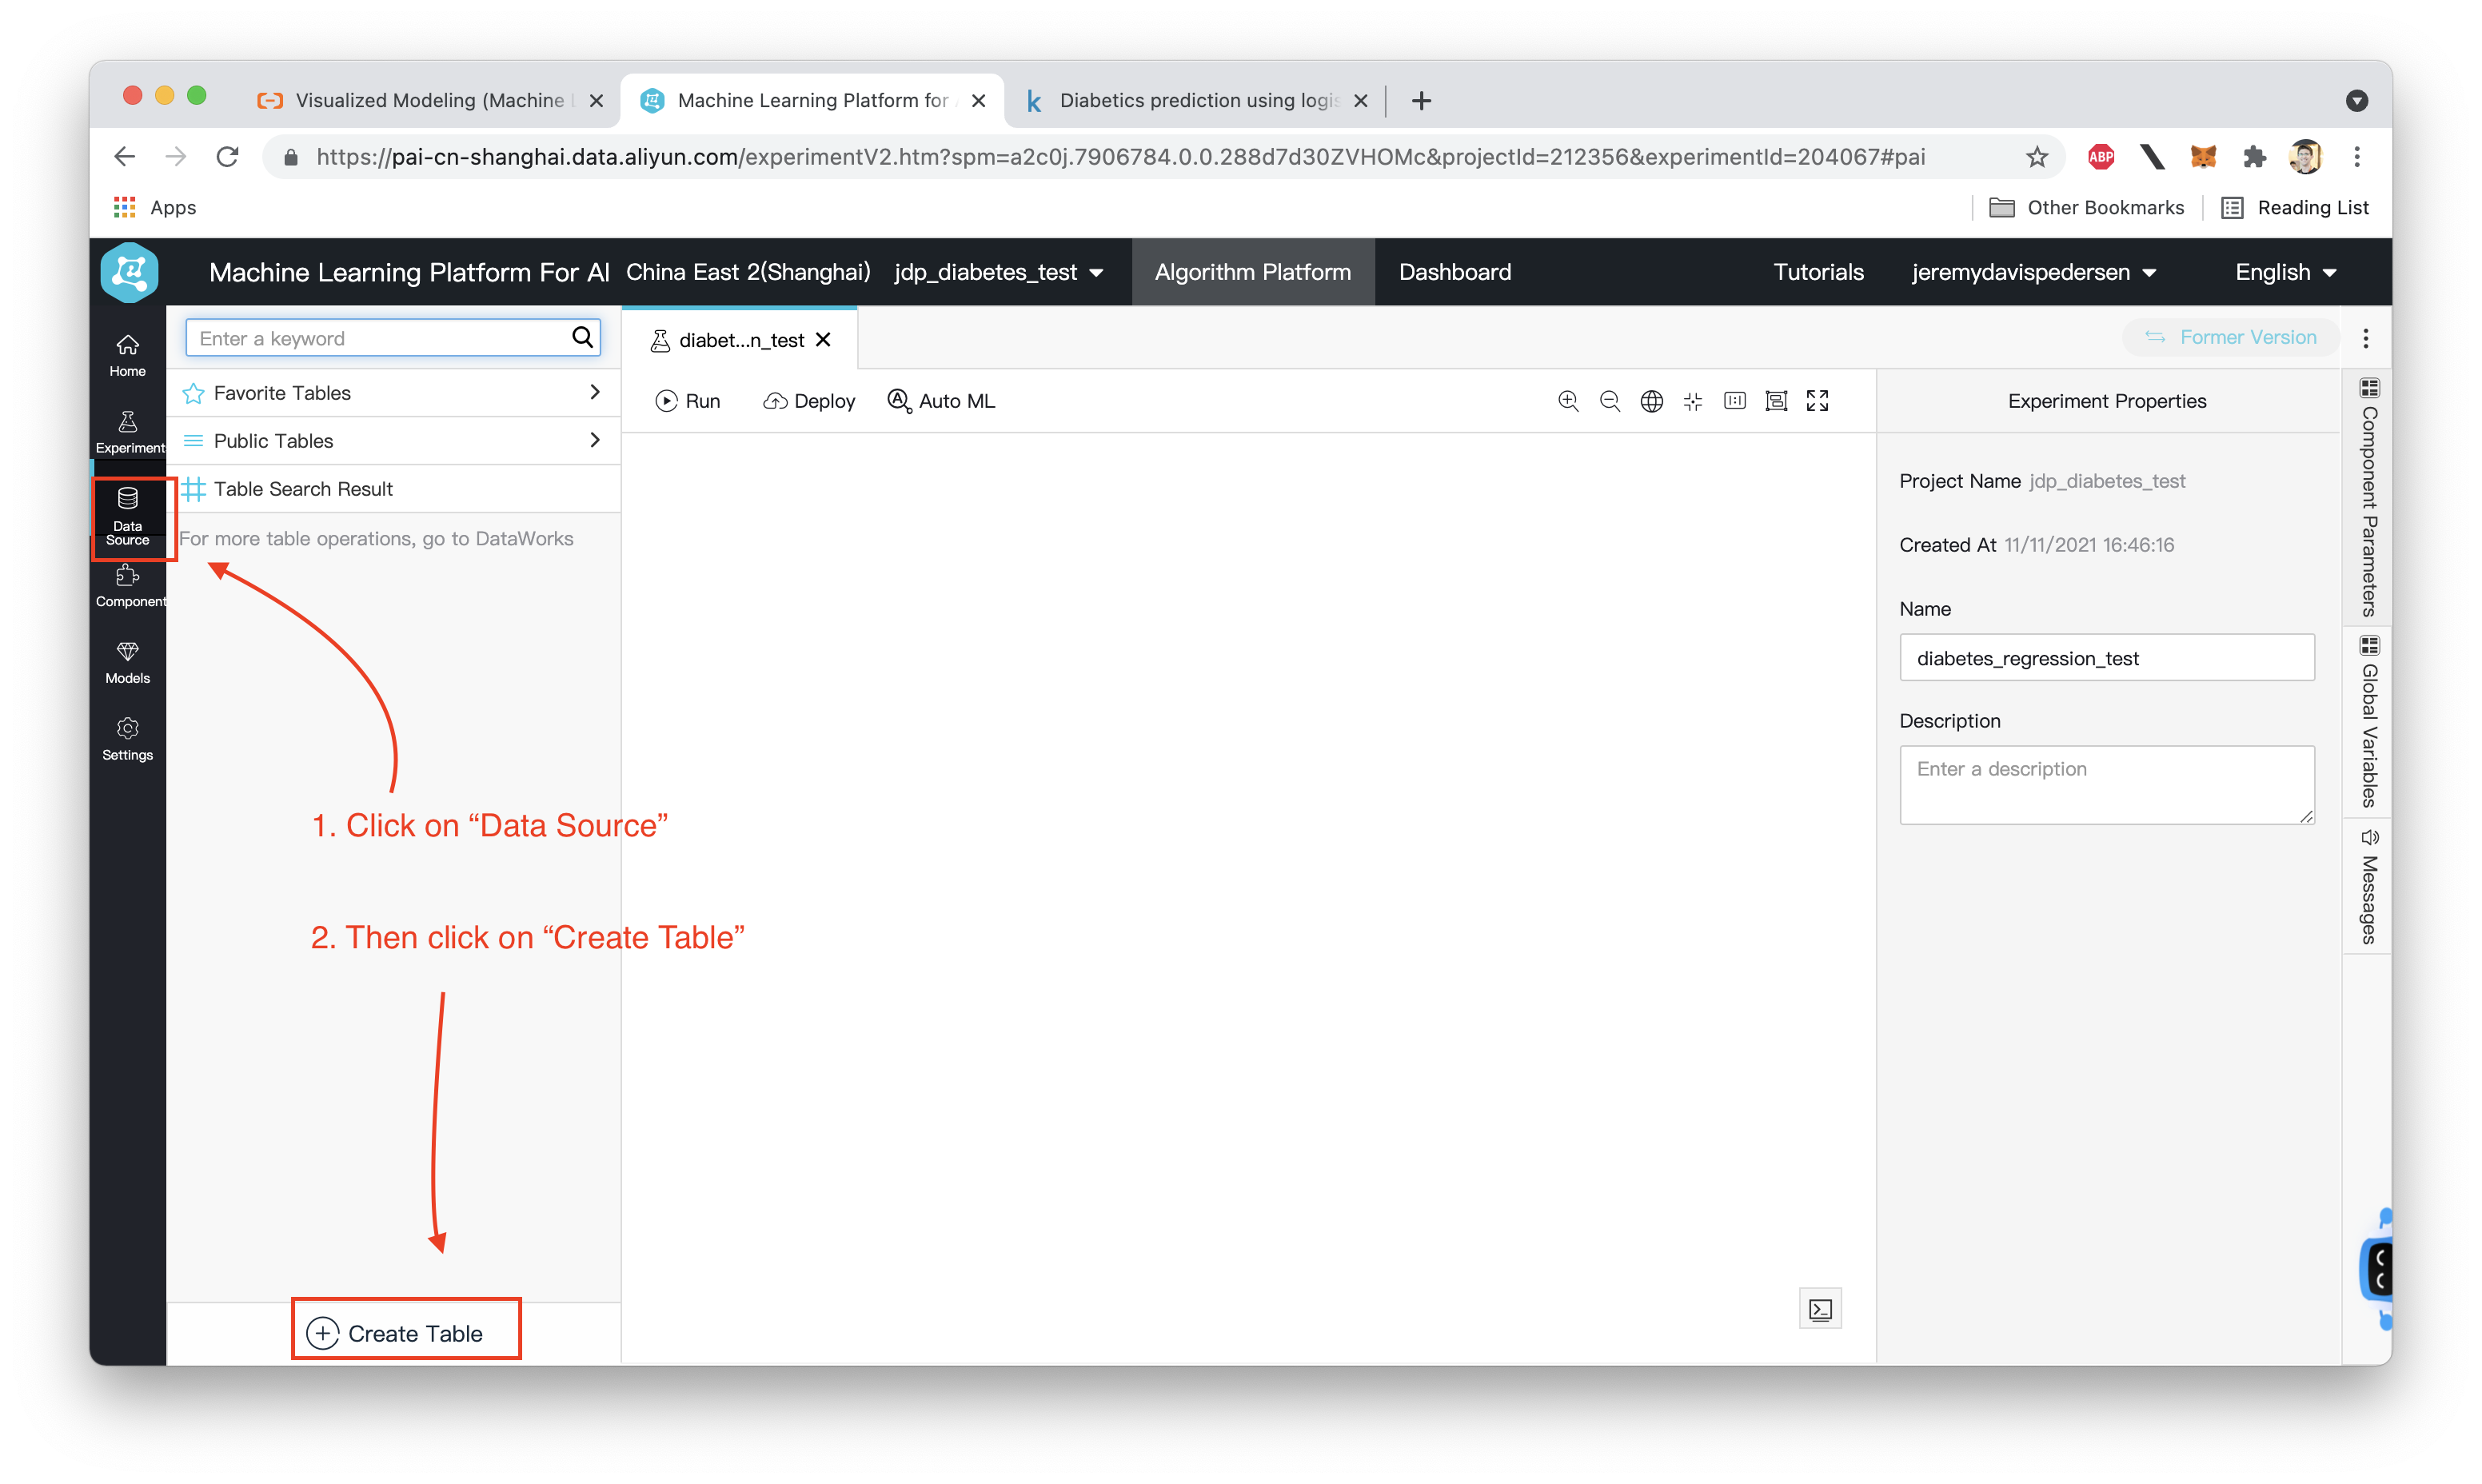
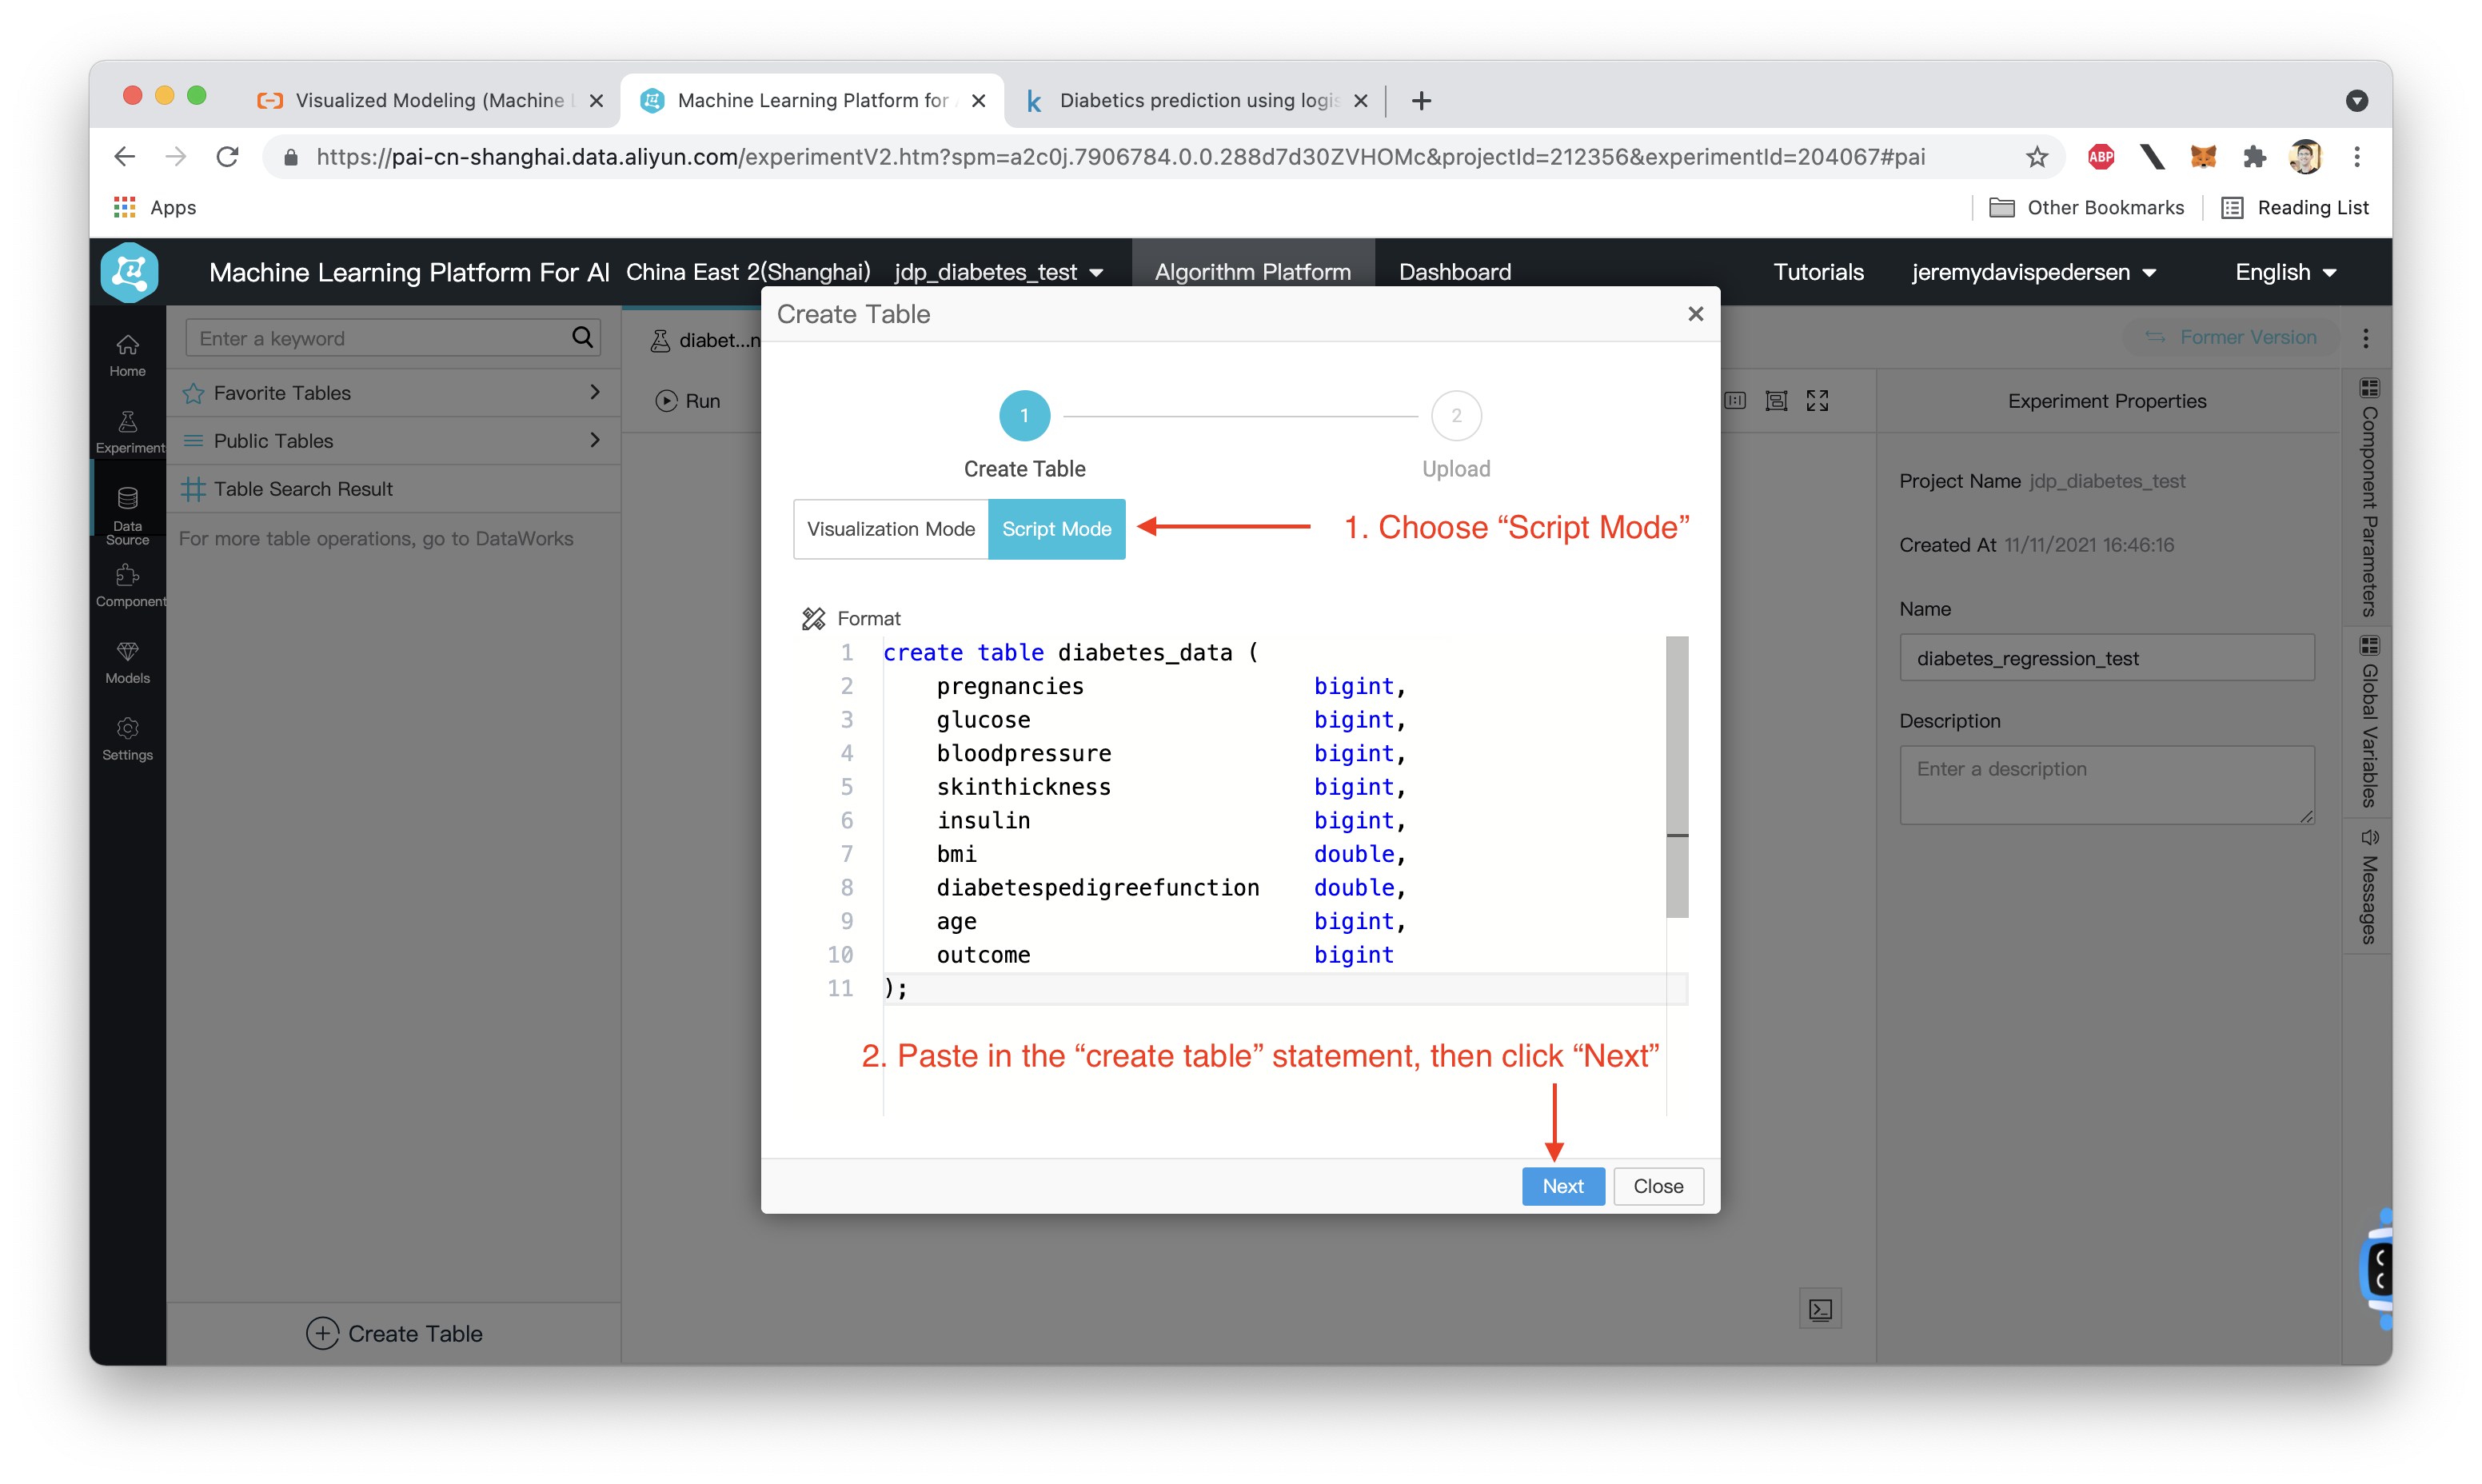
With our .csv file ready to go, the next step is to create a new table in PAI Studio and upload our data. Use the SQL DDL statement below:
create table diabetes_data (
    pregnancies                    bigint,
    glucose                        bigint,
    bloodpressure                bigint,
    skinthickness                bigint,
    insulin                        bigint,
    bmi                            double,
    diabetespedigreefunction    double,
    age                            bigint,
    outcome                        bigint
);
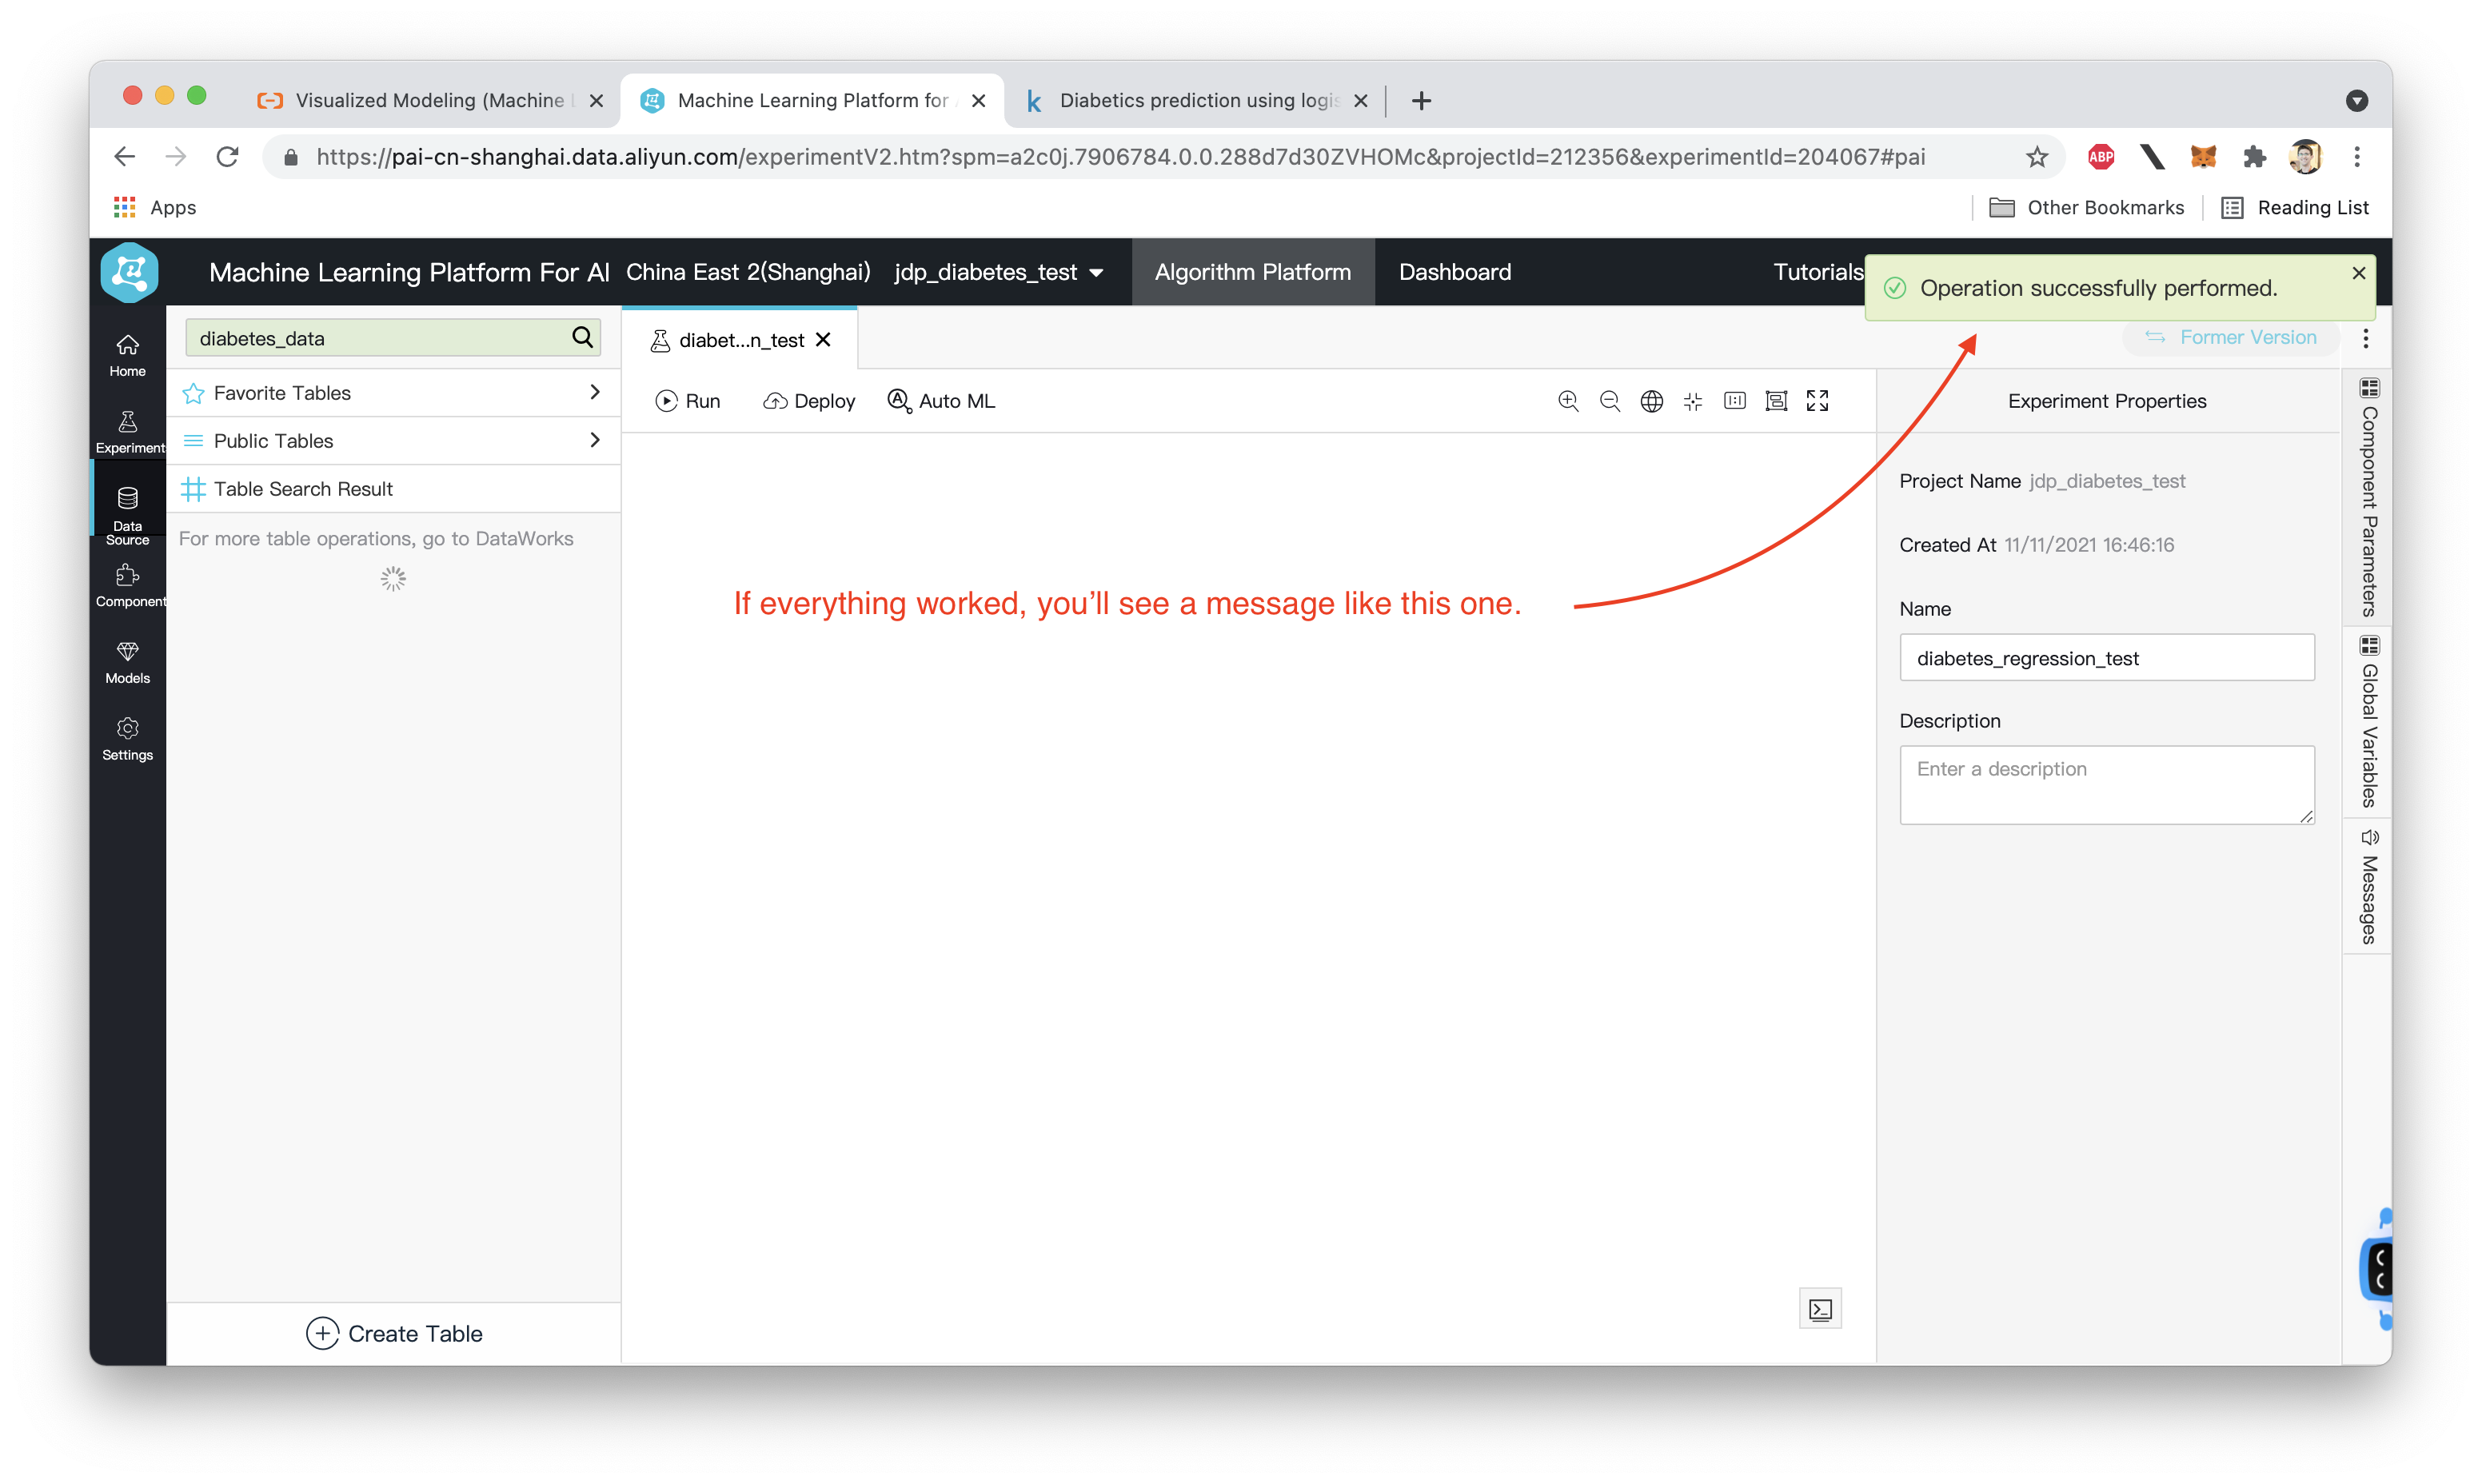
Here are the steps you'll need to take in the console:
Now that we've created our table, we need to add some nodes to our Machine Learning workflow. Specifically, we want to:
We can do this easily by dragging and dropping blocks onto the dashboard:
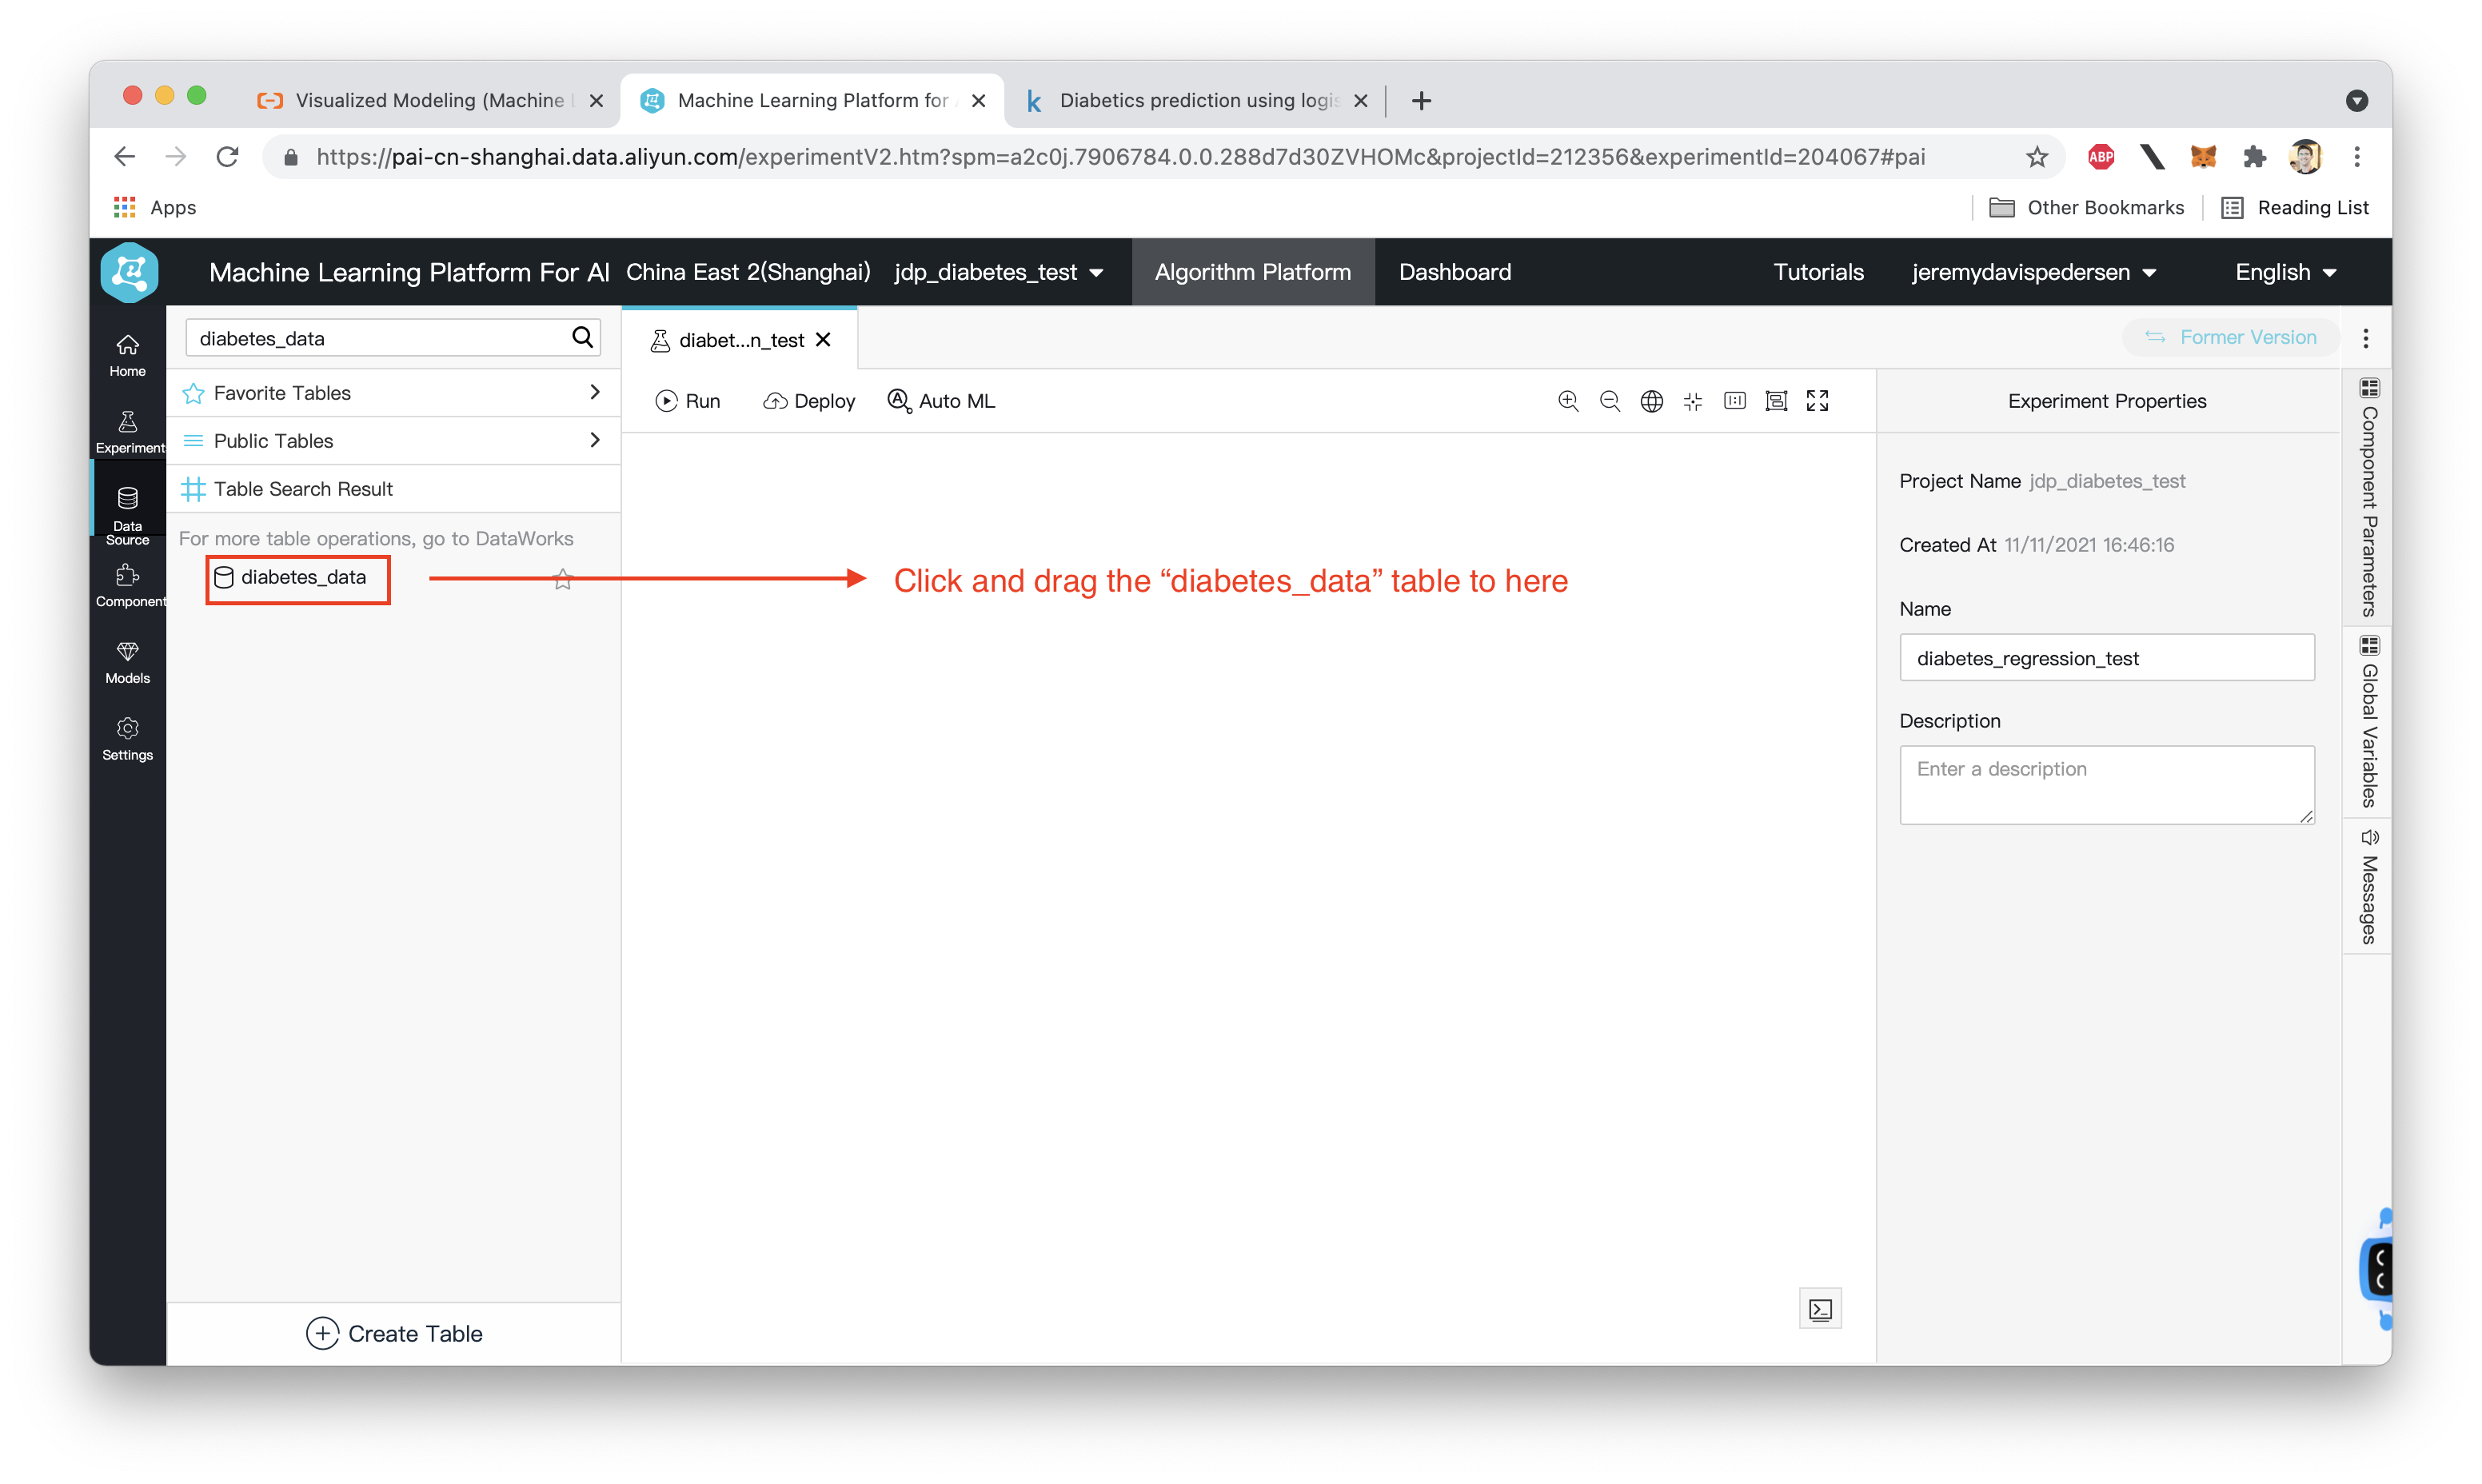
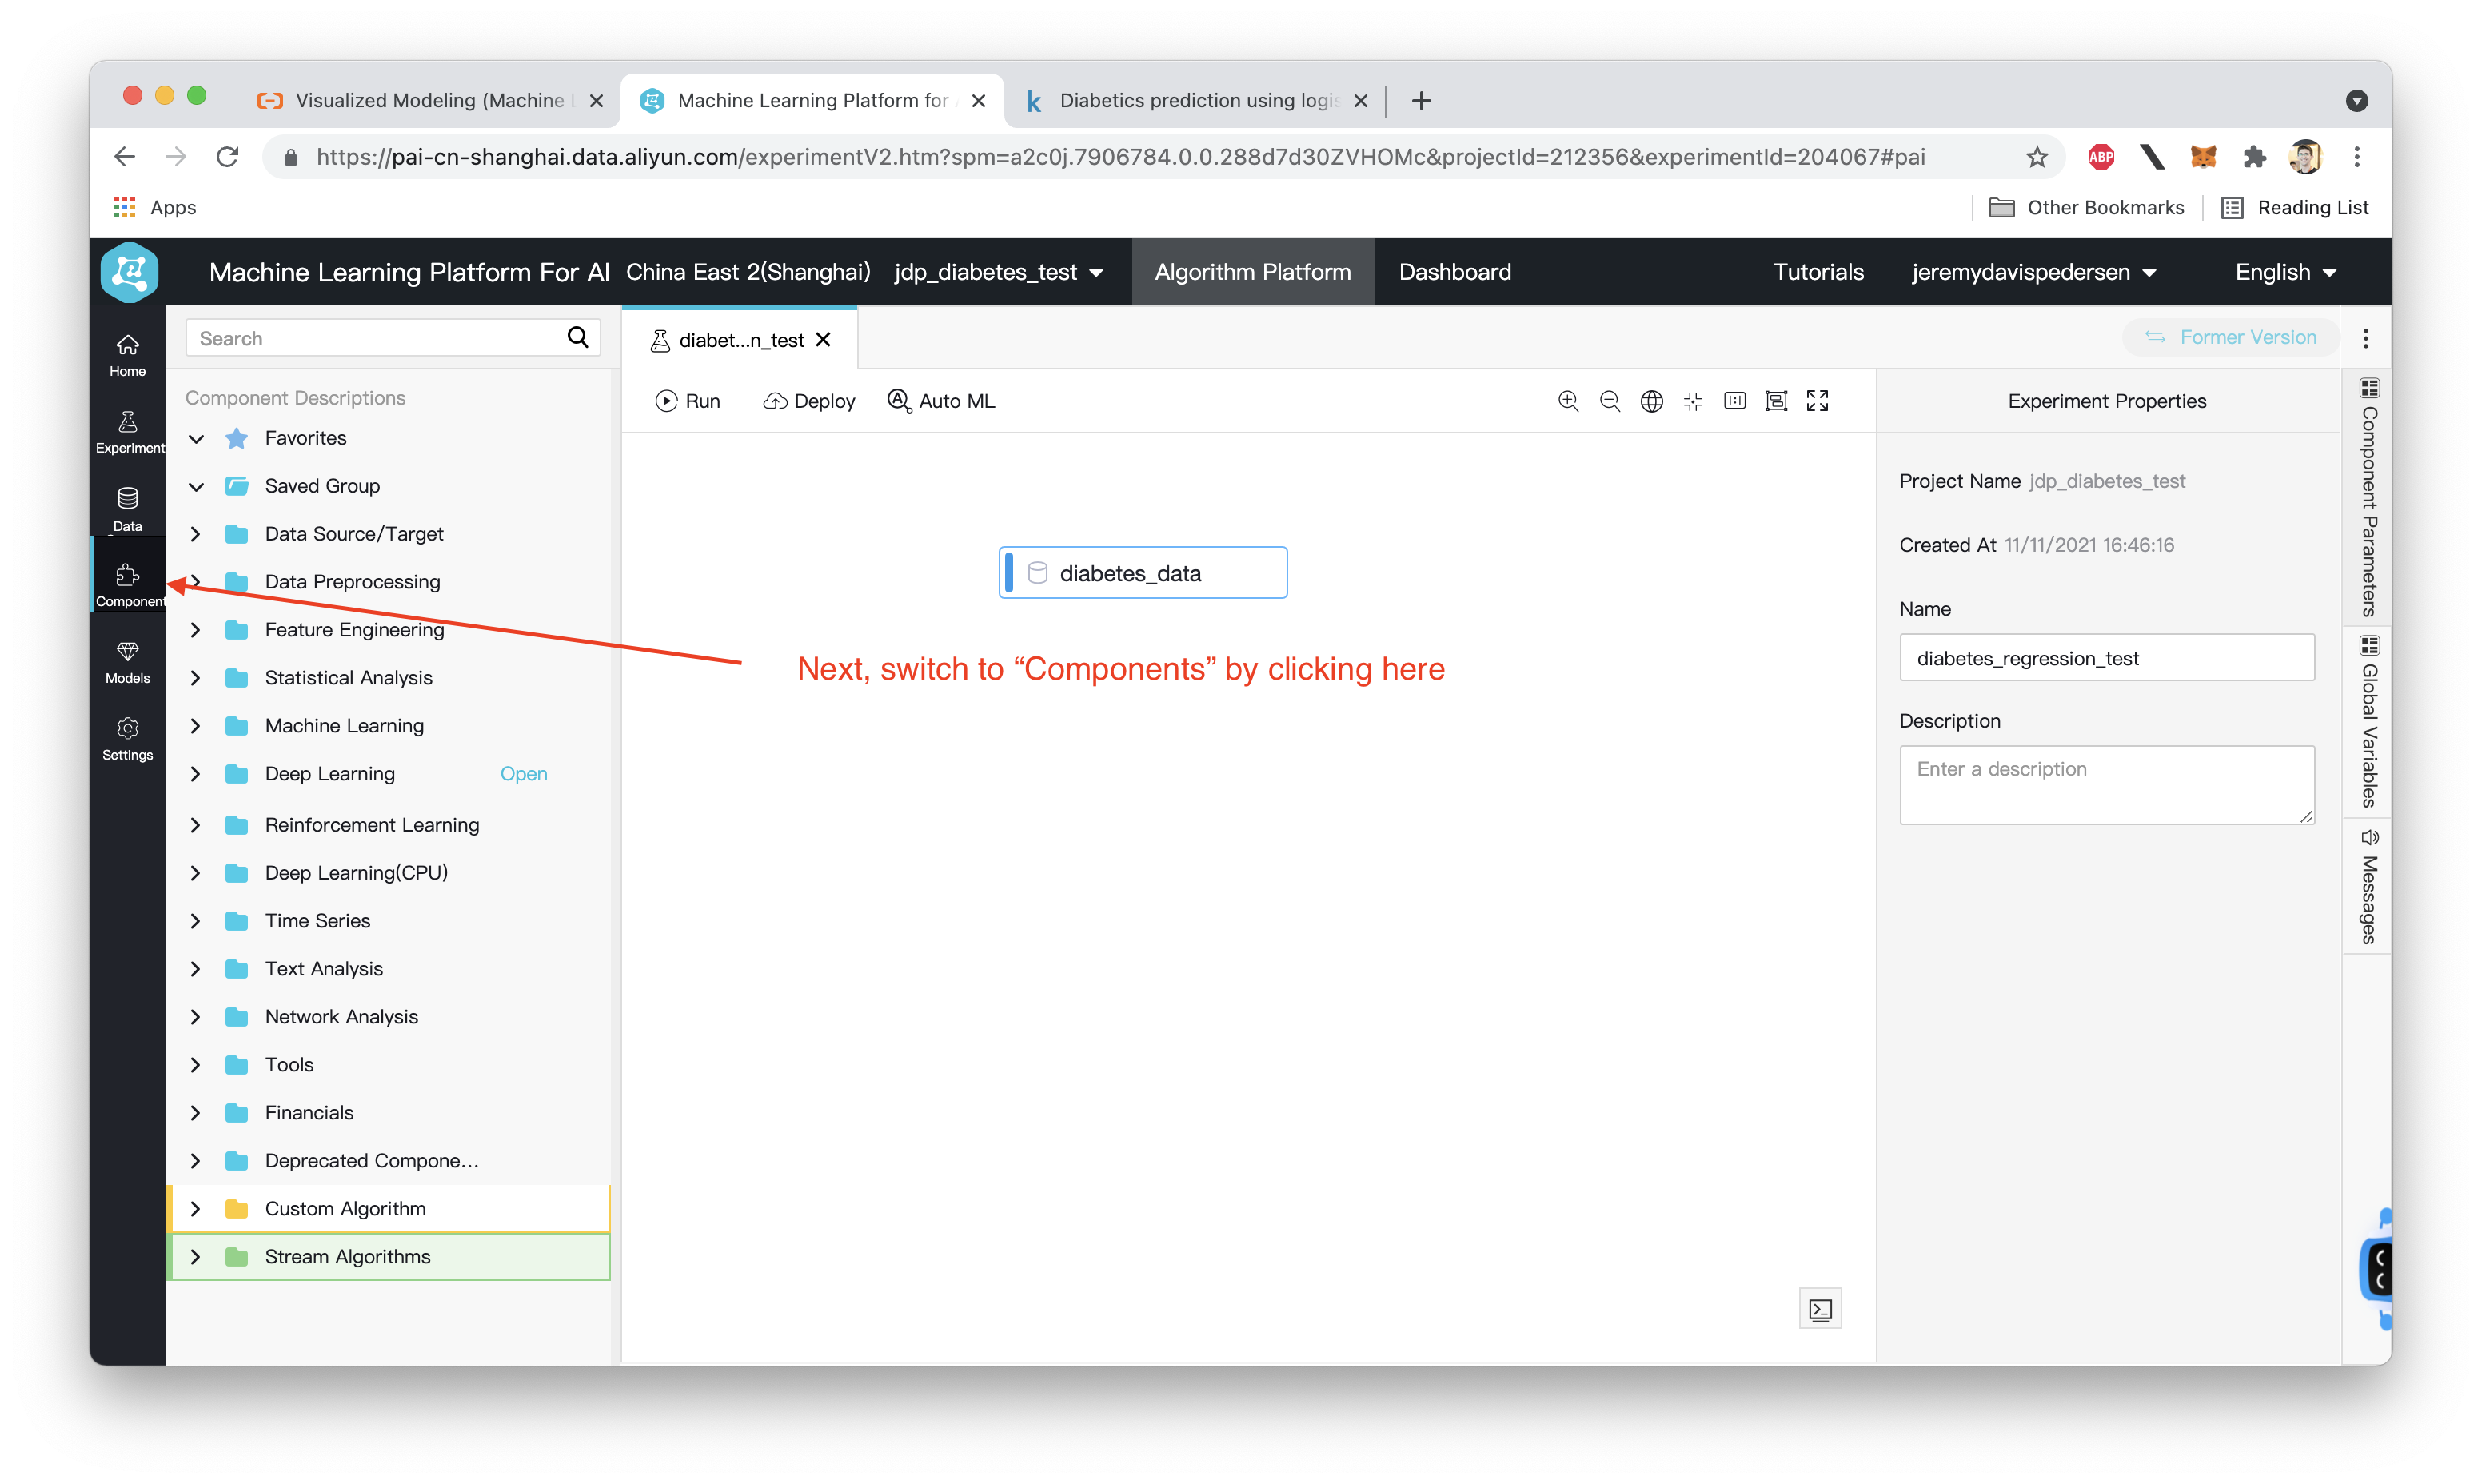
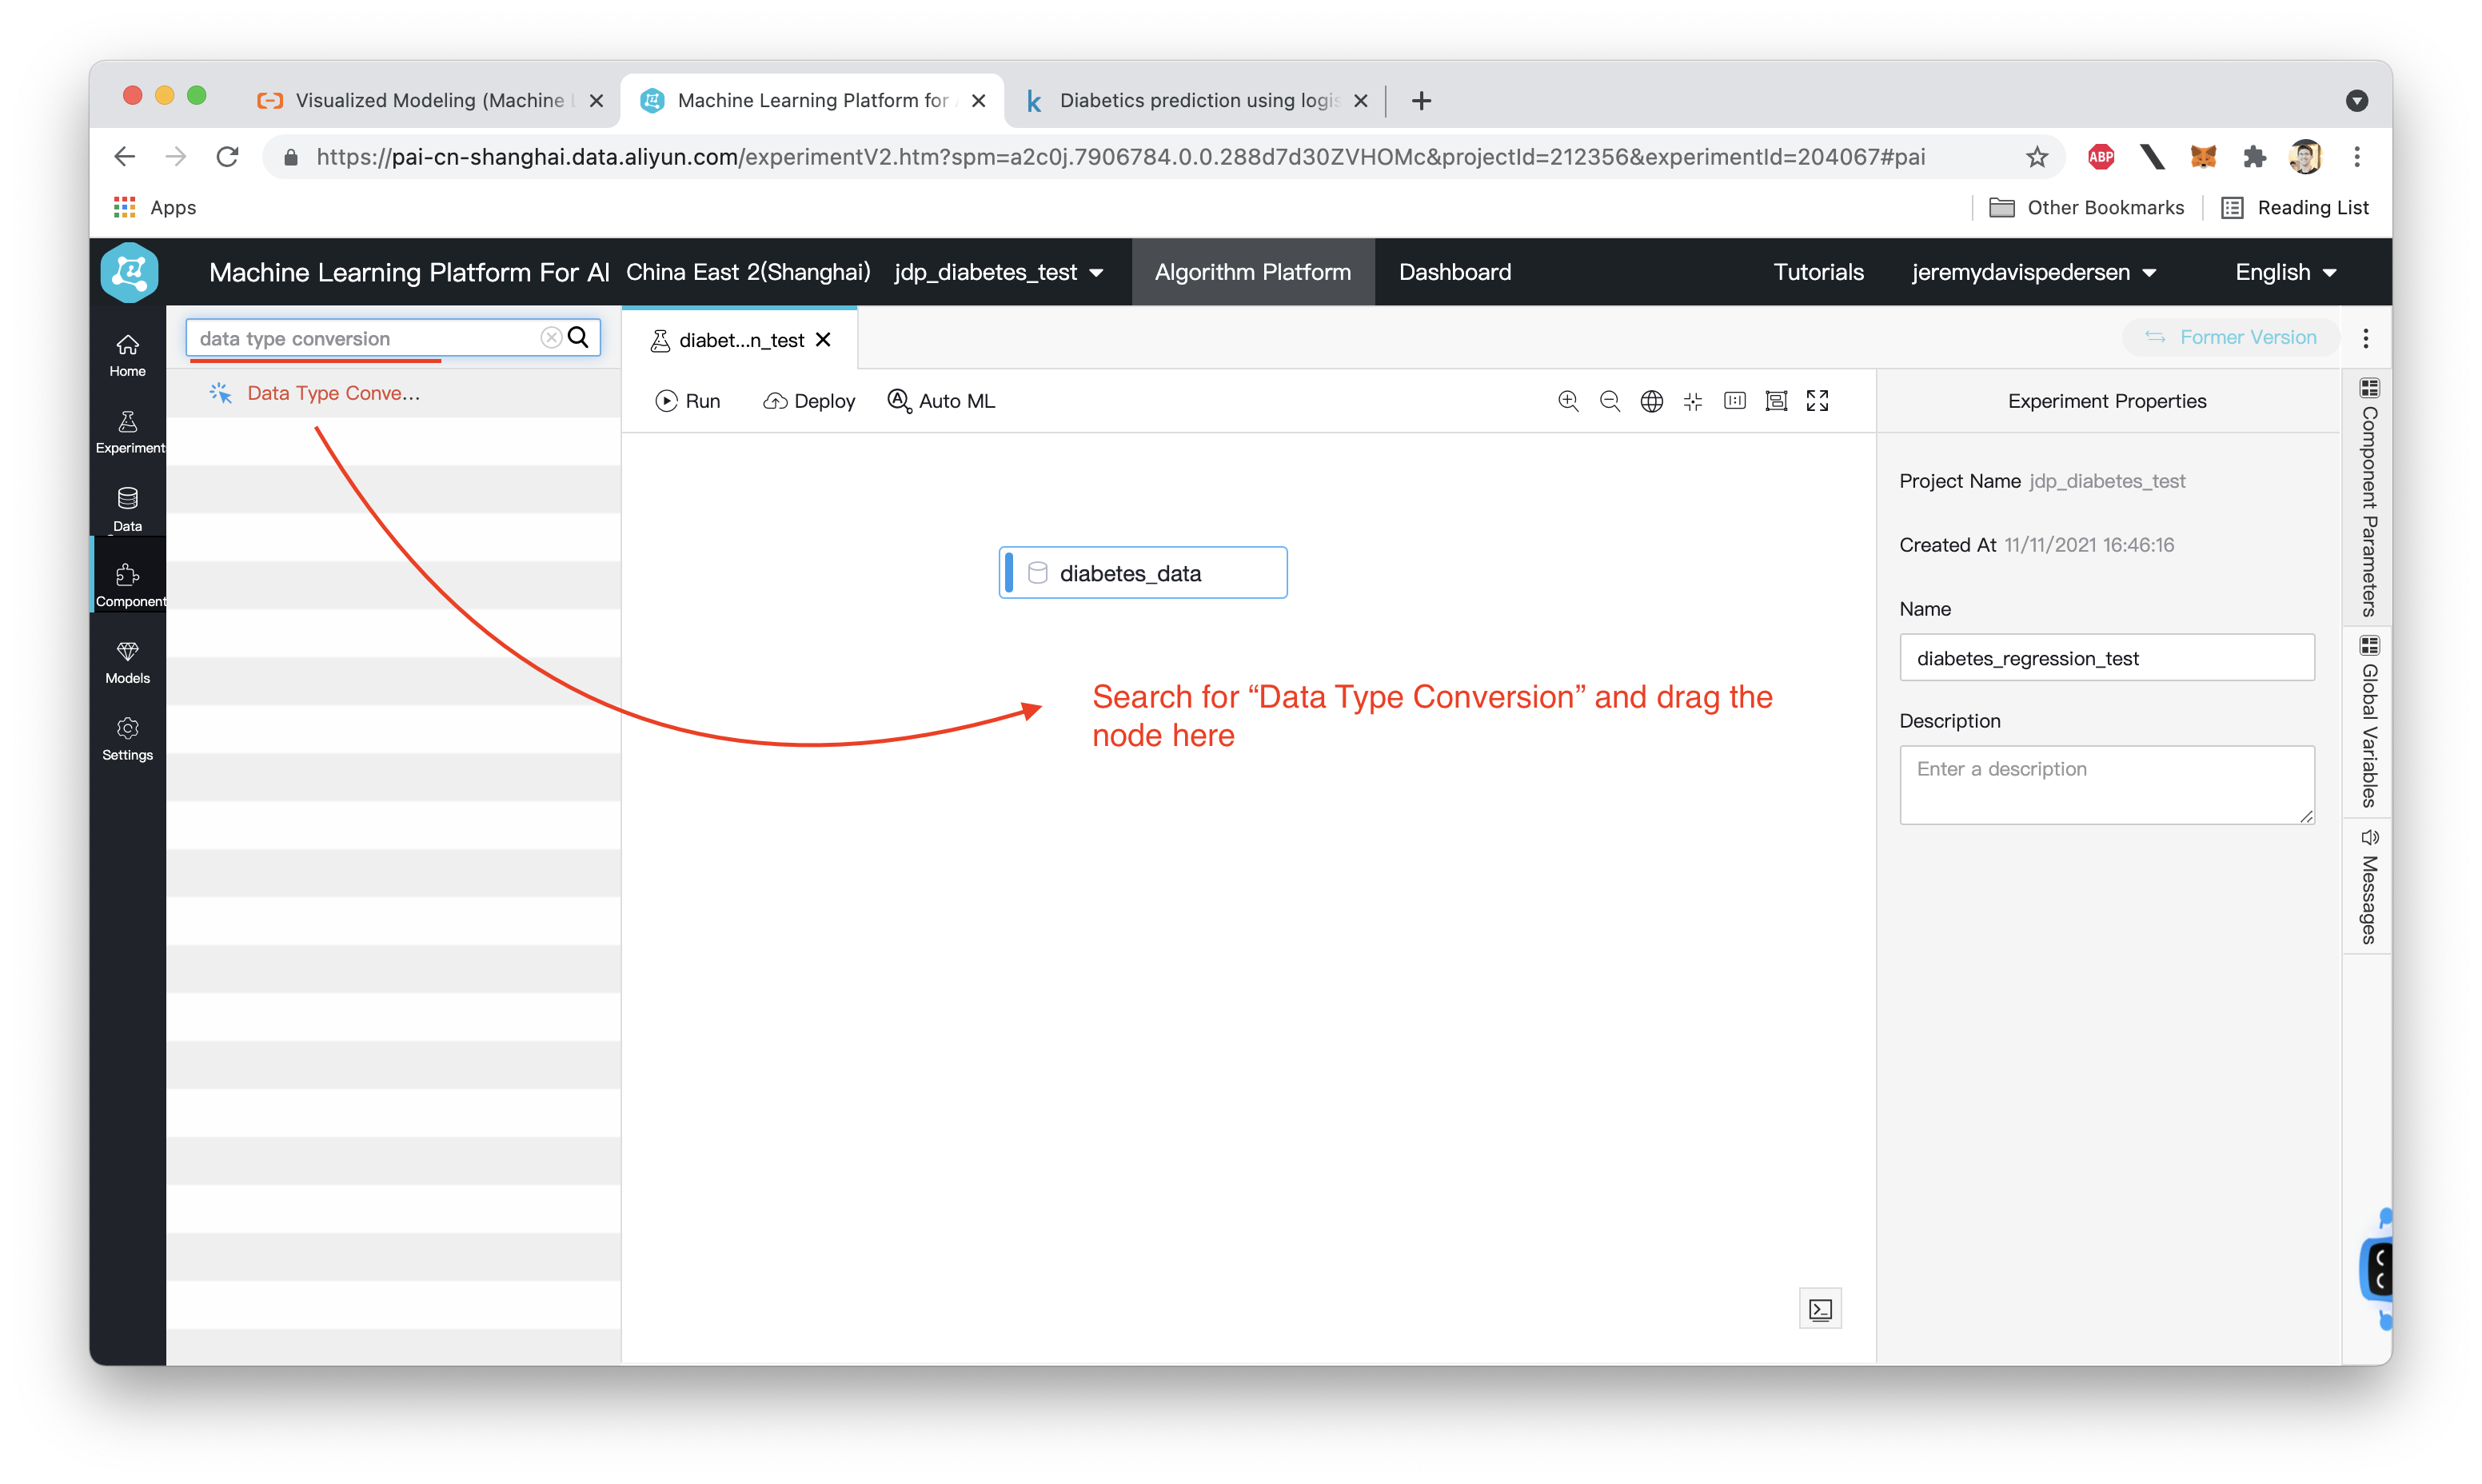
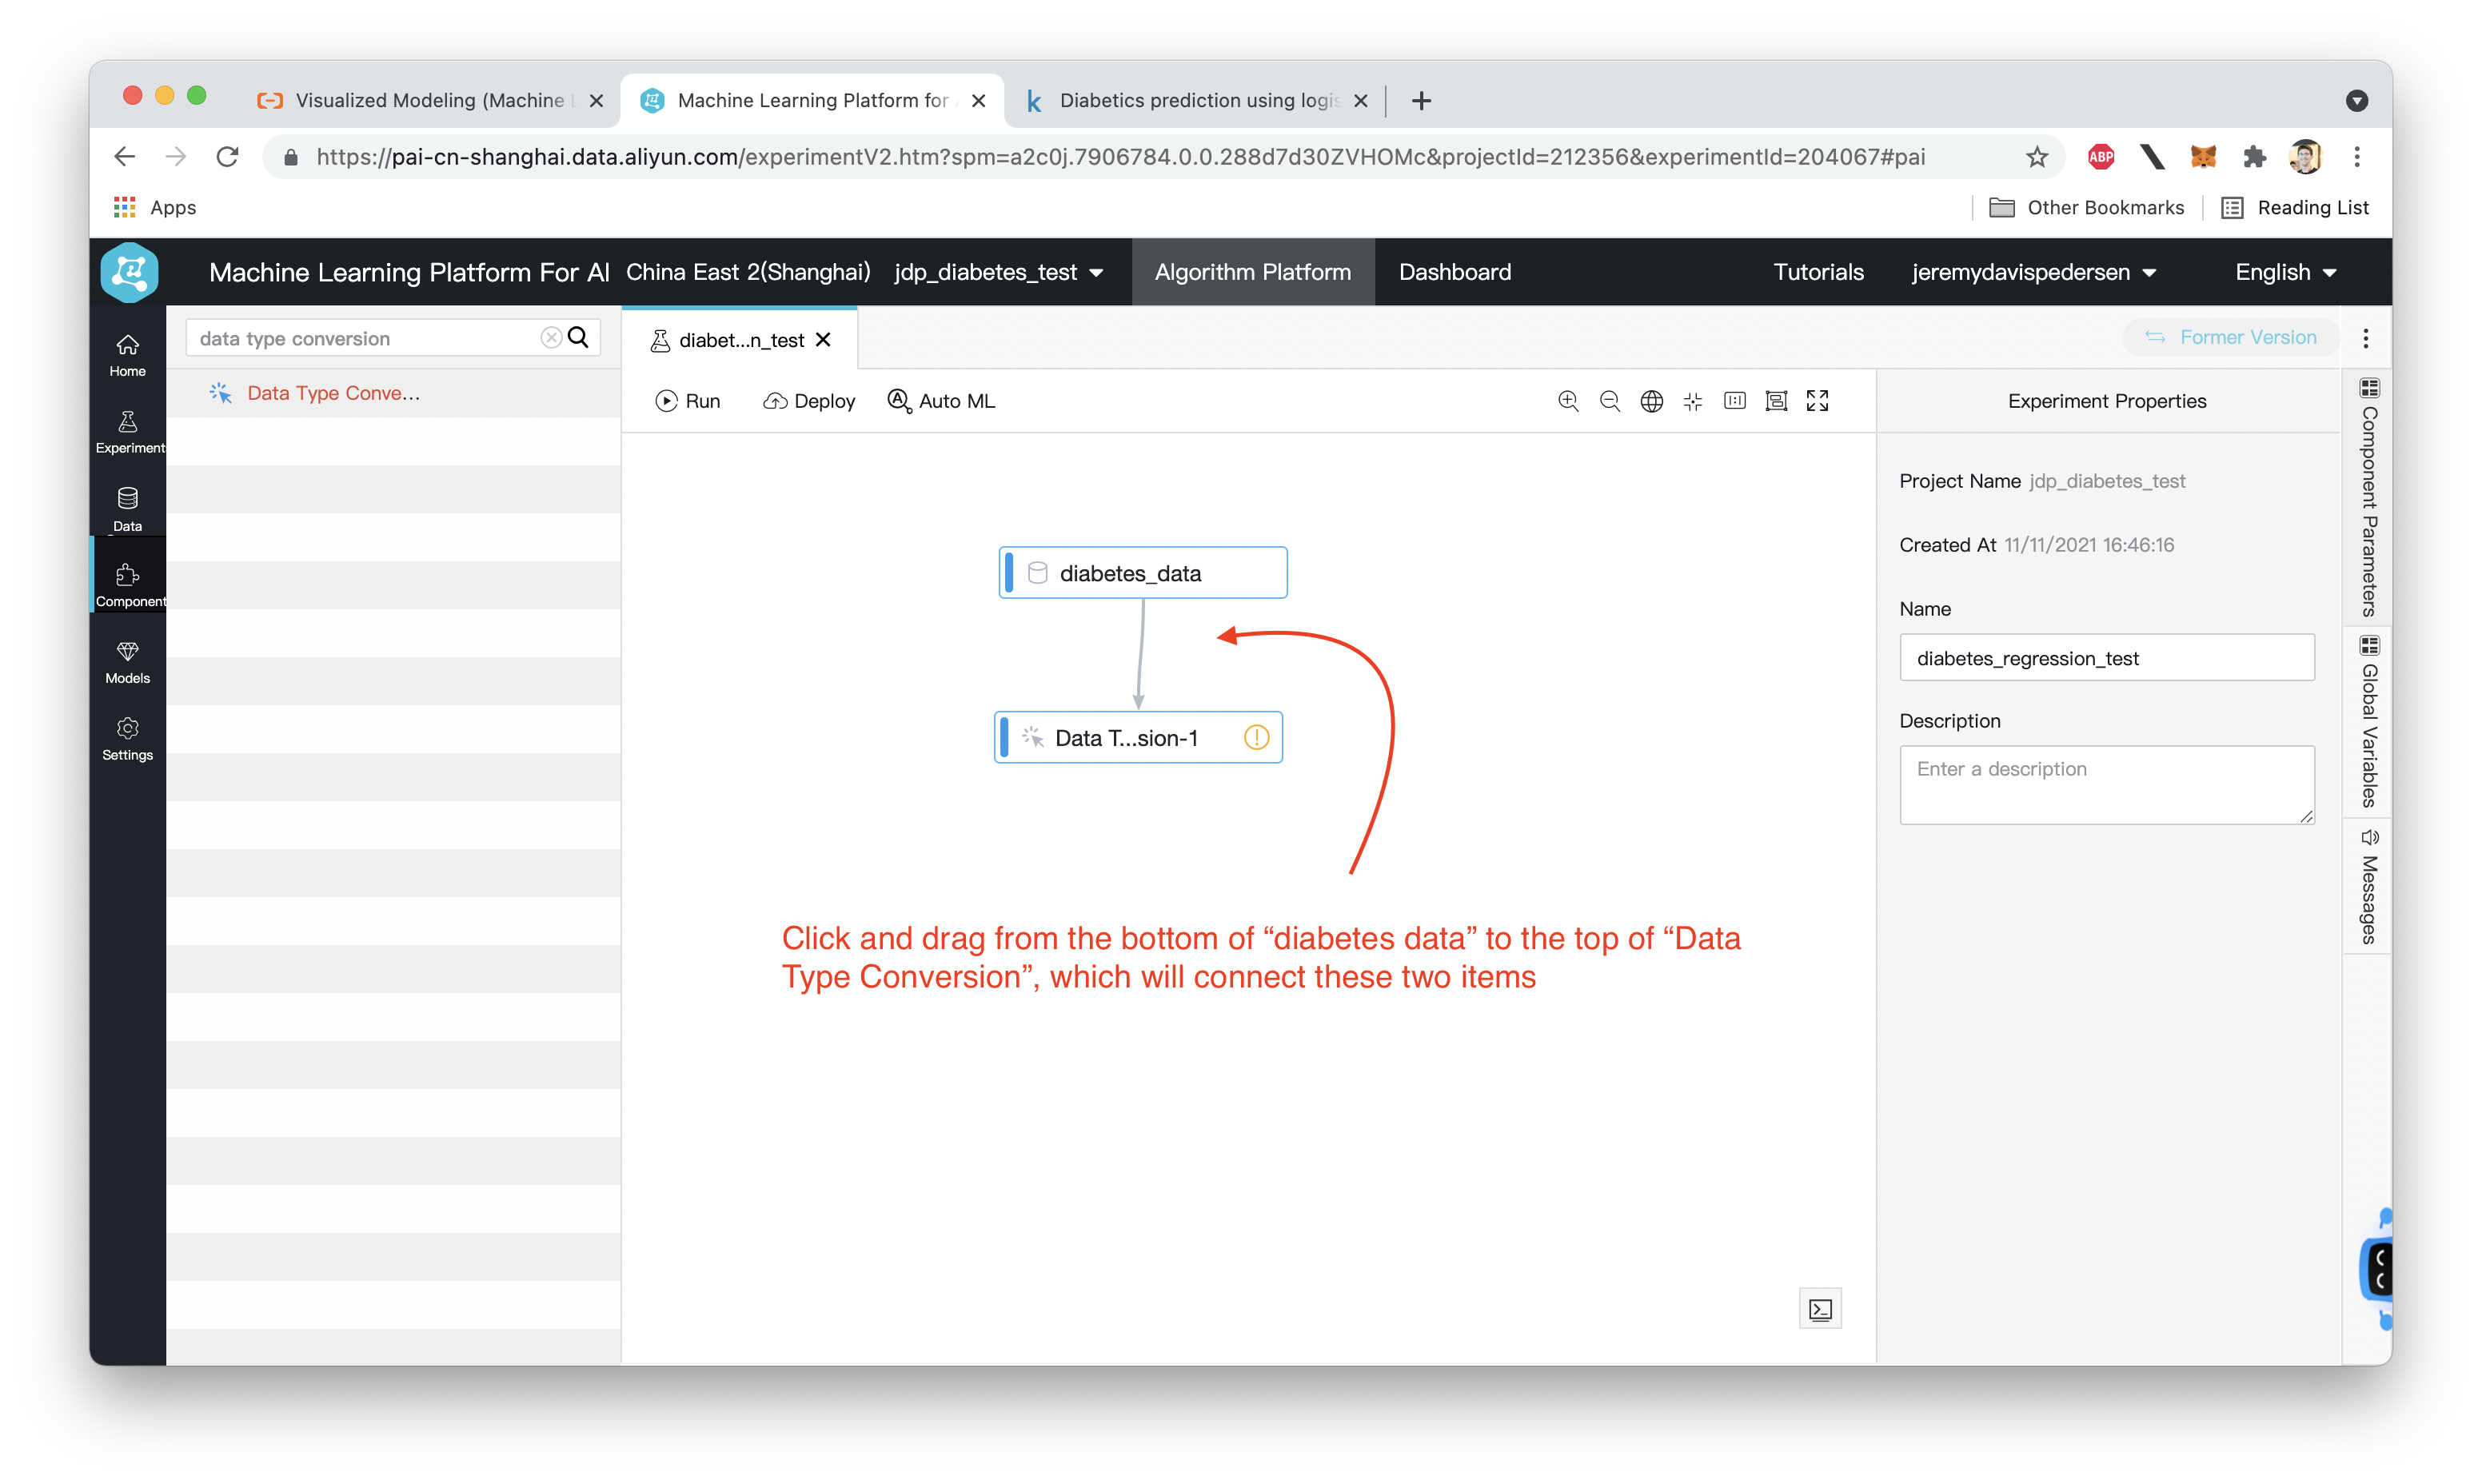
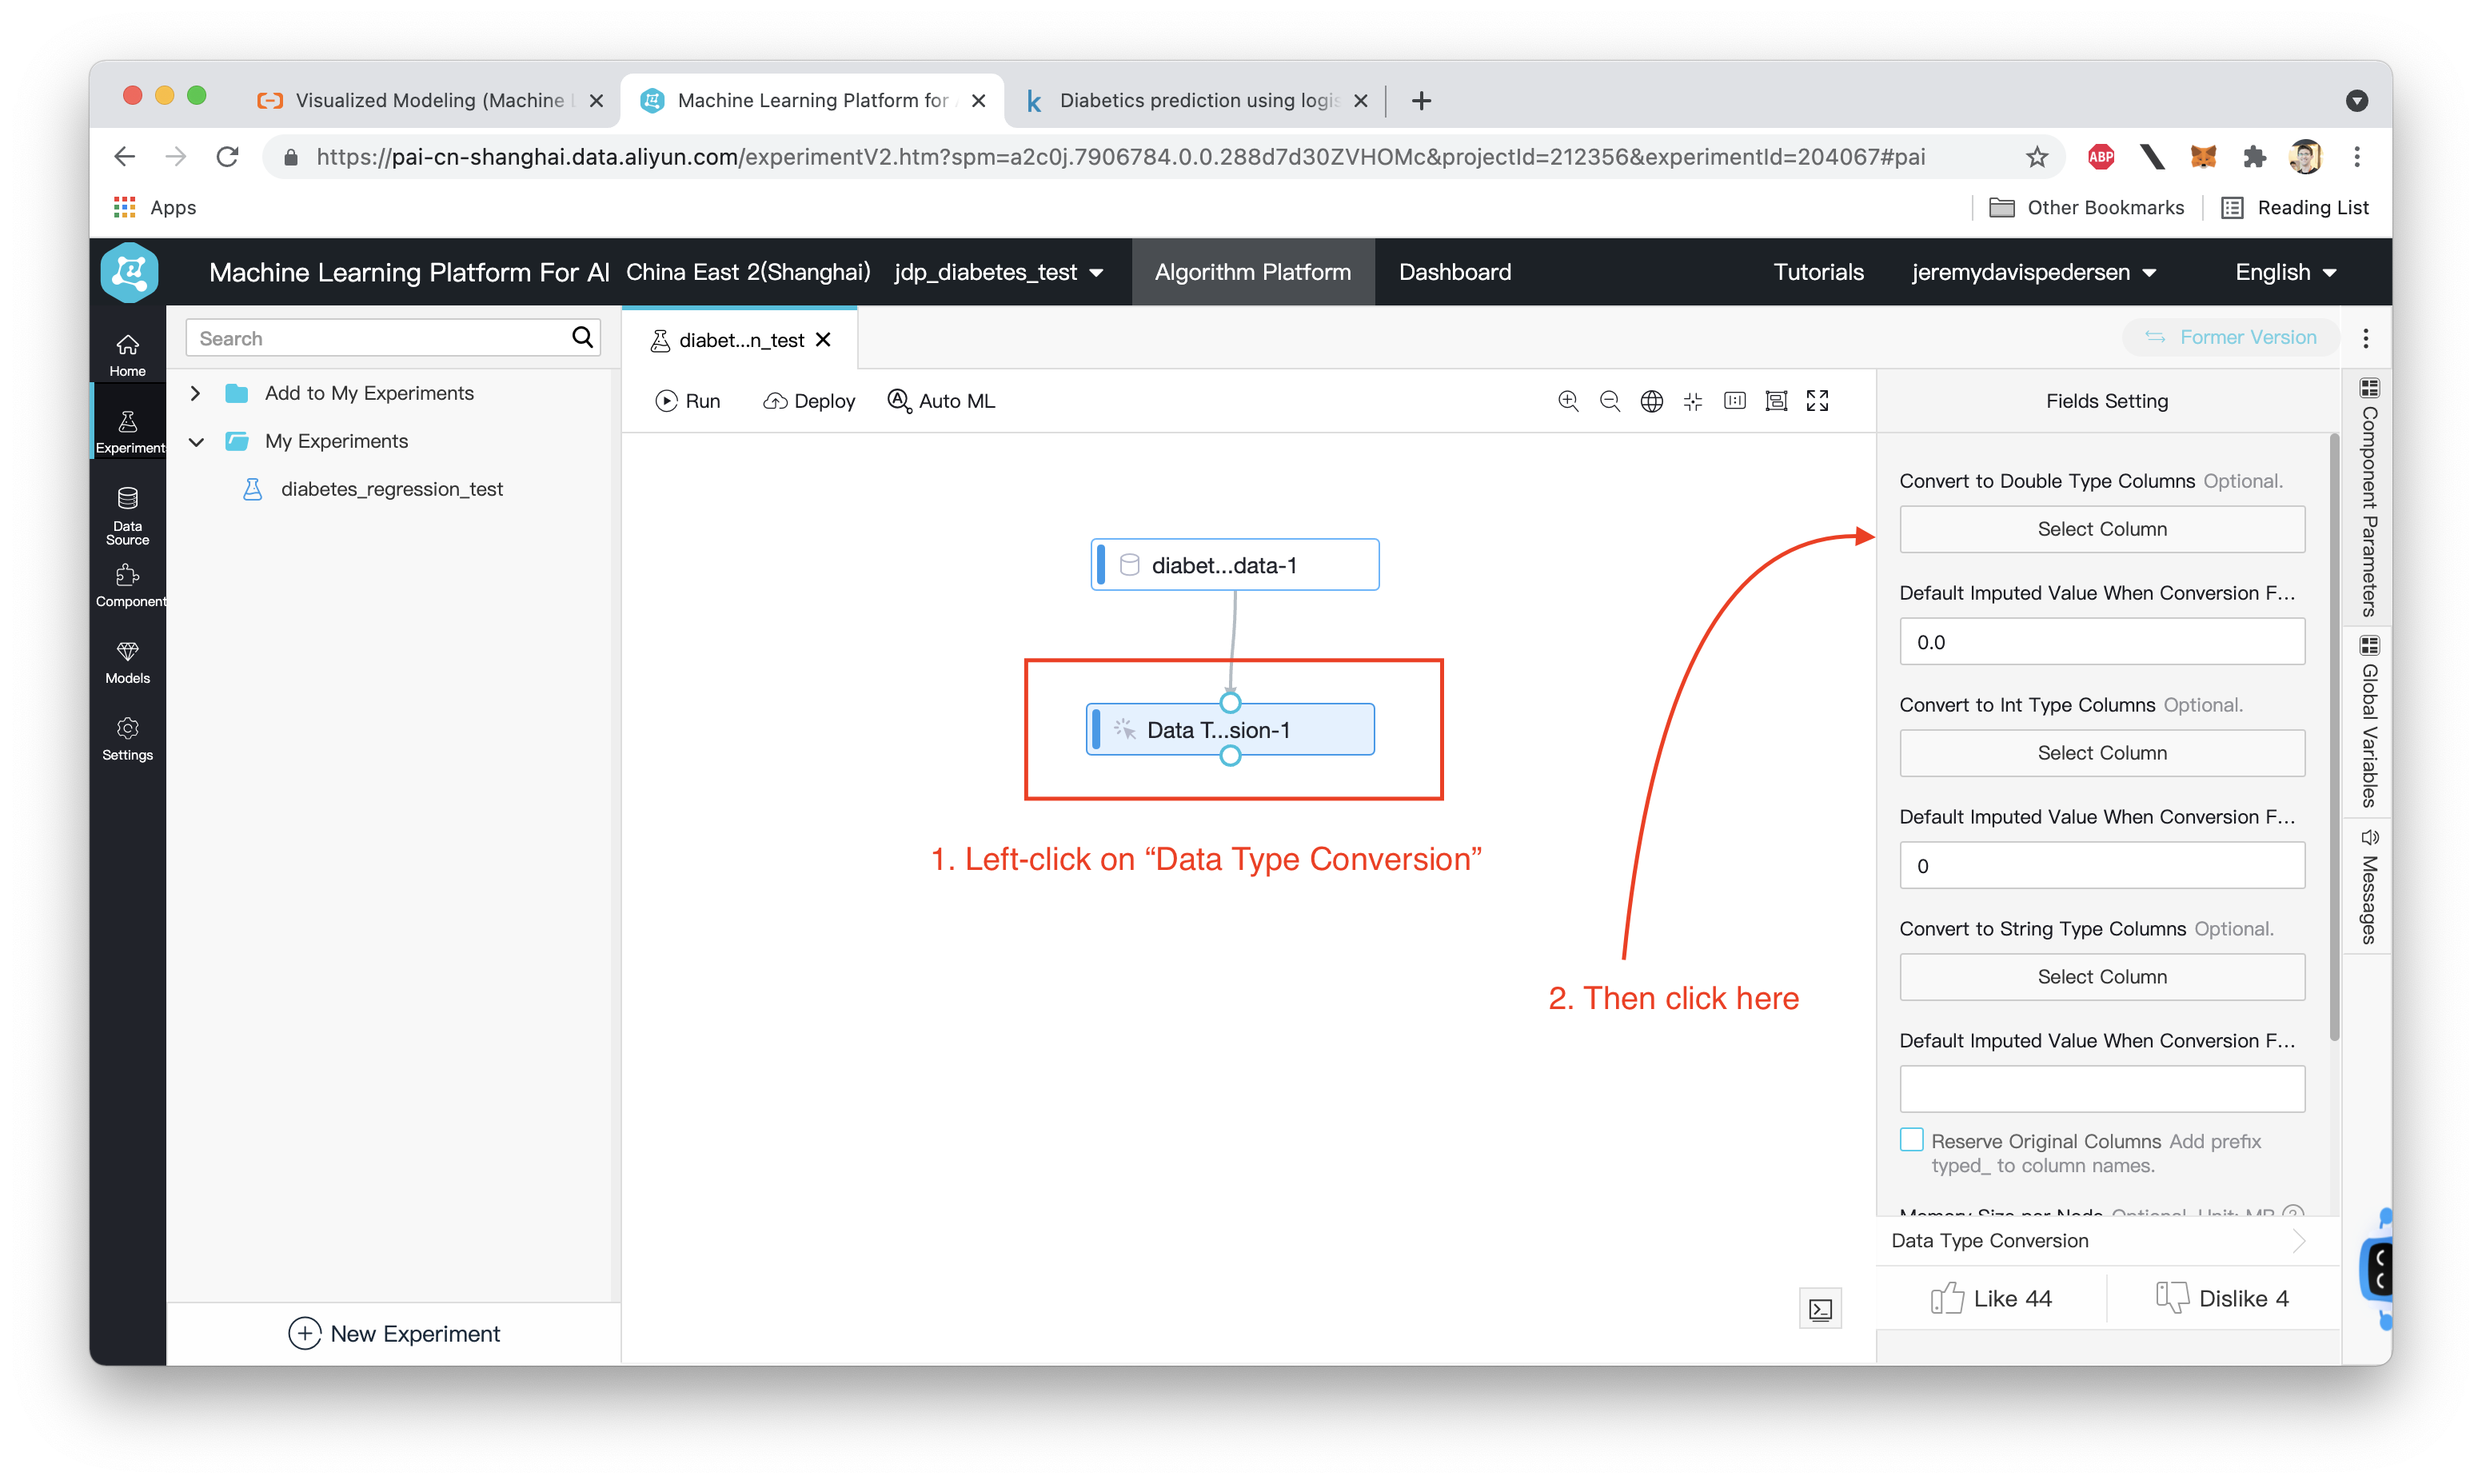
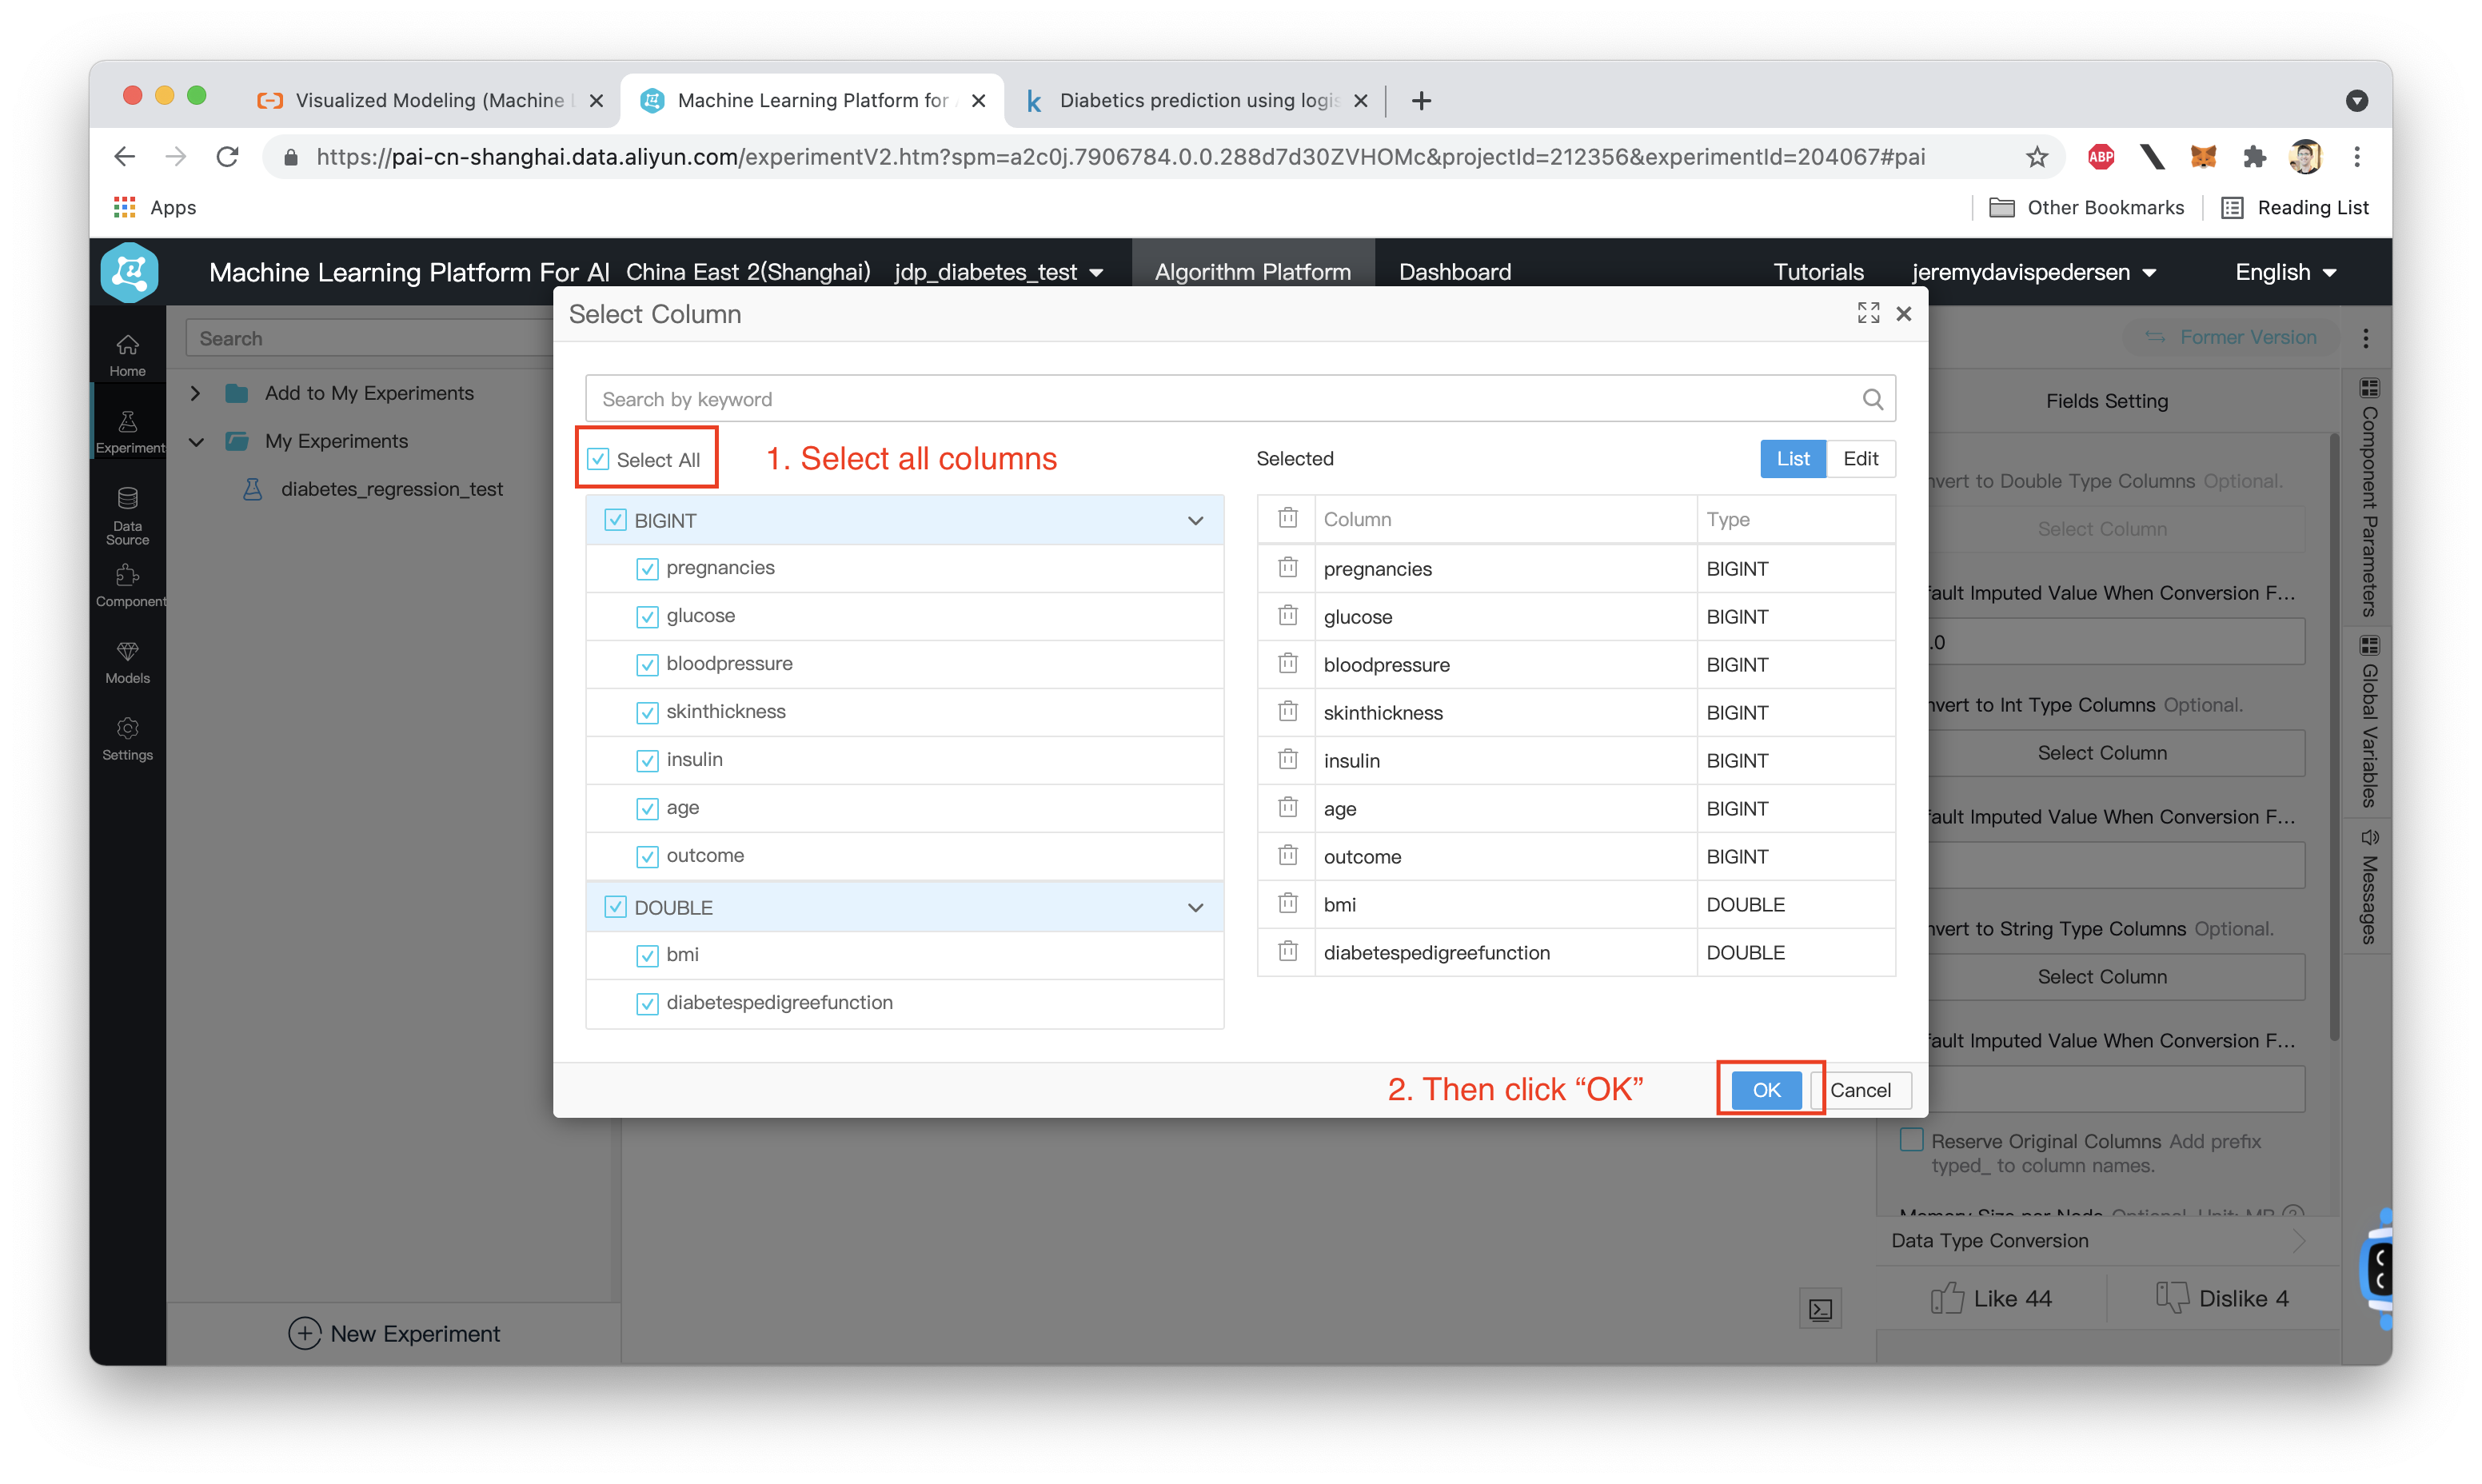
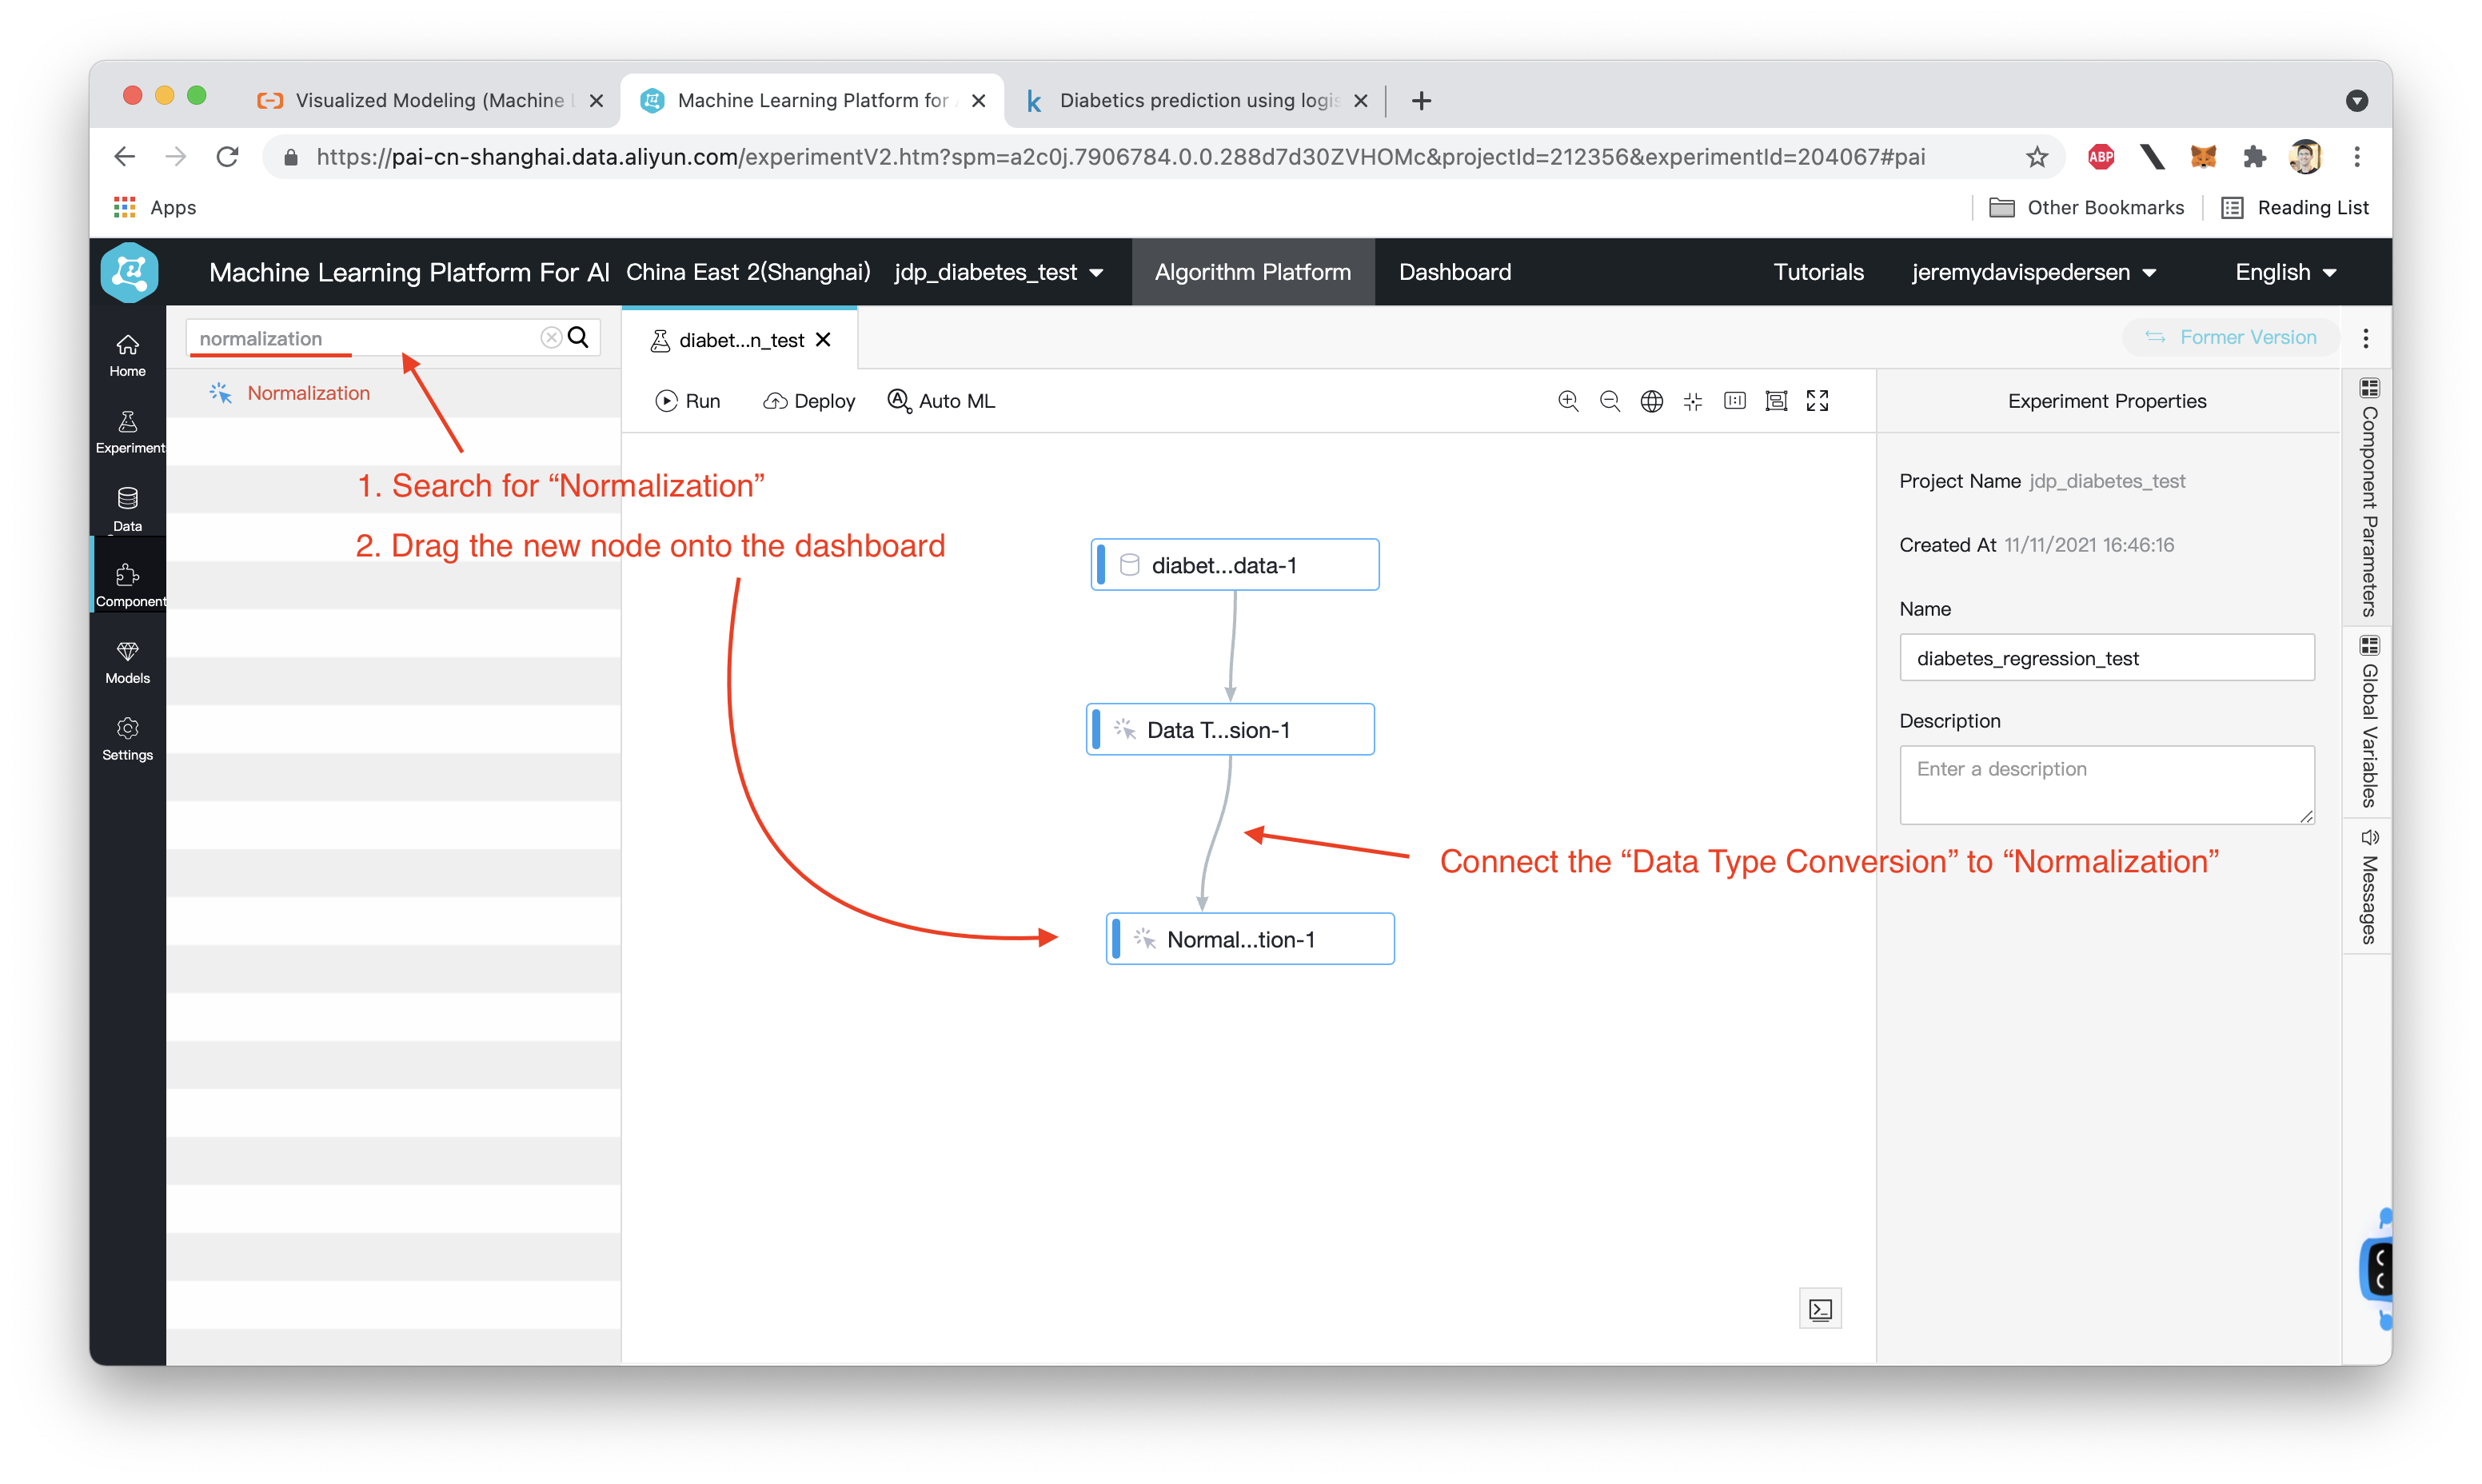
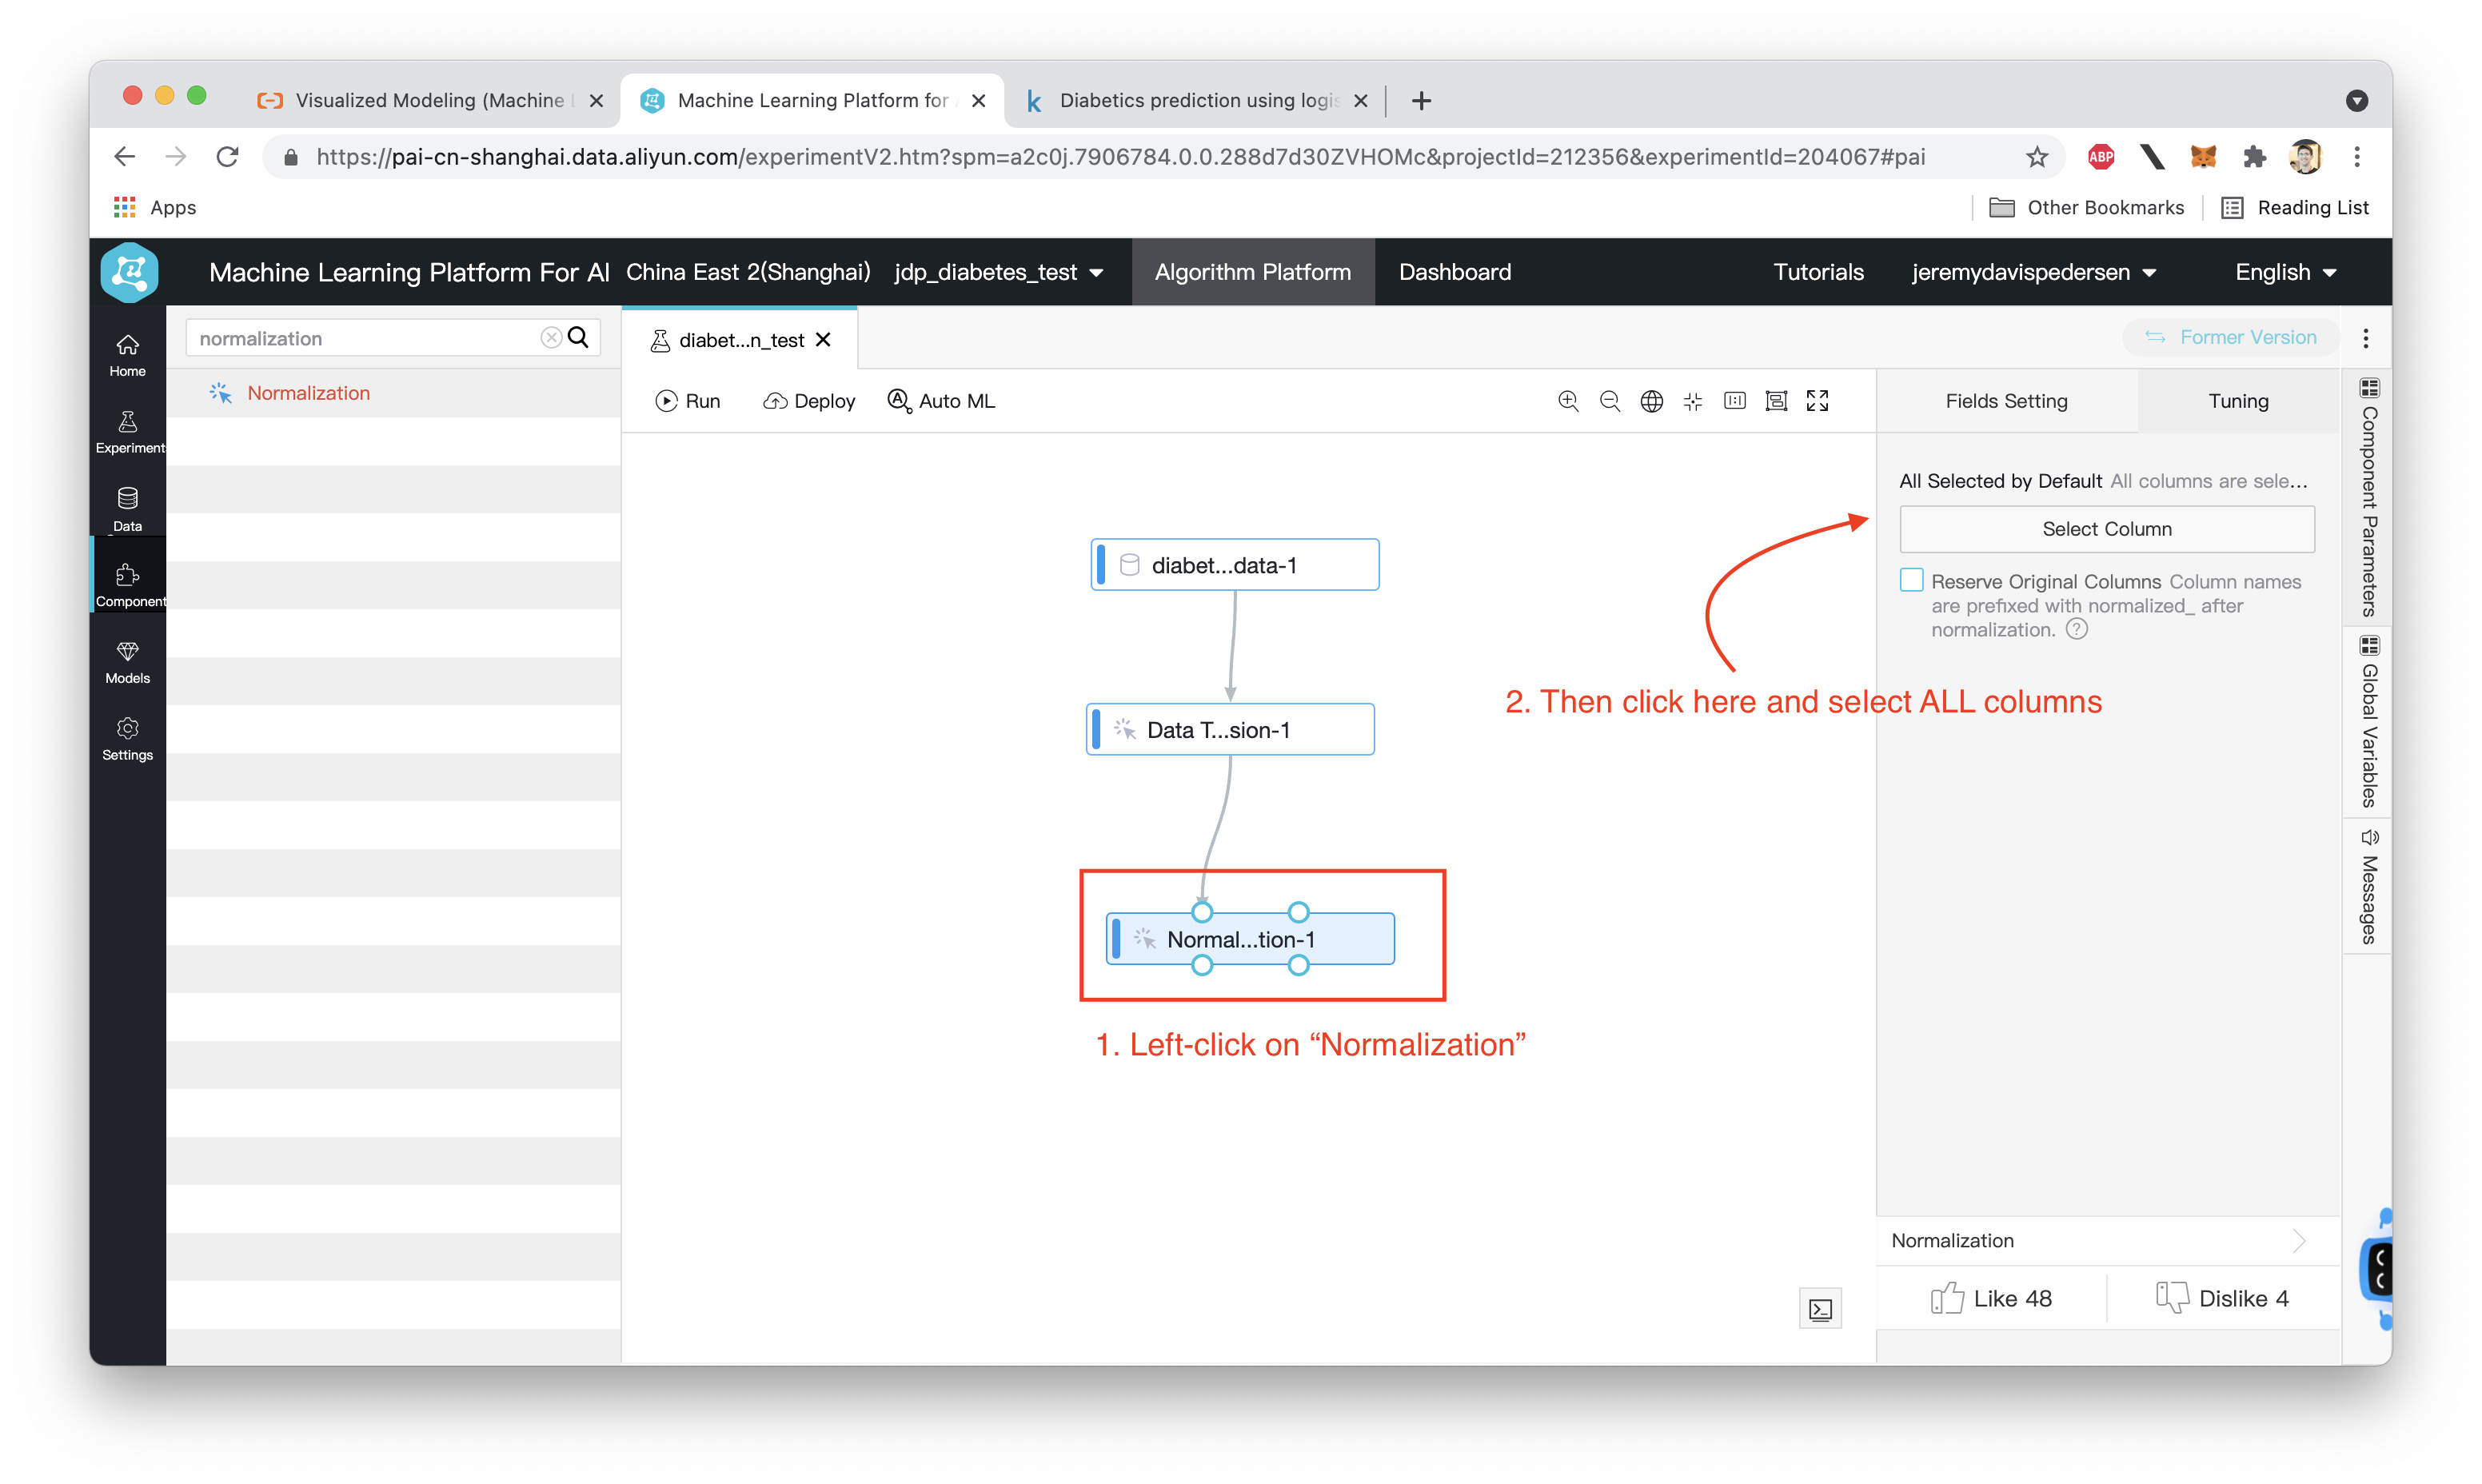
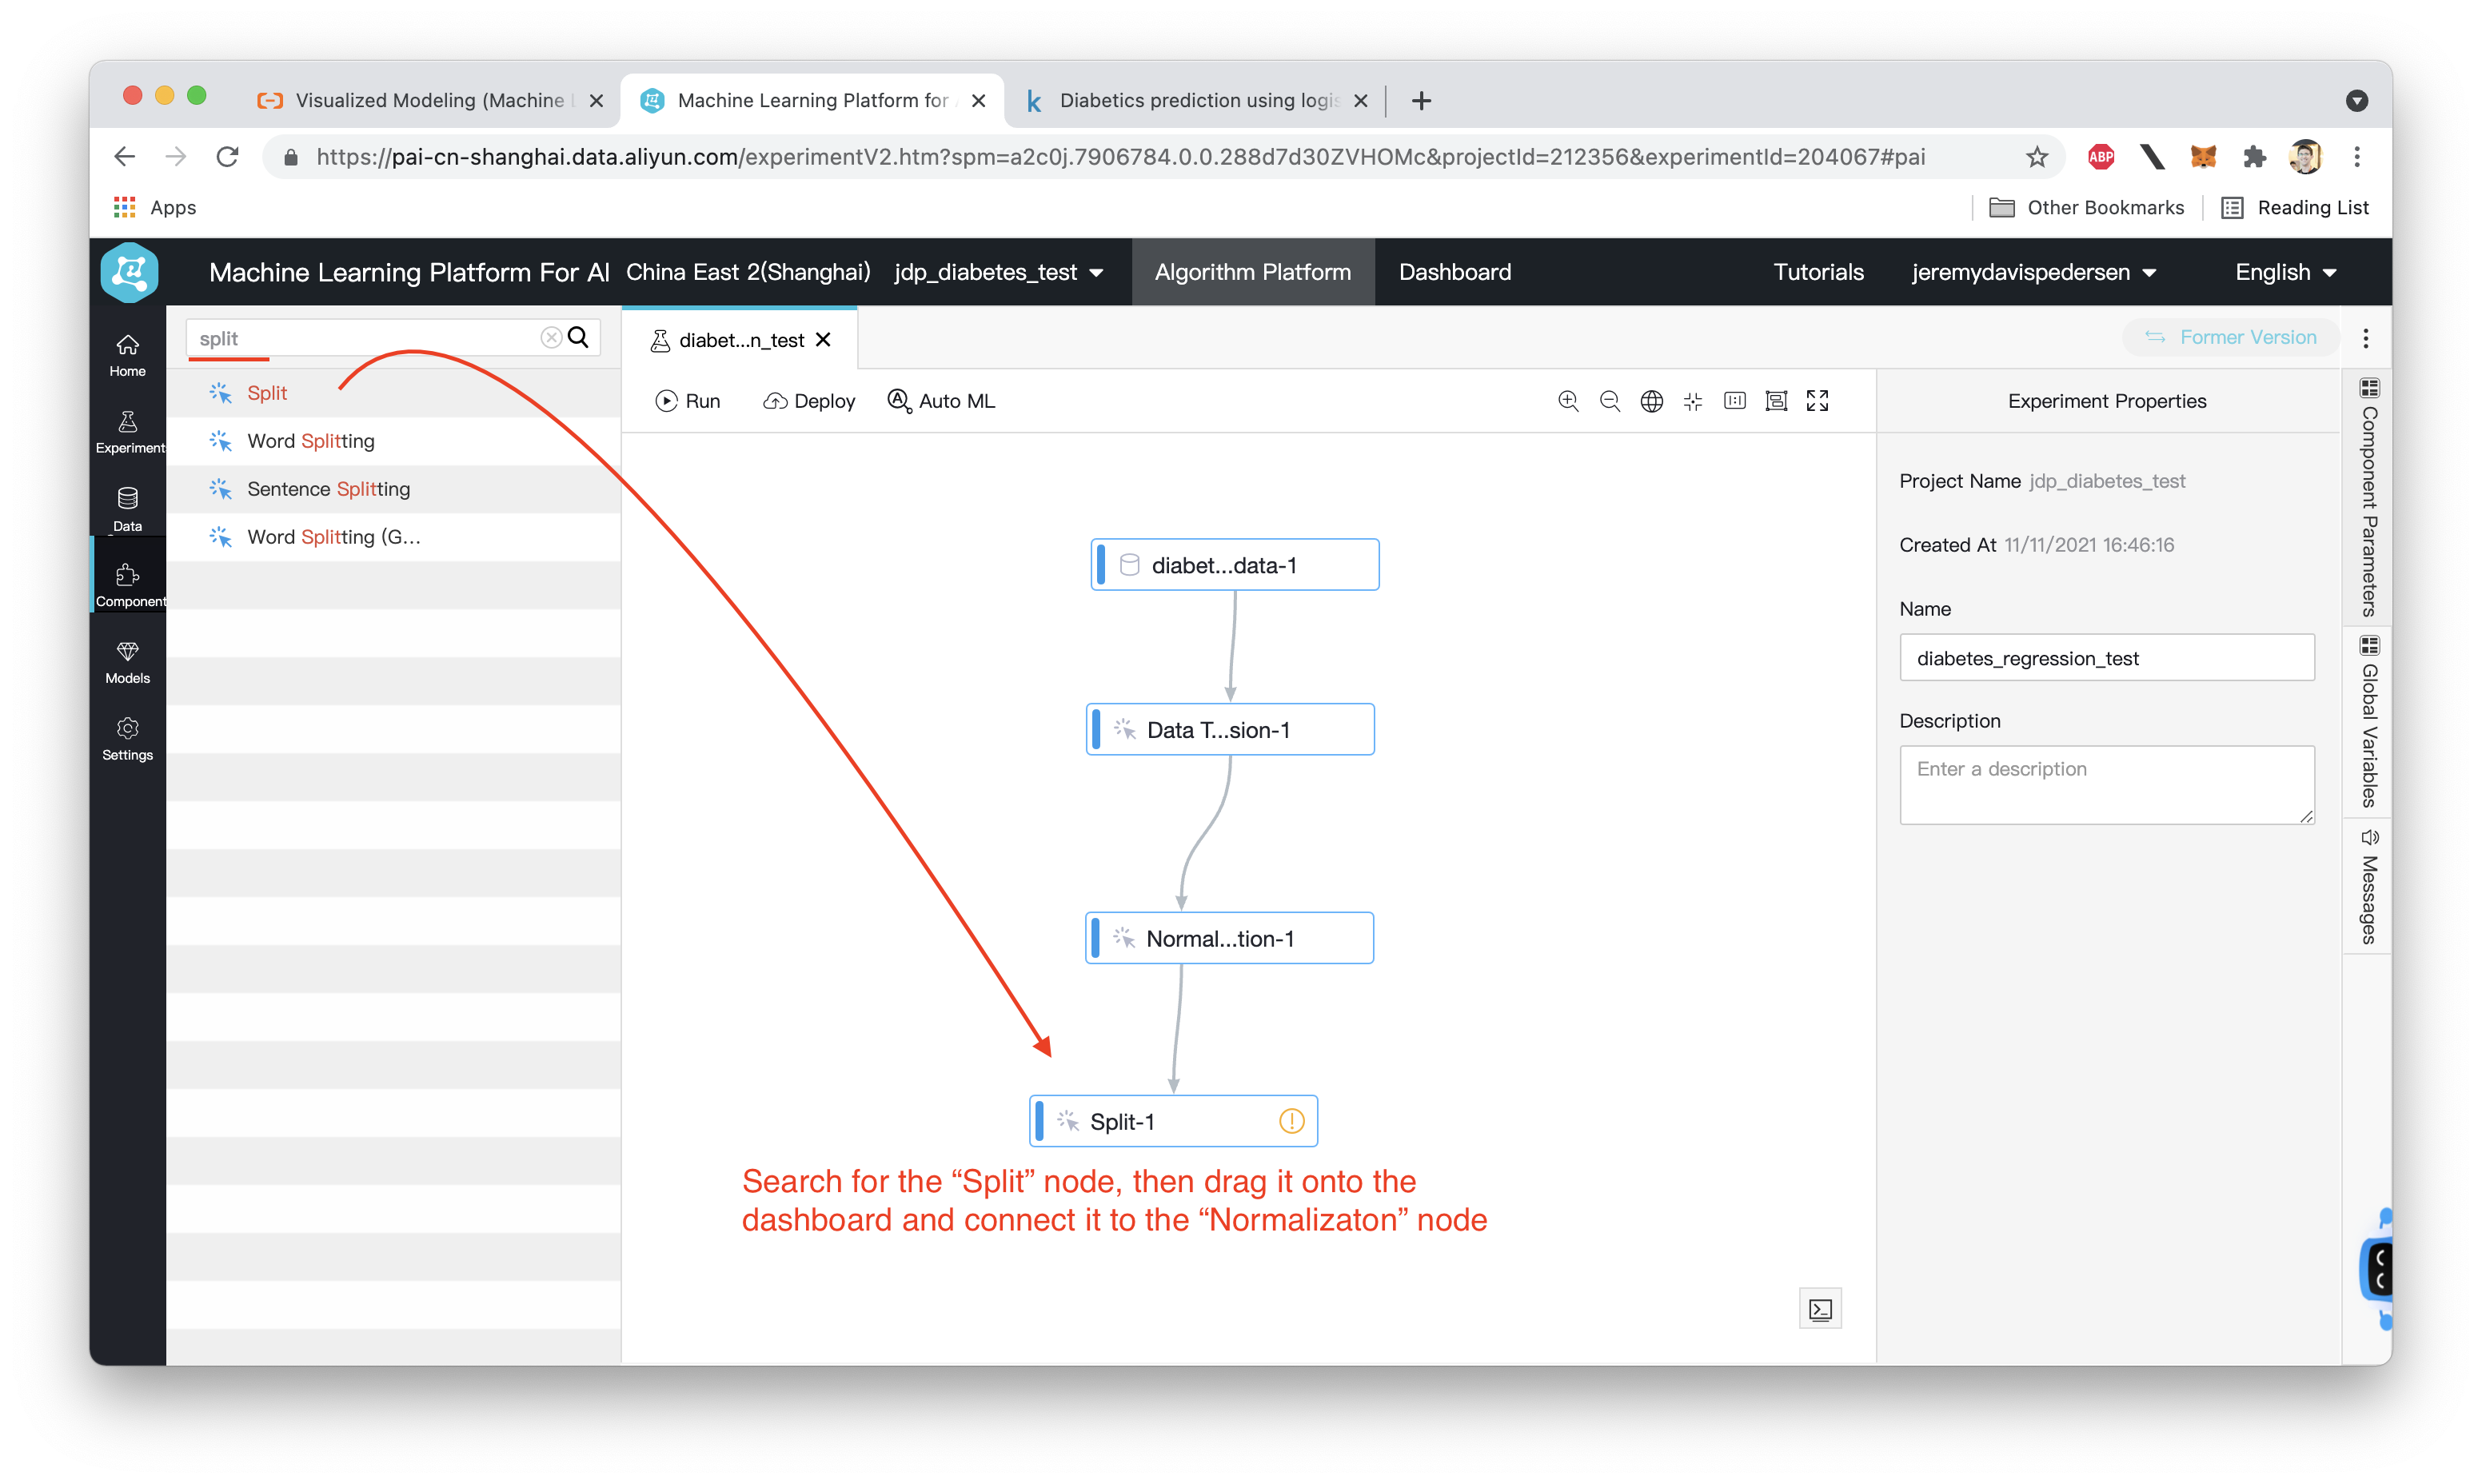
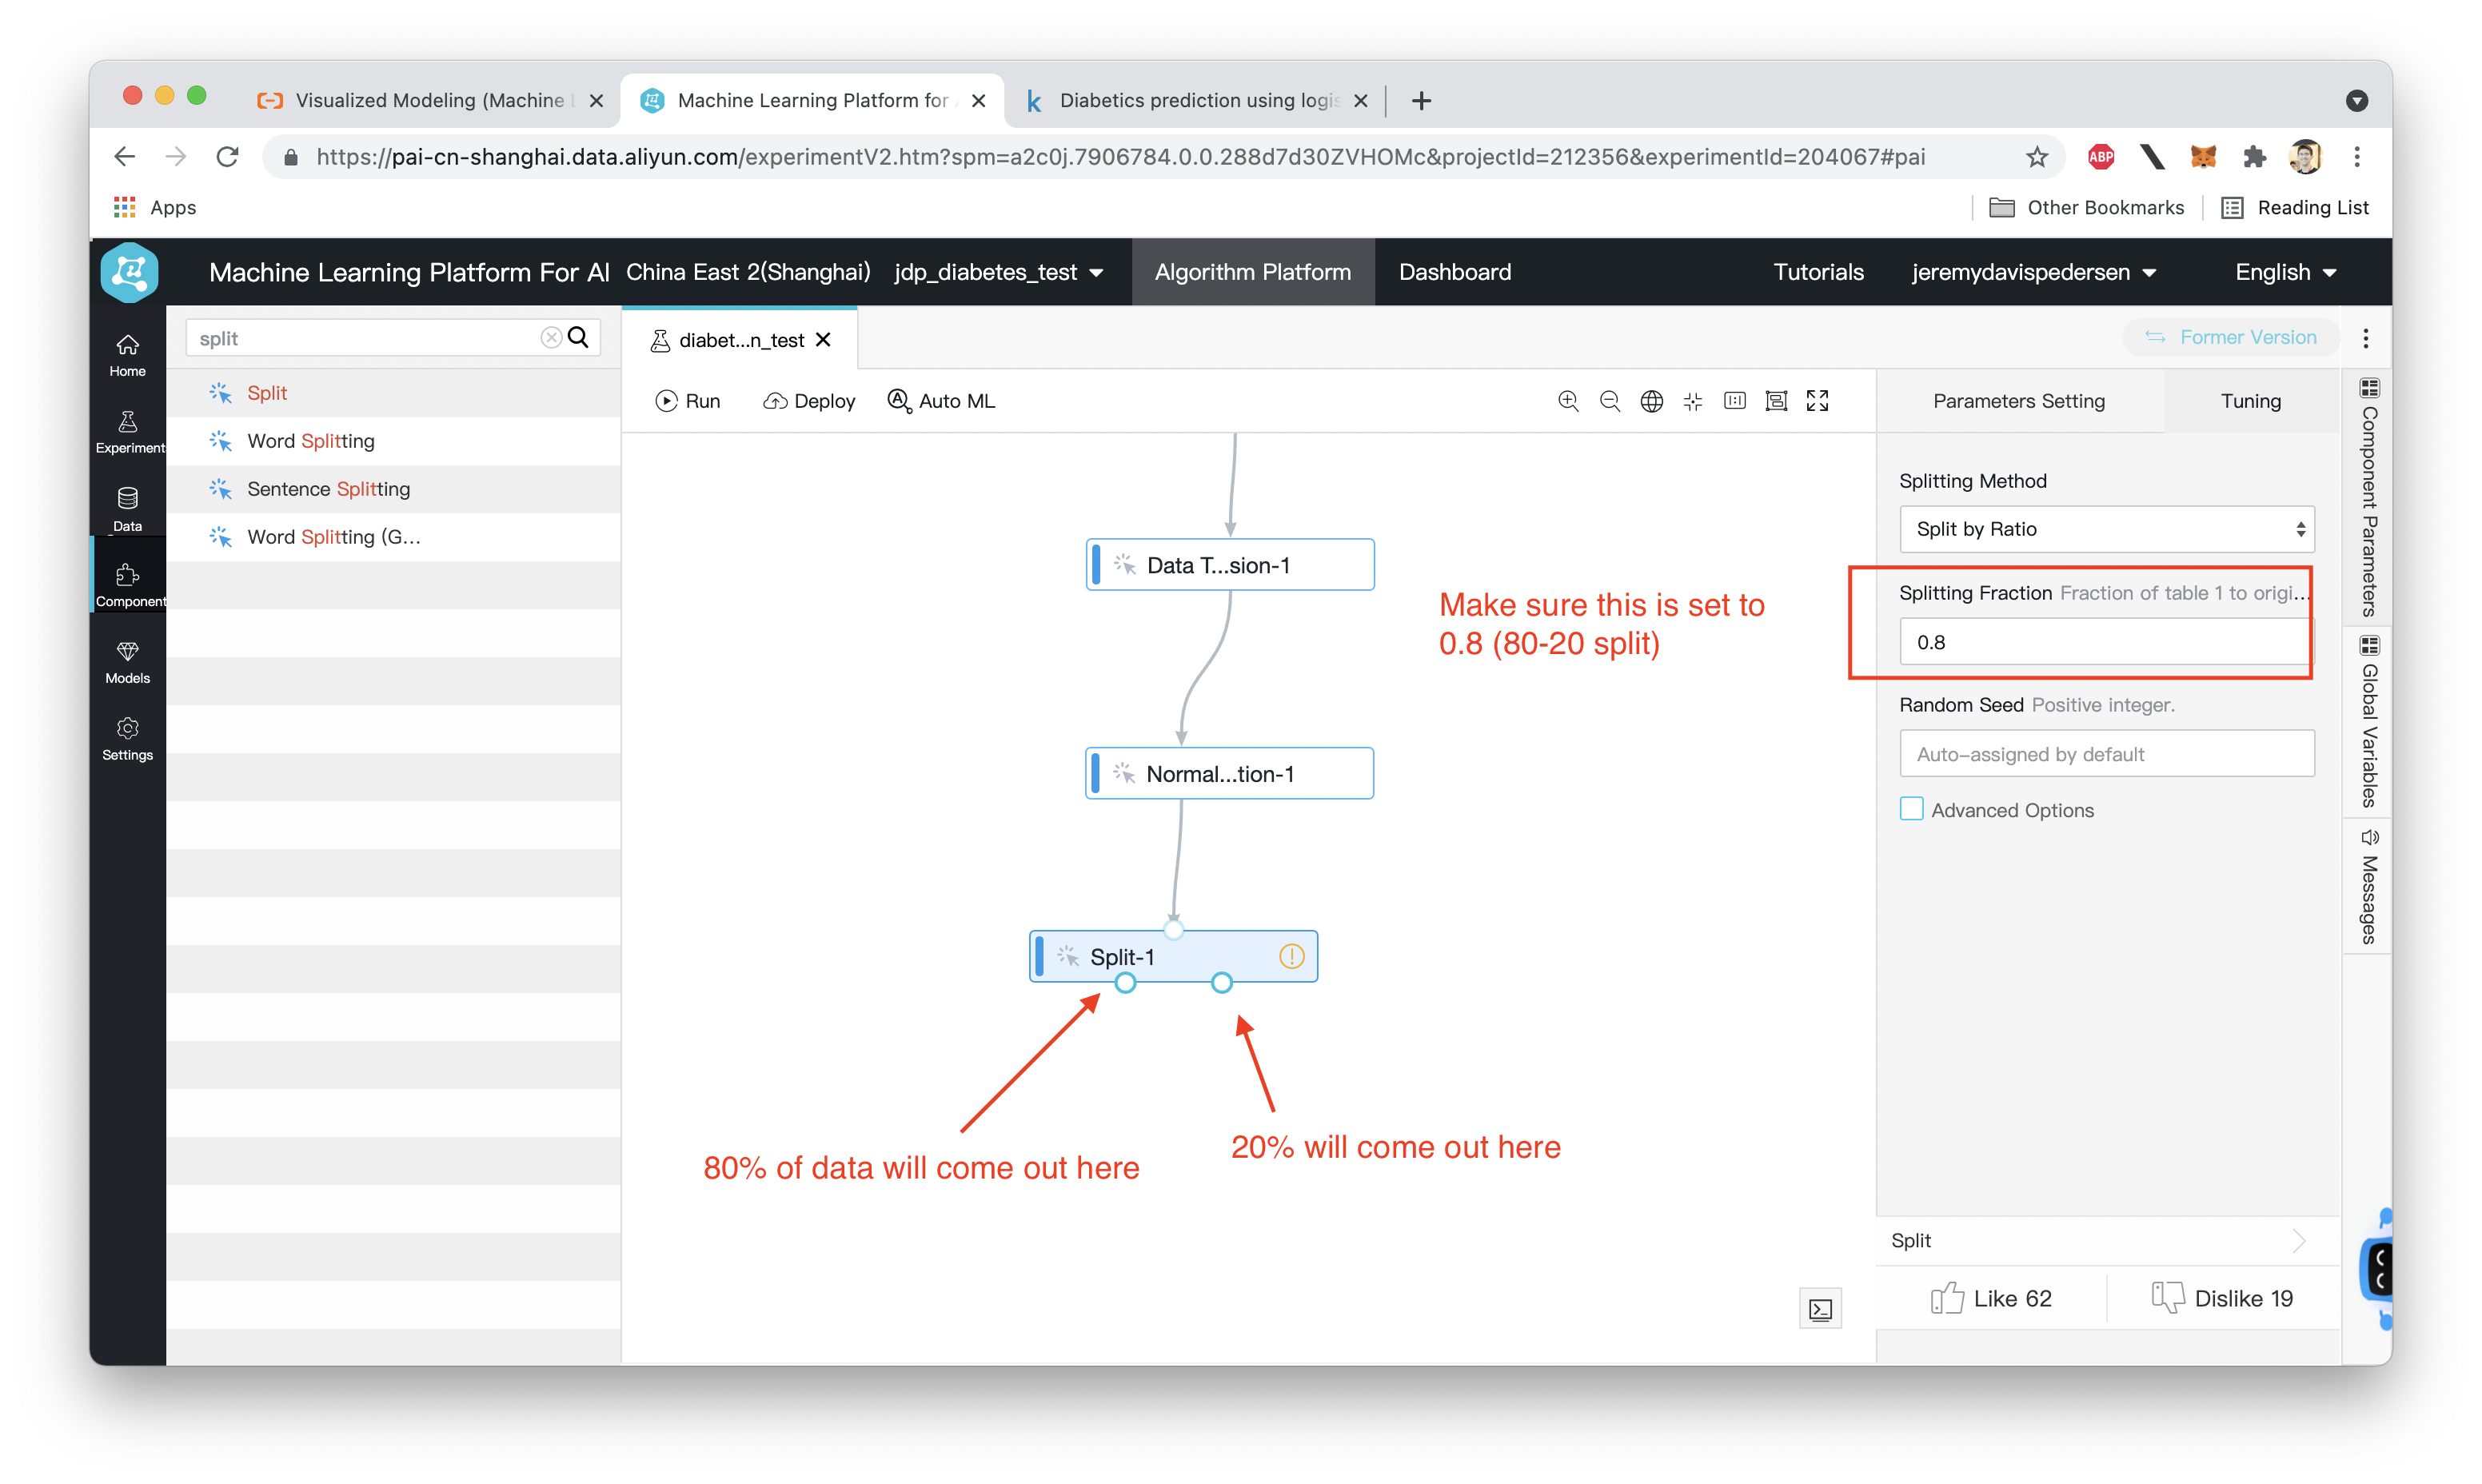
We can now run the workflow to make sure all these nodes are configured correctly:
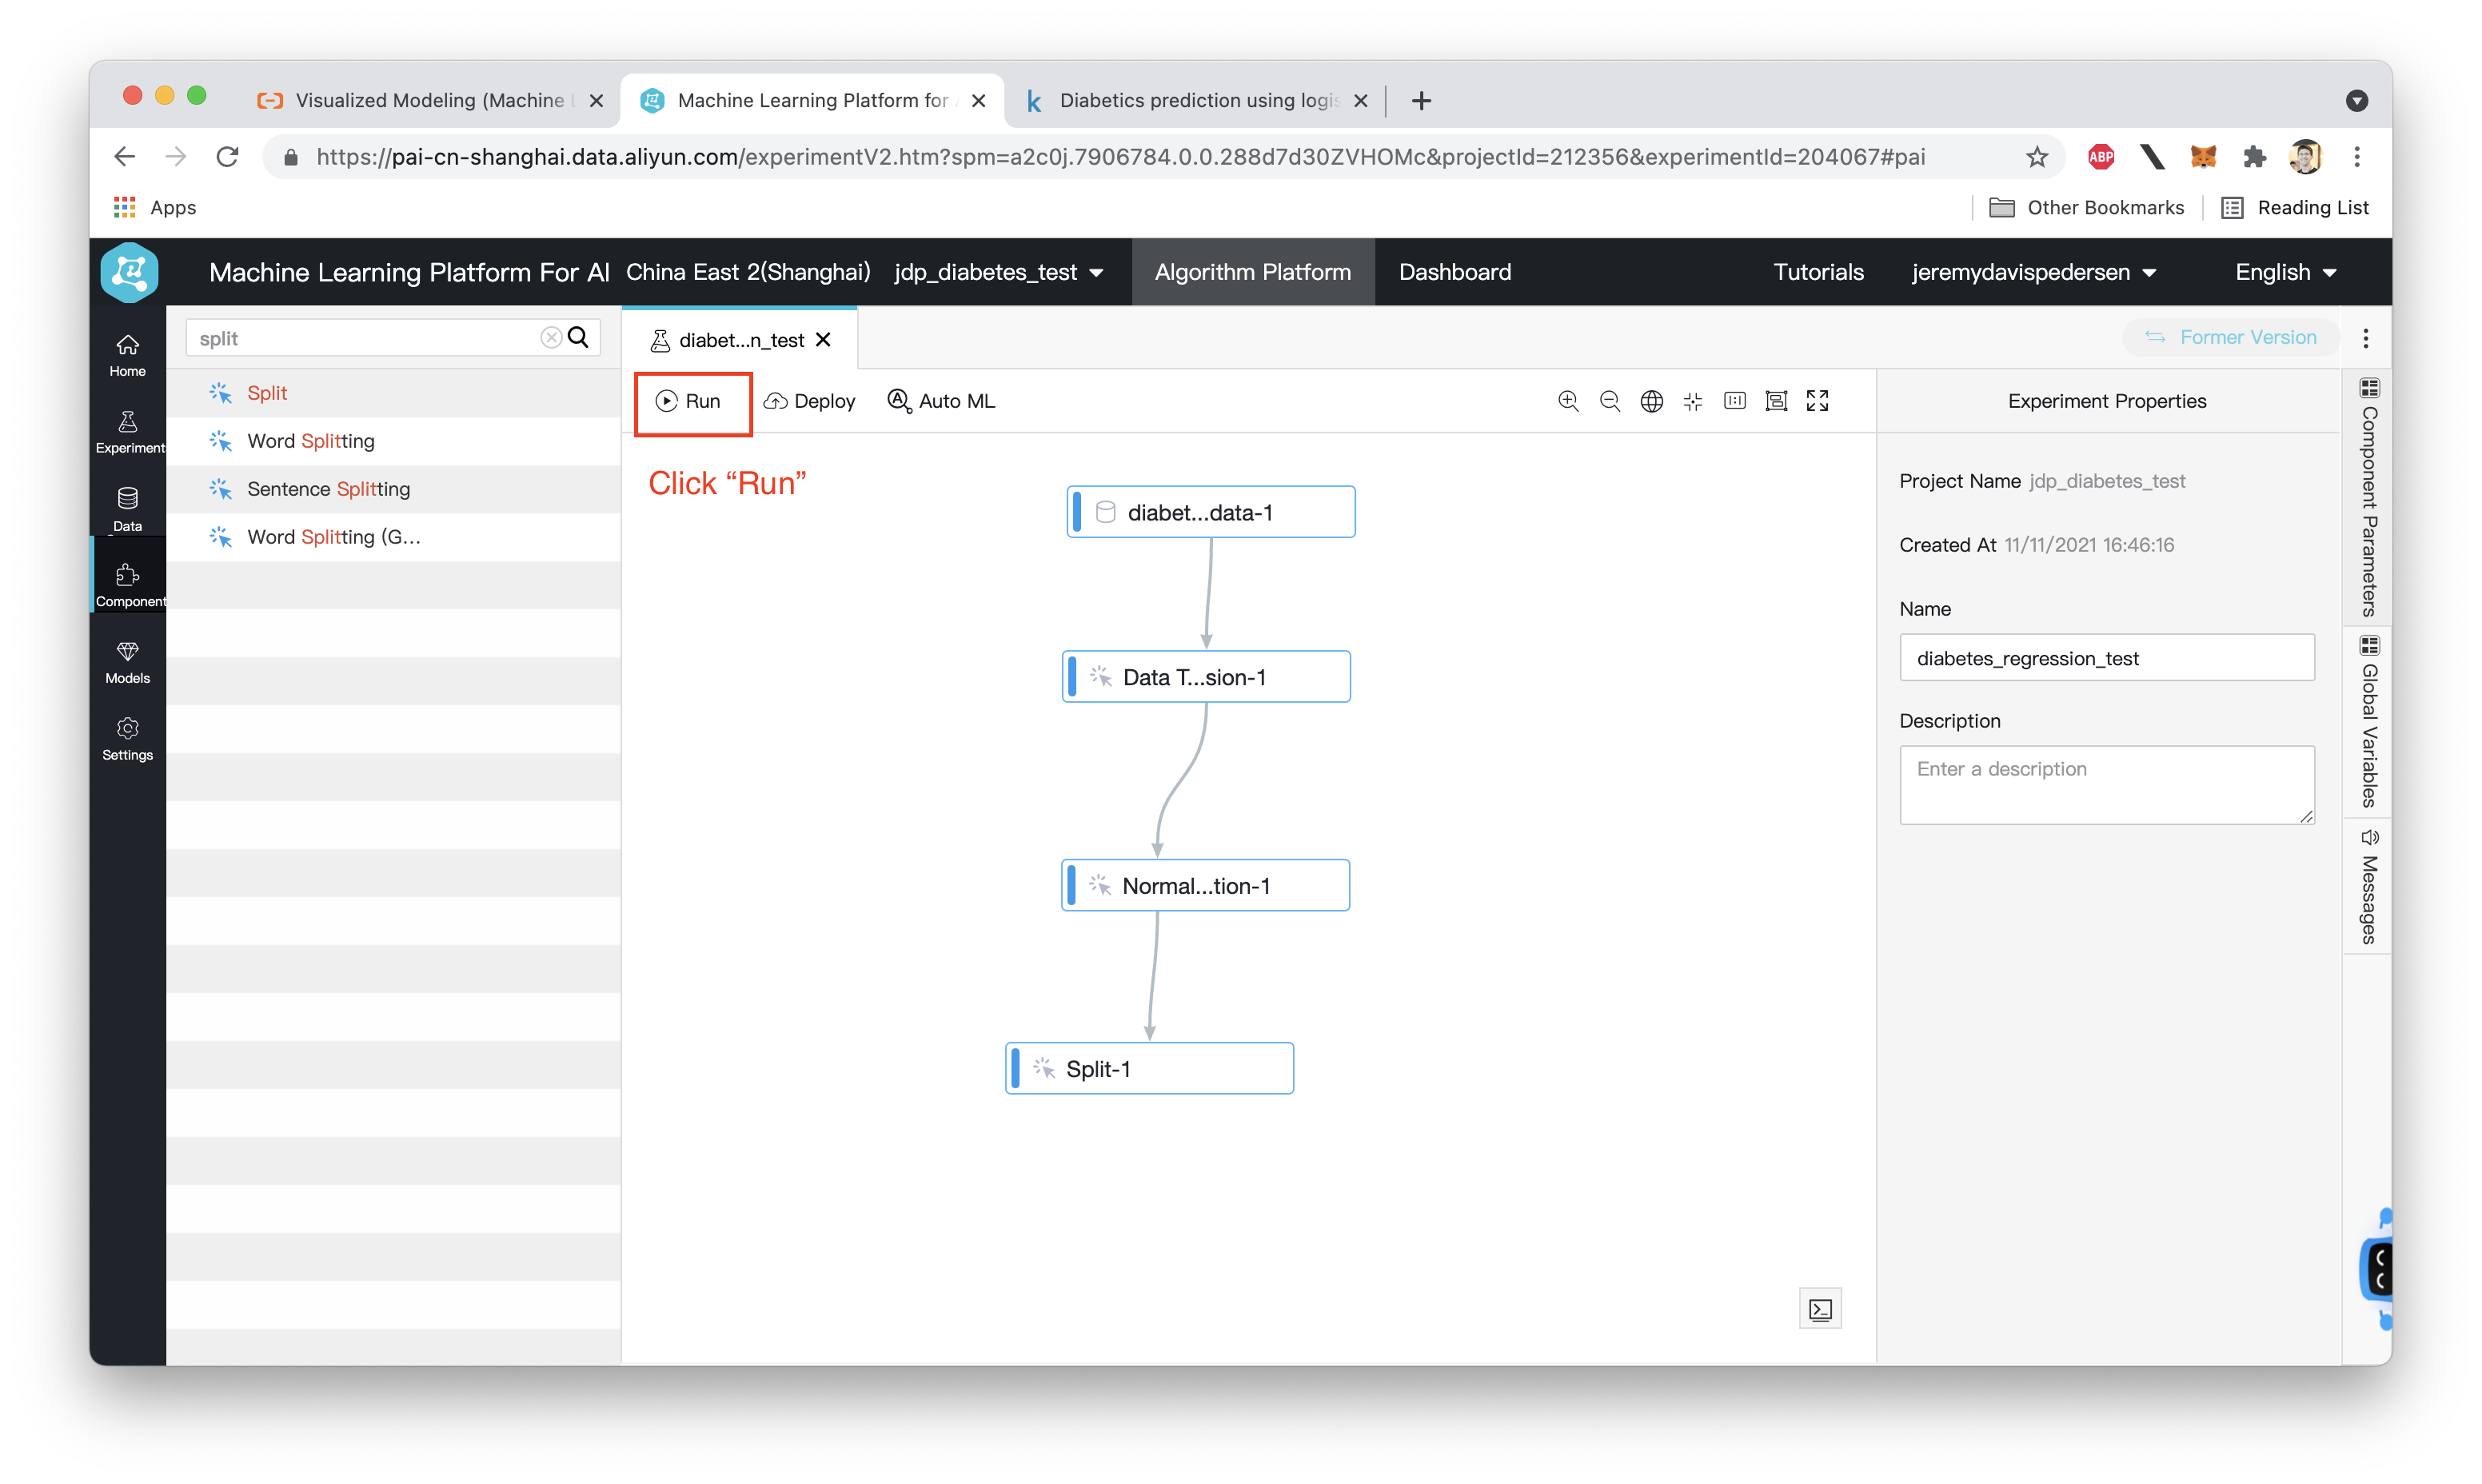
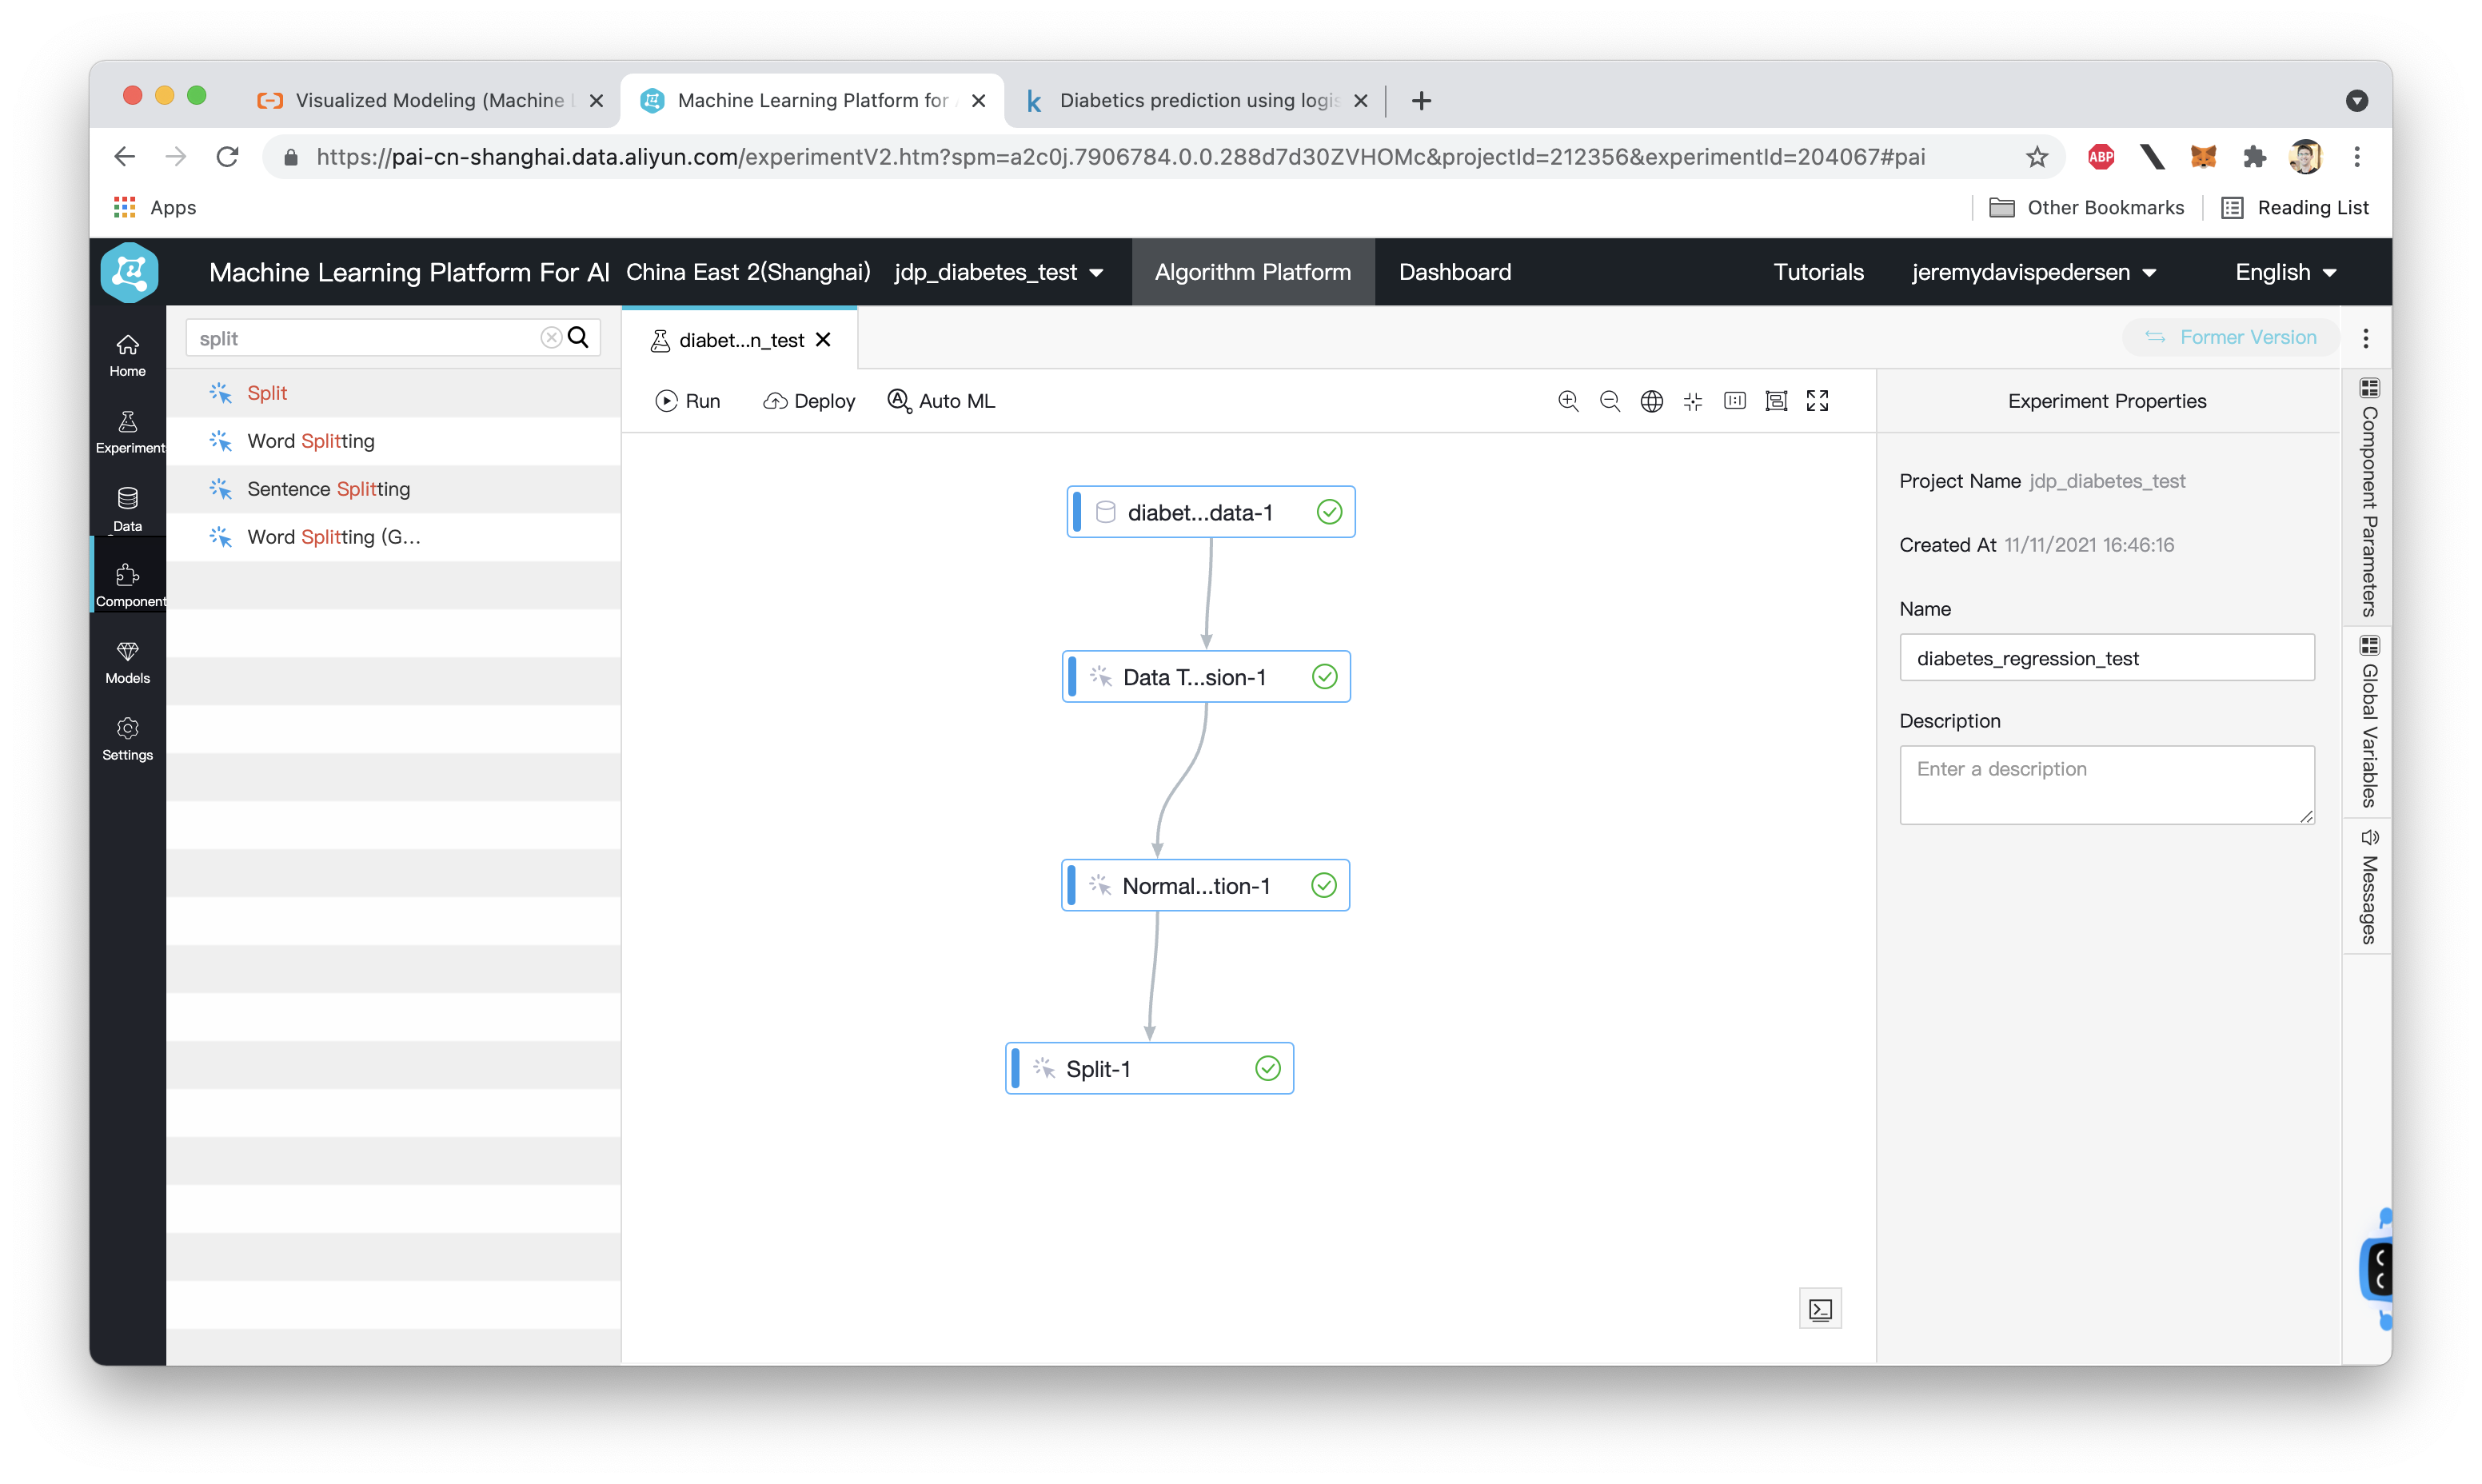
Great! If a green "check" mark appears next to all four nodes, then everything has run successfully. If one of your nodes fails (a red "x" will appear next to it), left click on the node and double check its settings (or right click and choose View Log to take a look at the logs and see if you can figure out what went wrong from there).
Now, we can start setting up our model. We're going to use a built-in "Logistic Regression" model that's already part of PAI Studio.
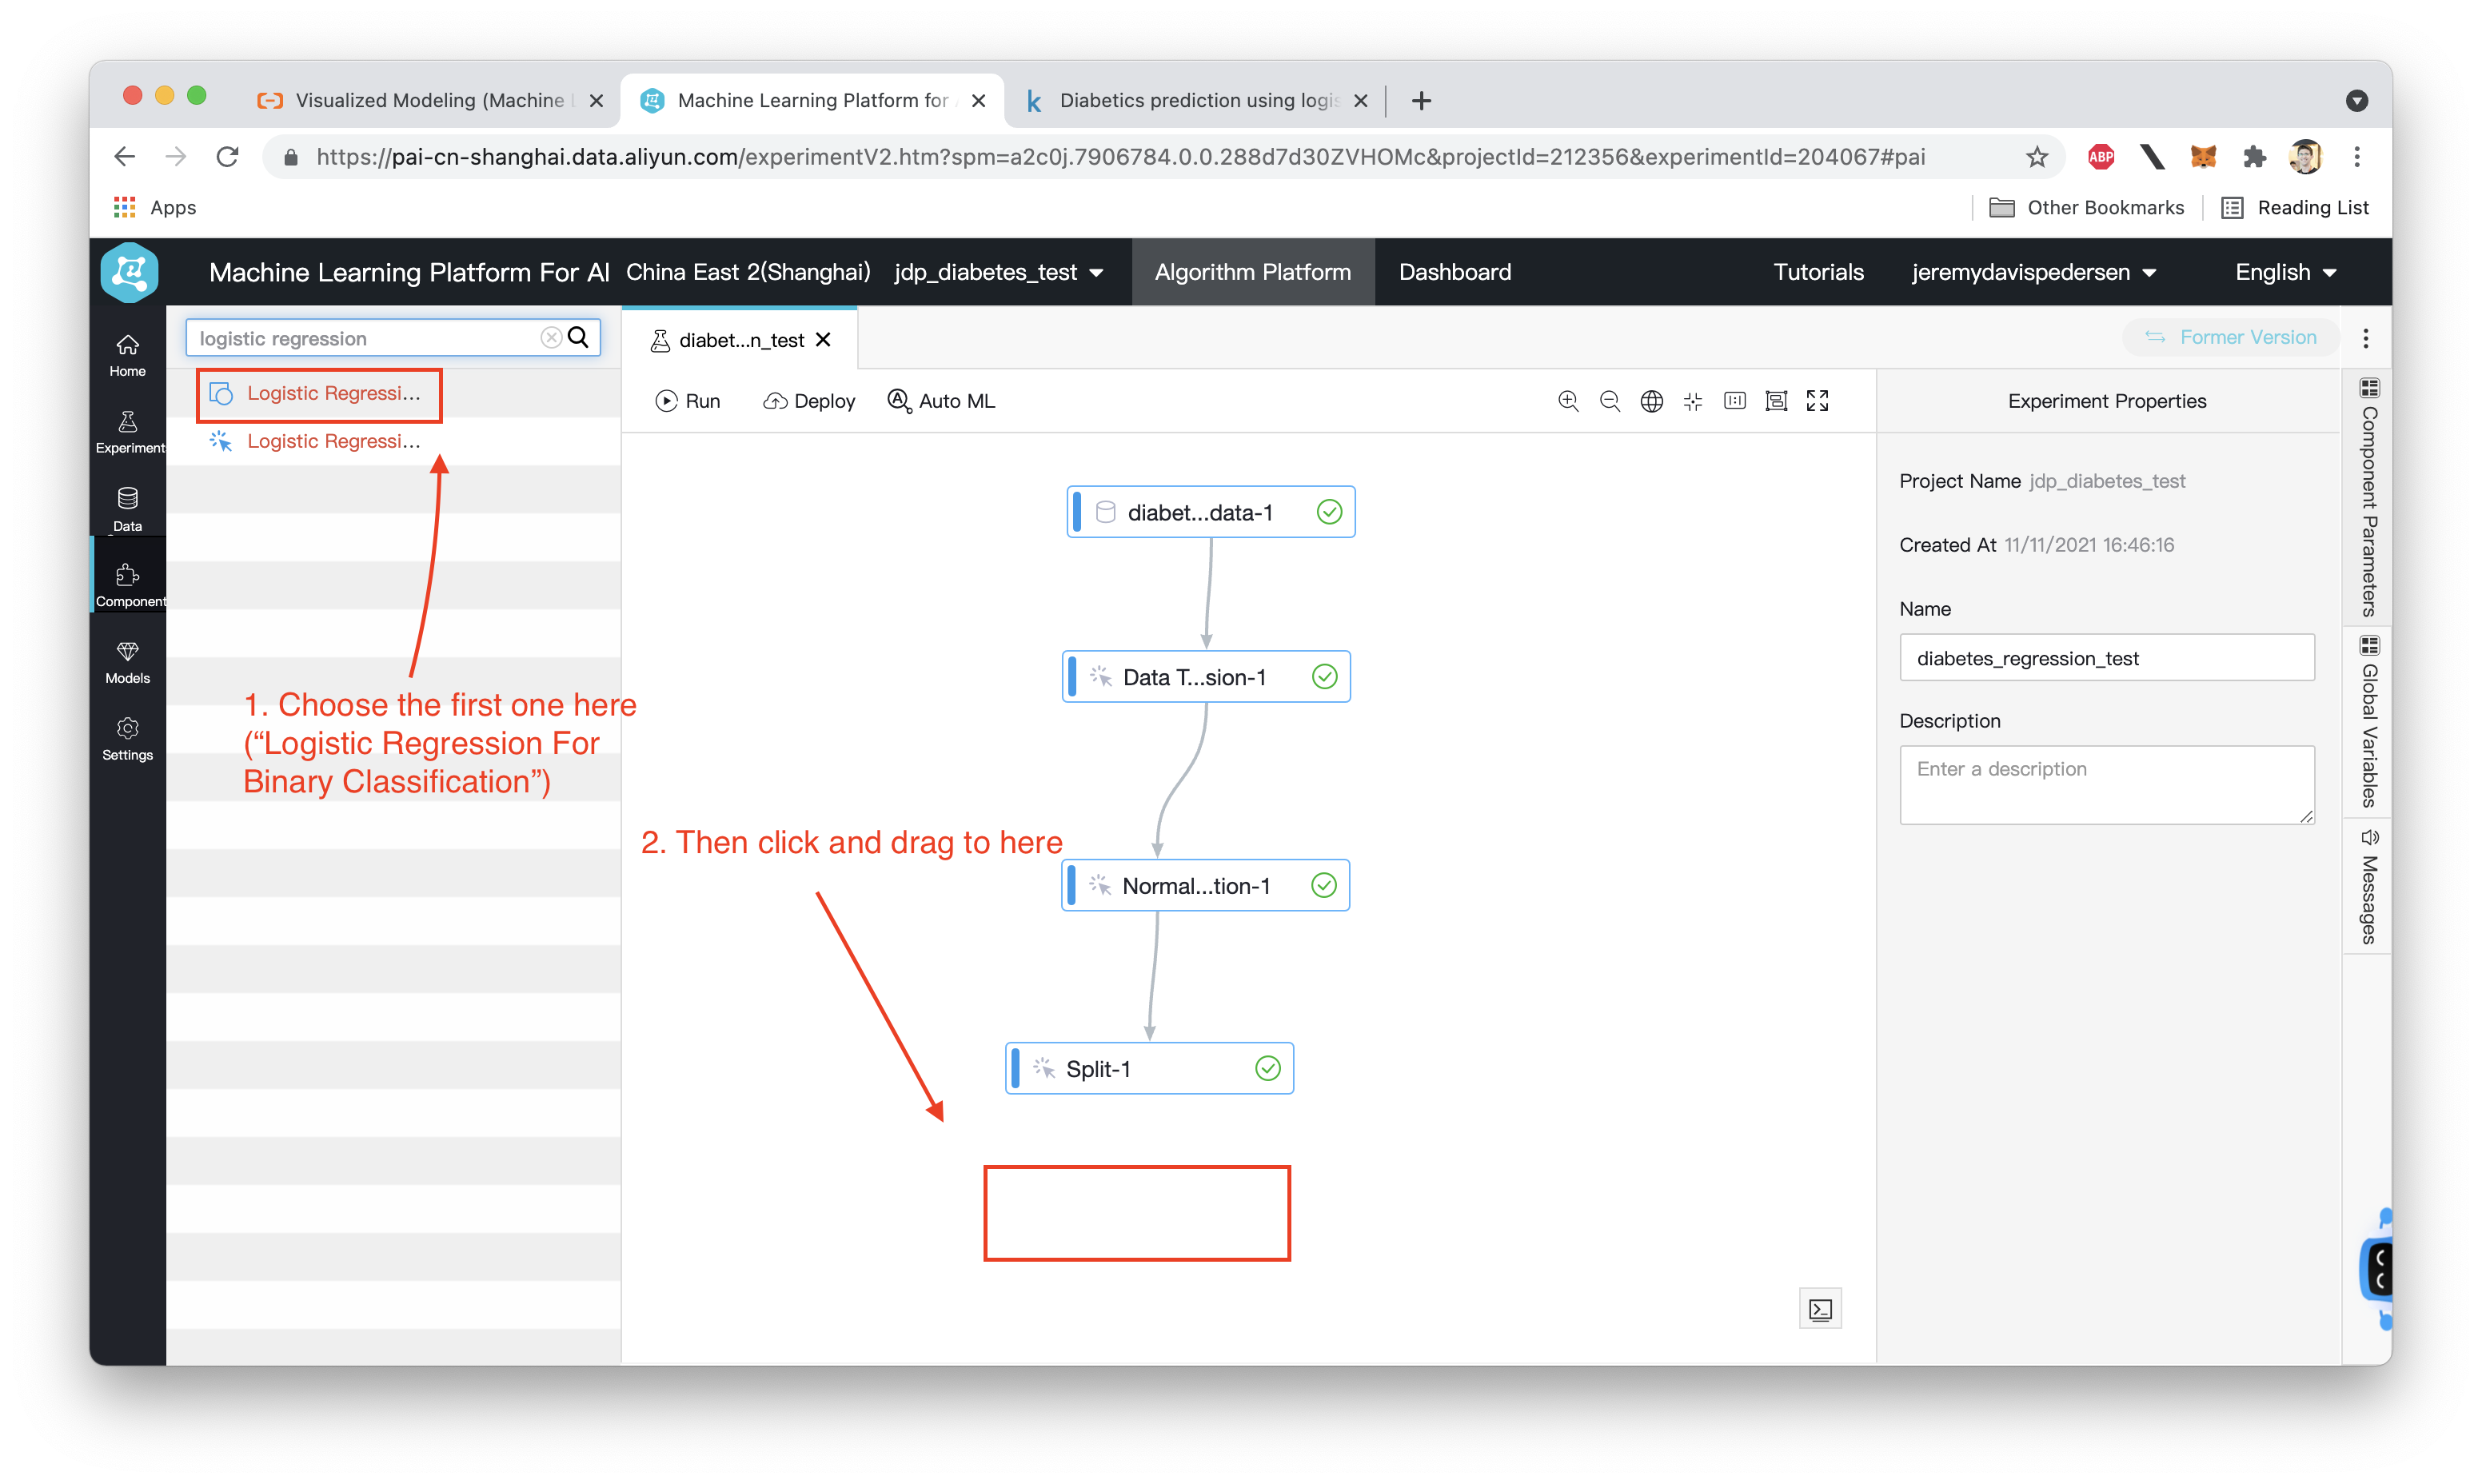
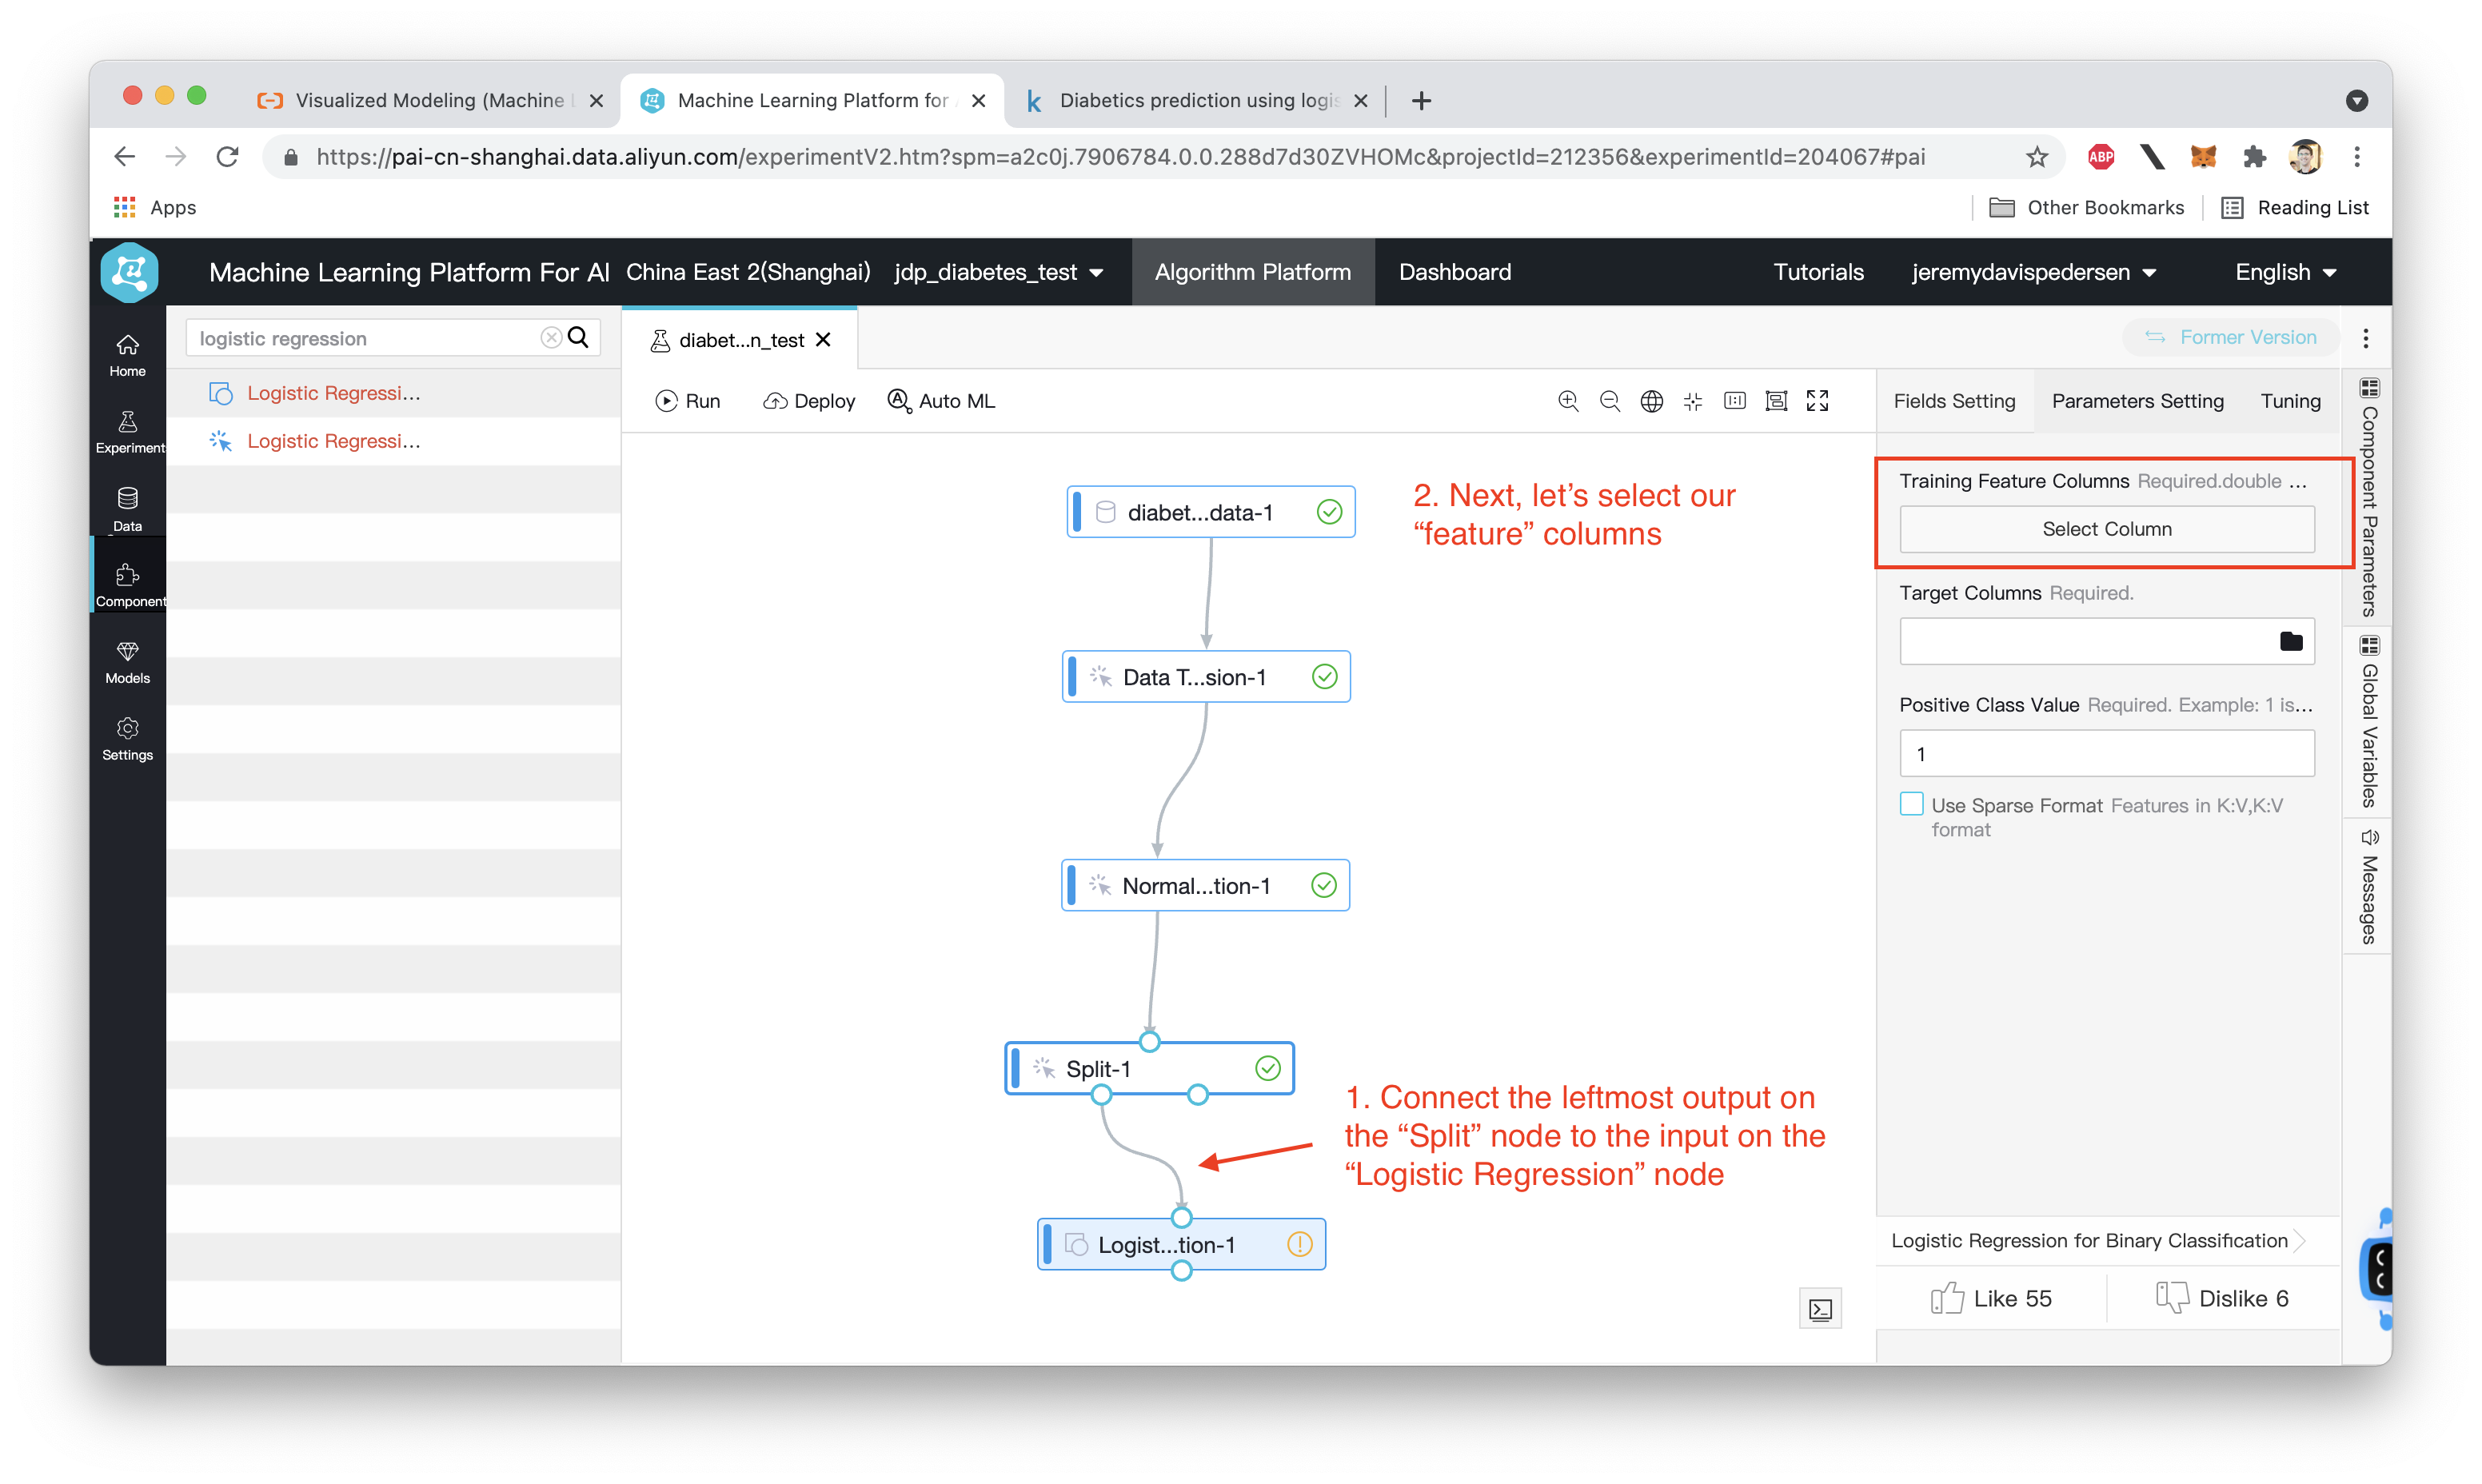
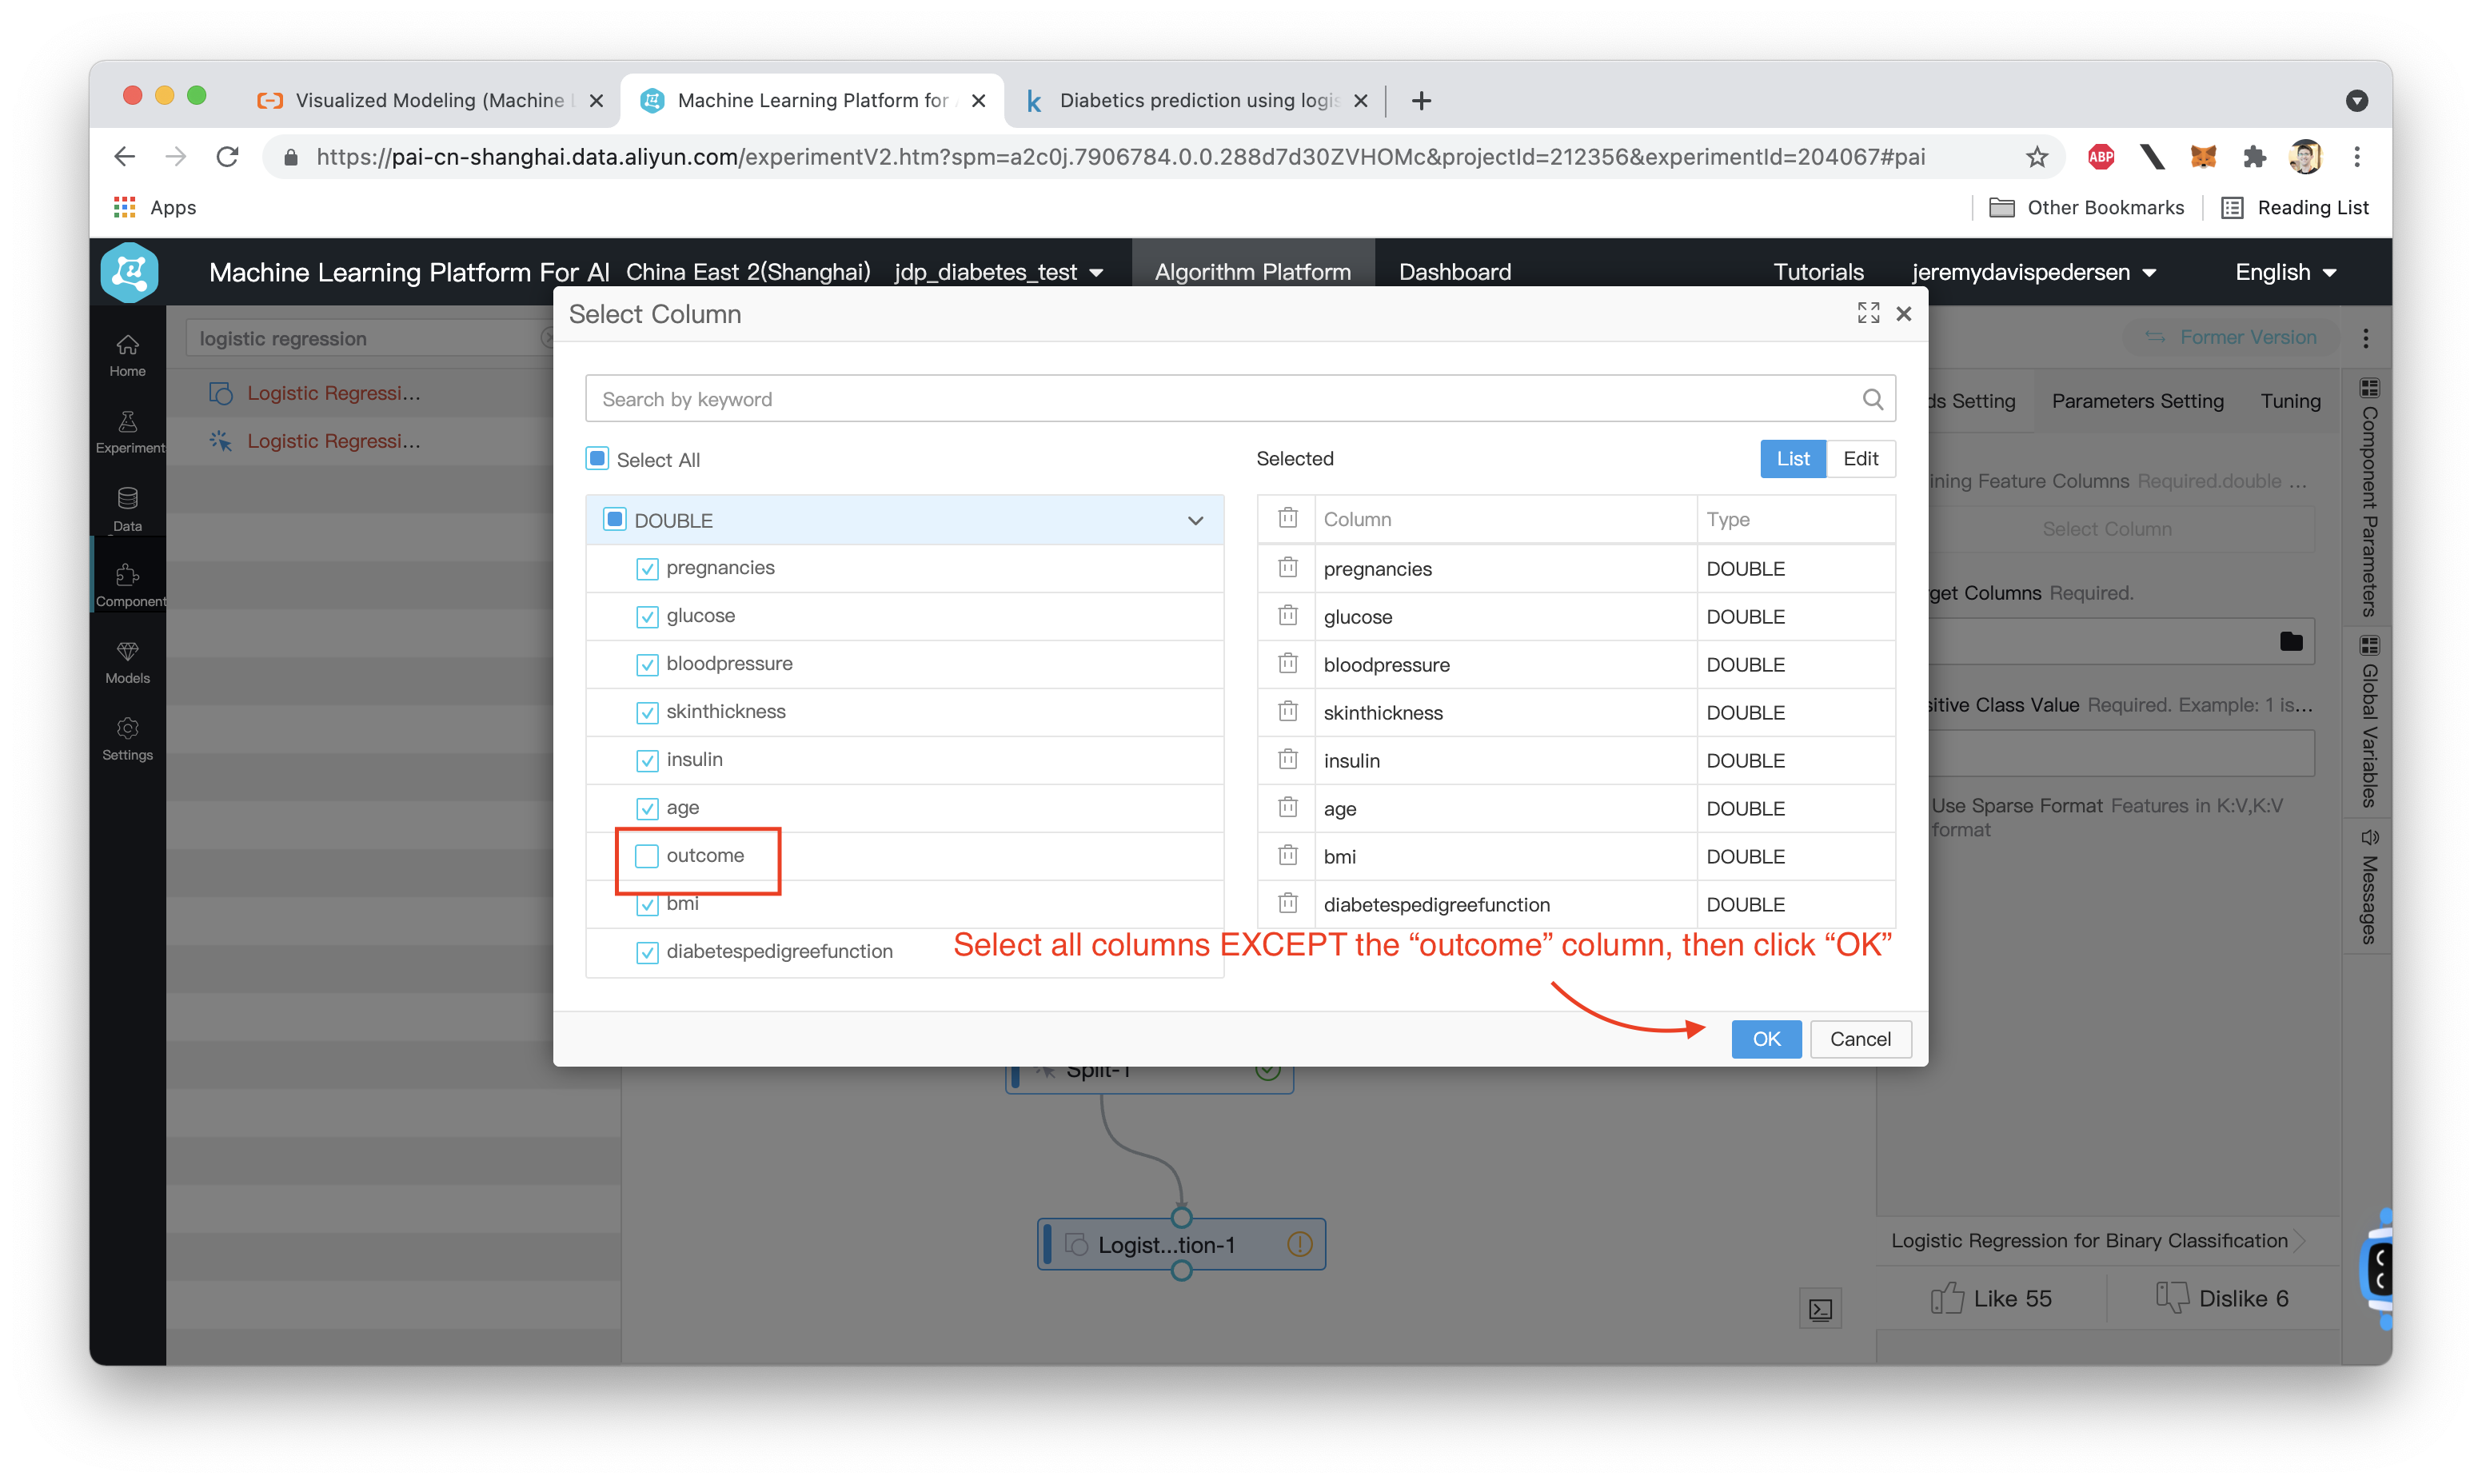
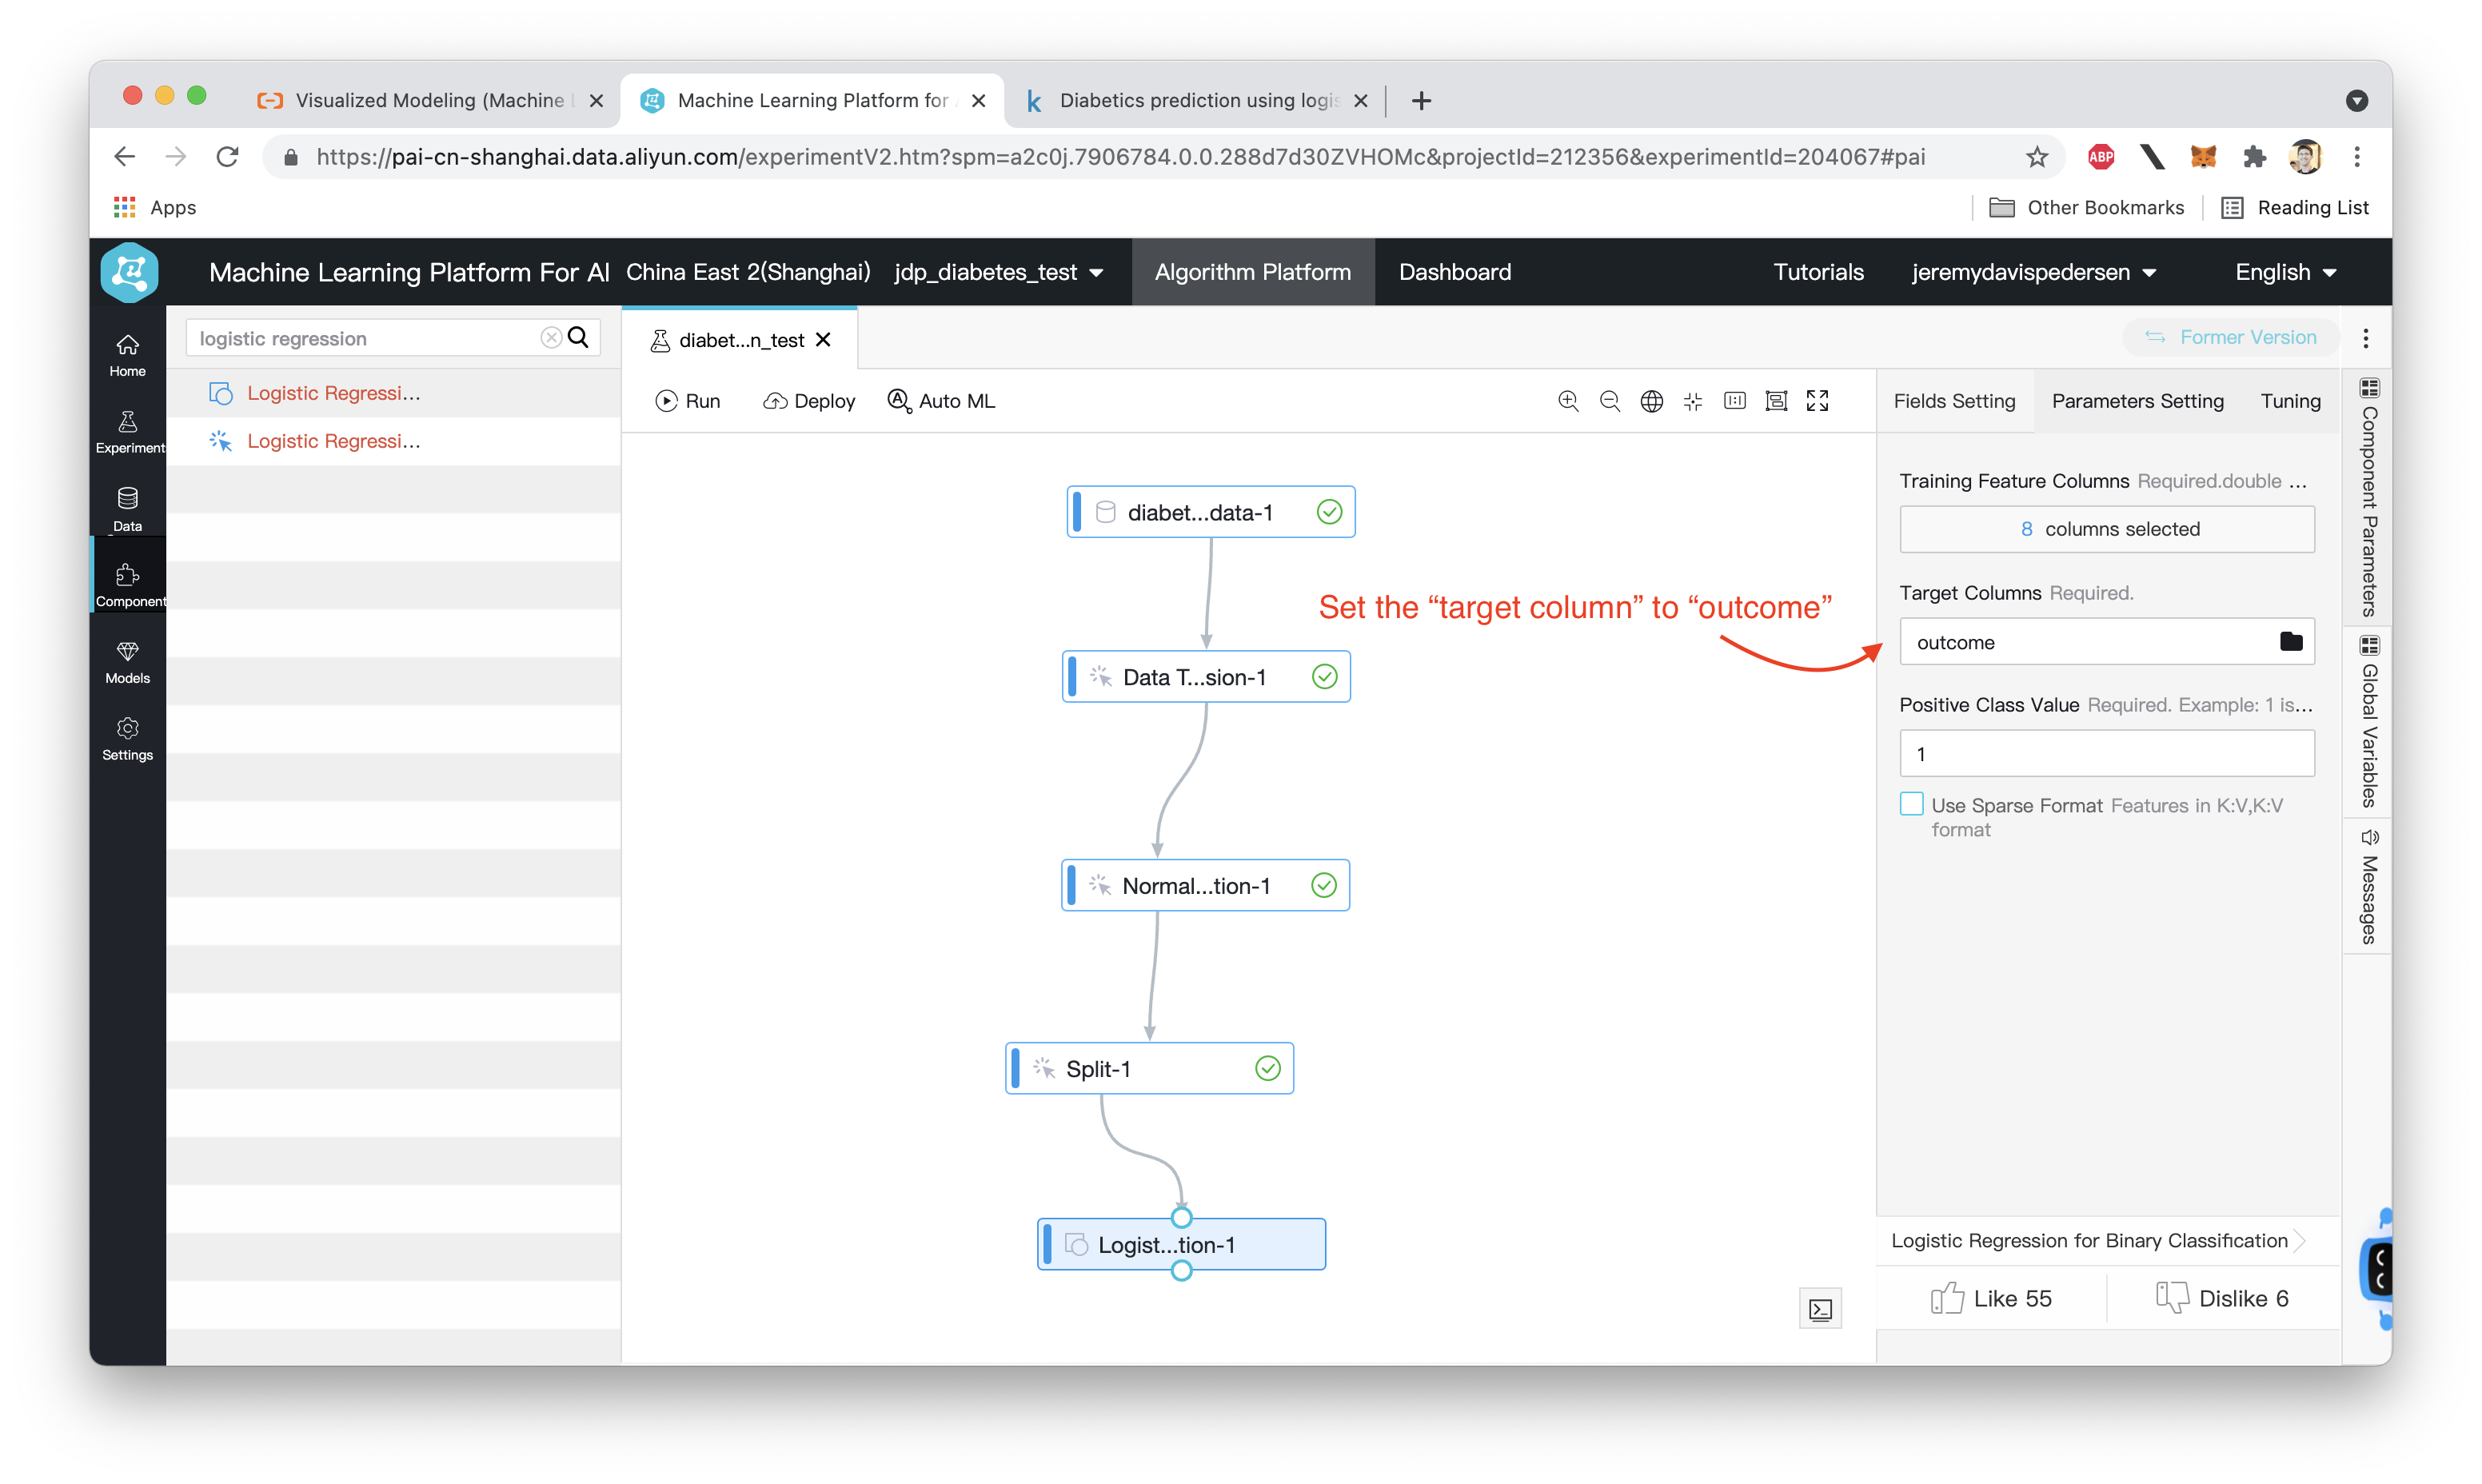
With our model configured, we'll also want to run some tests and see how accurate the model is. Todo that, we need to add a few more nodes to the workflow, like so:
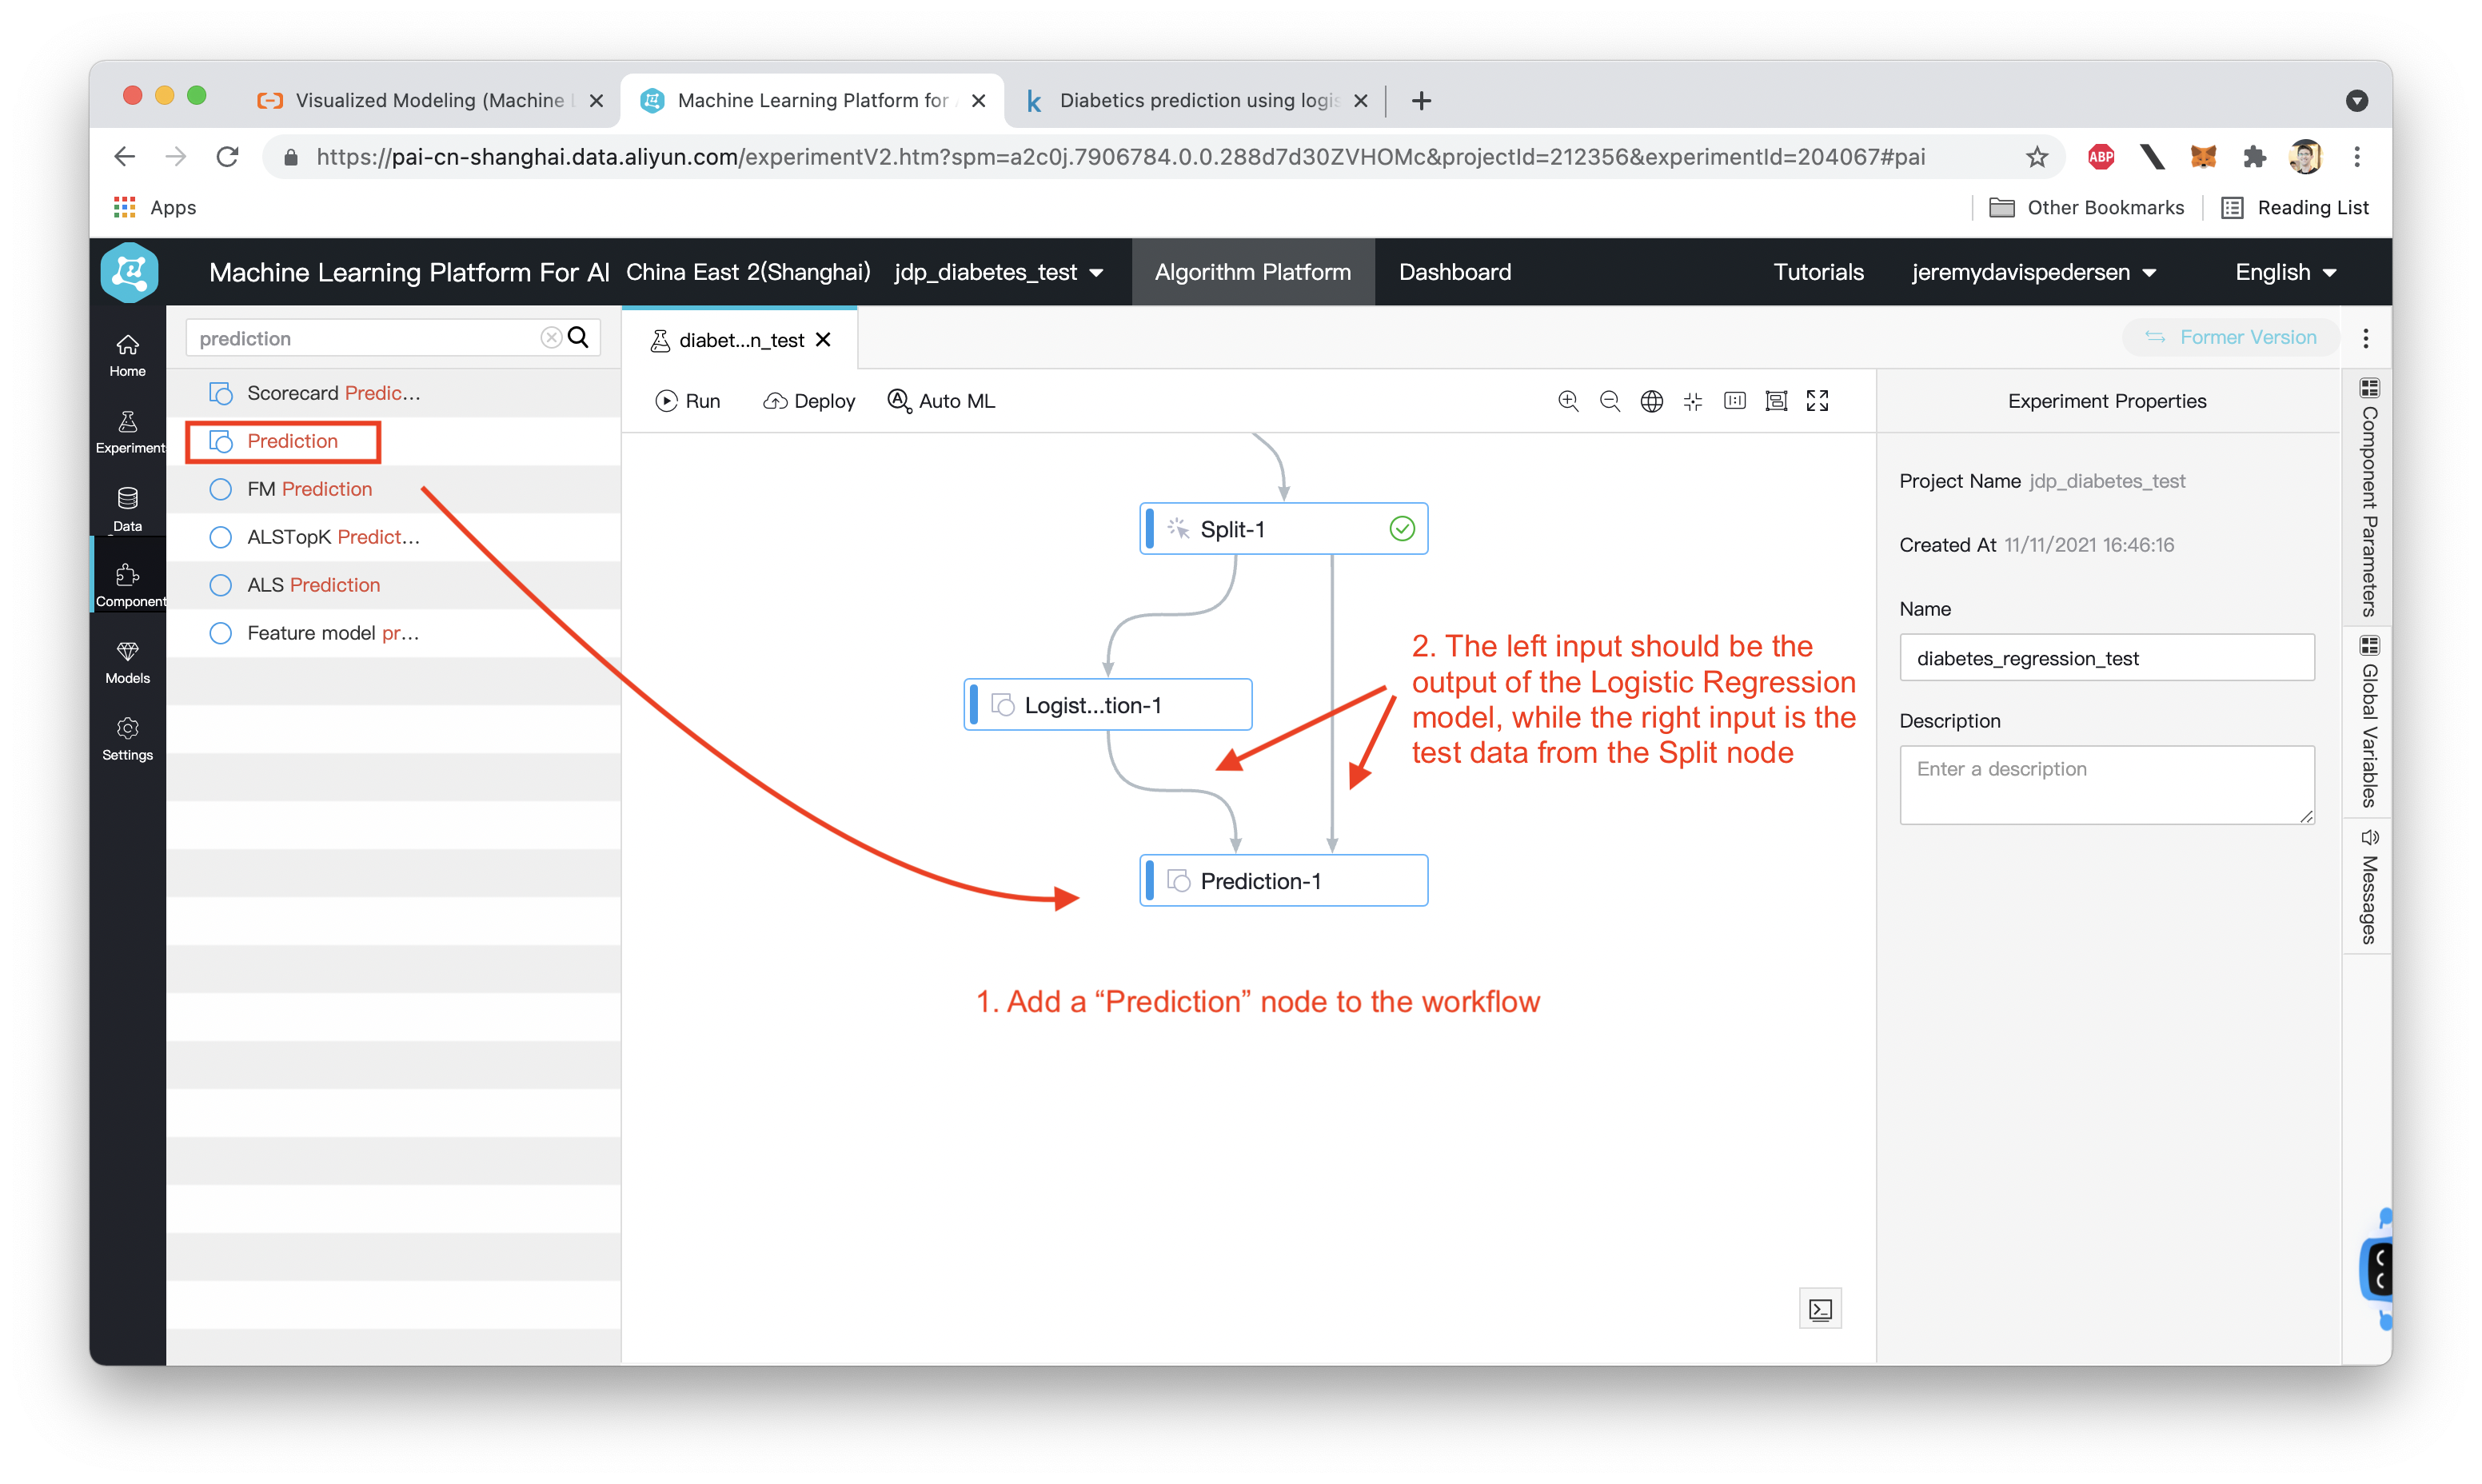
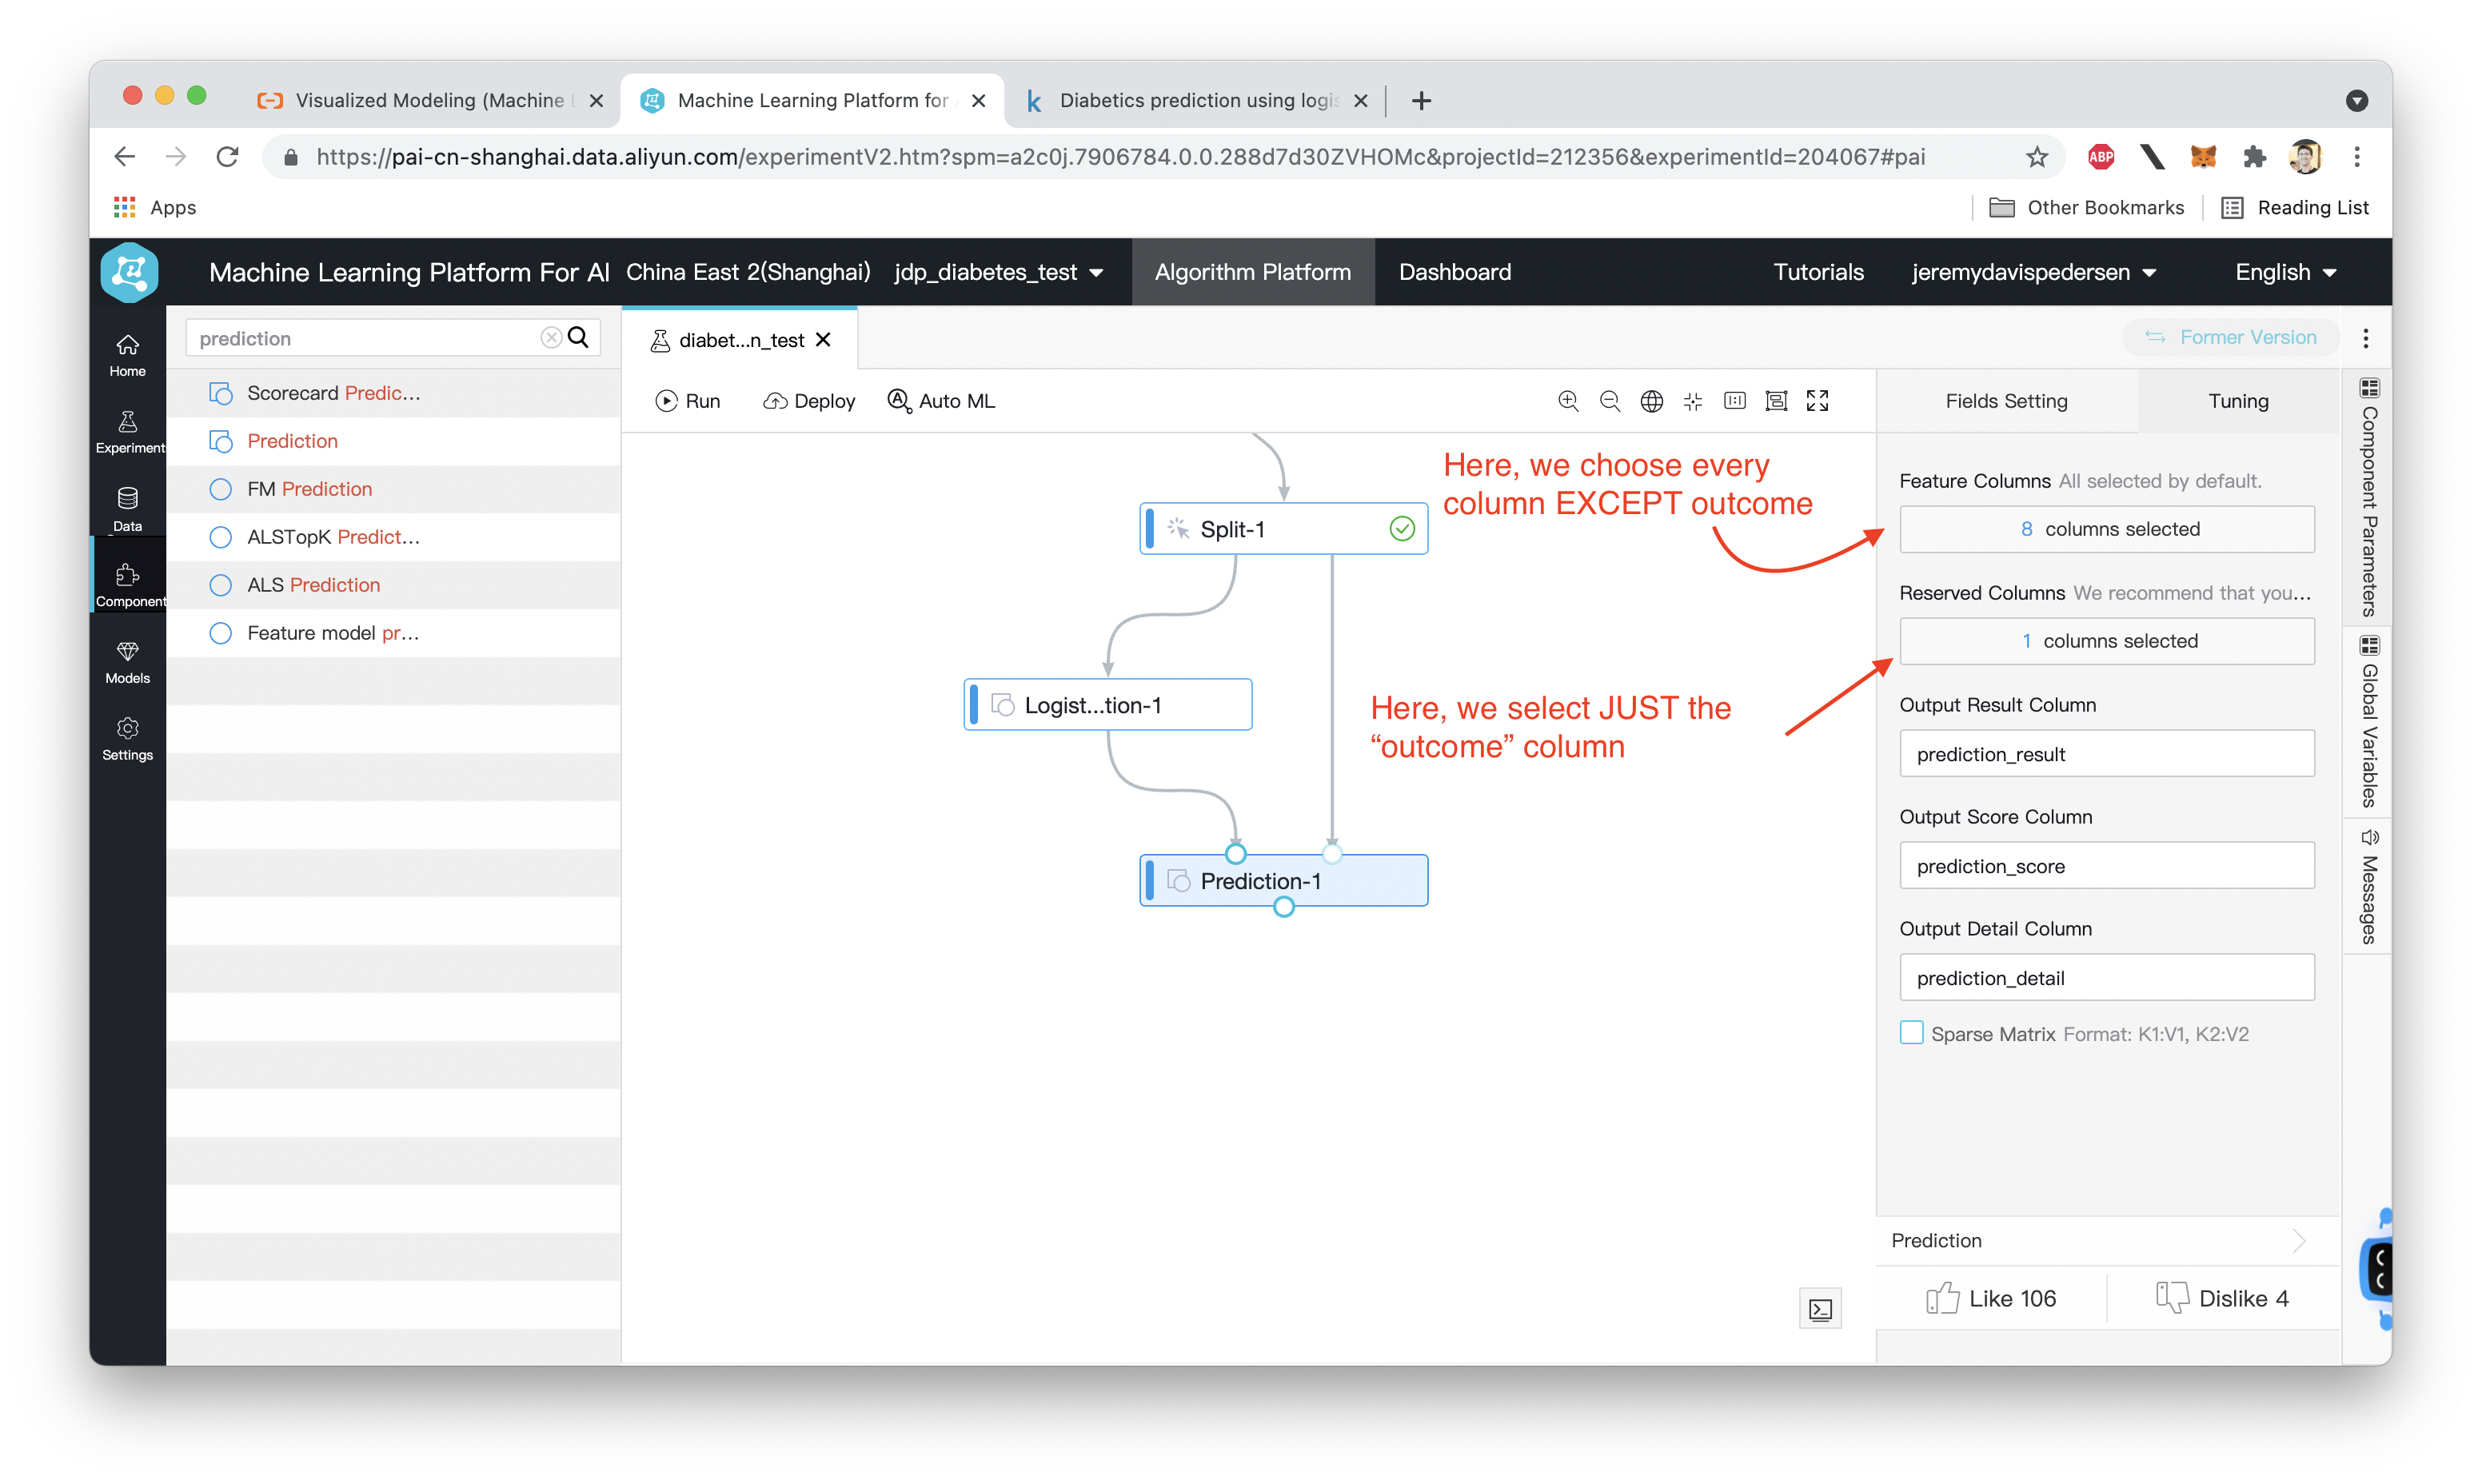
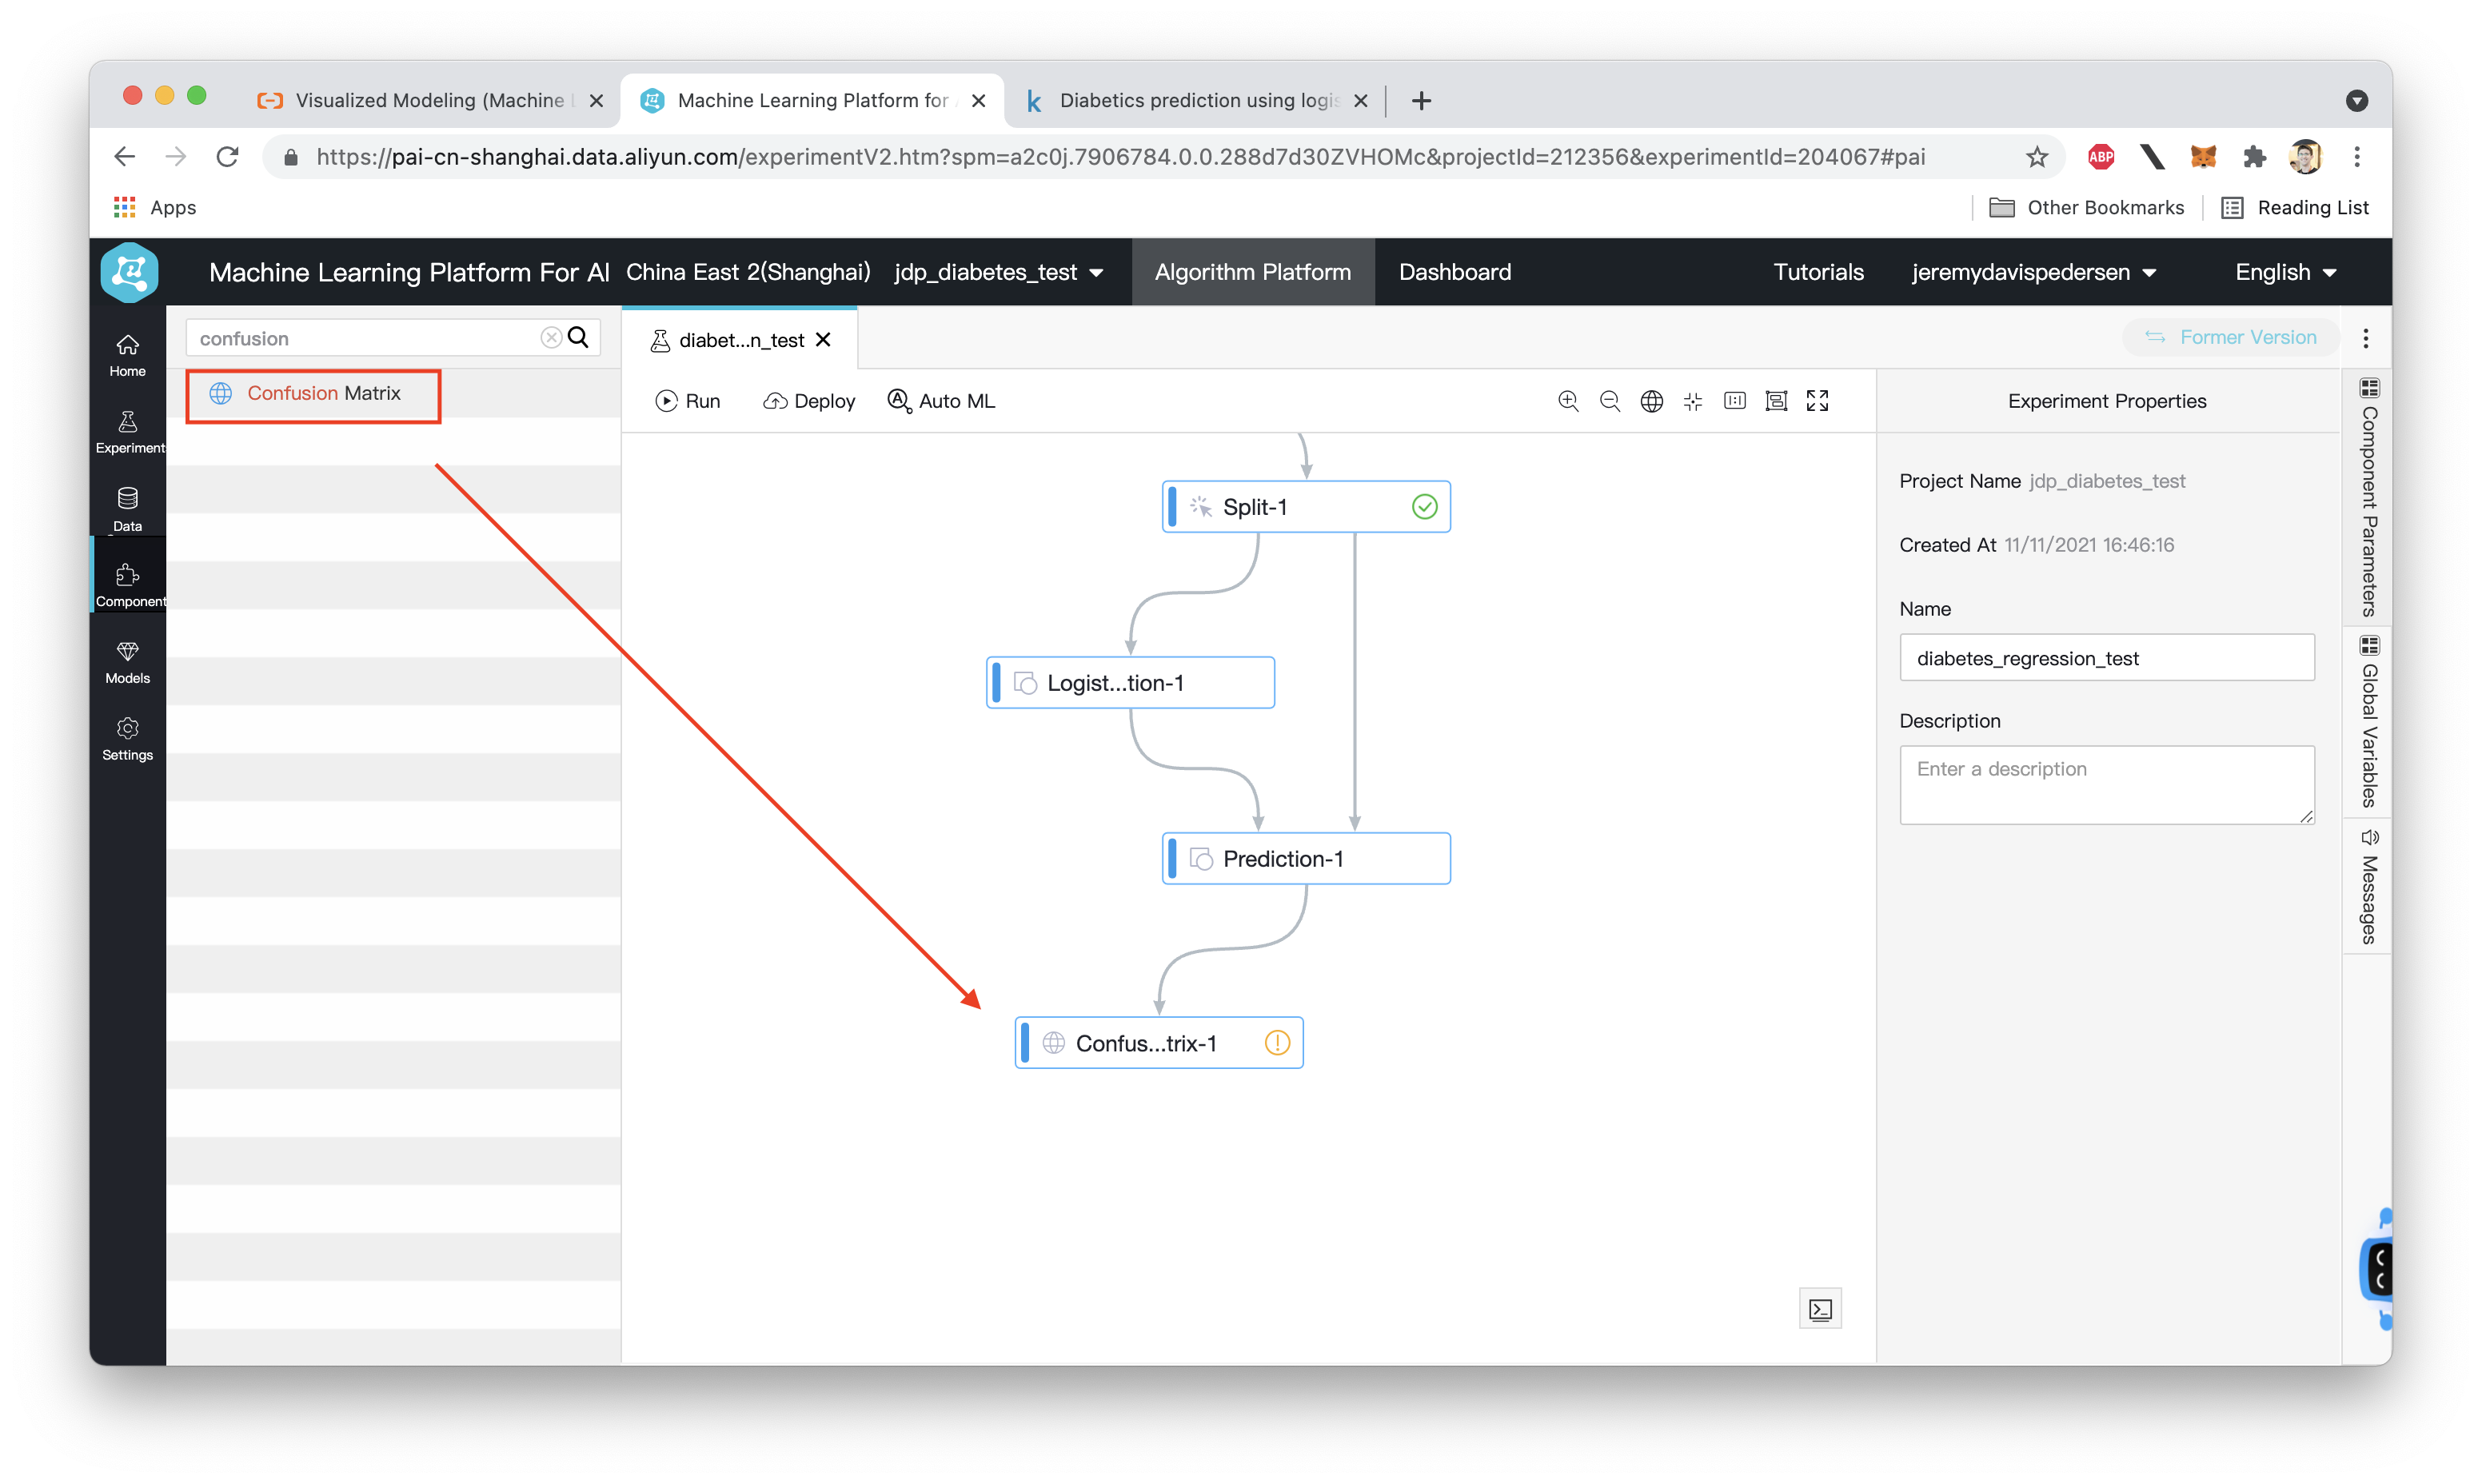
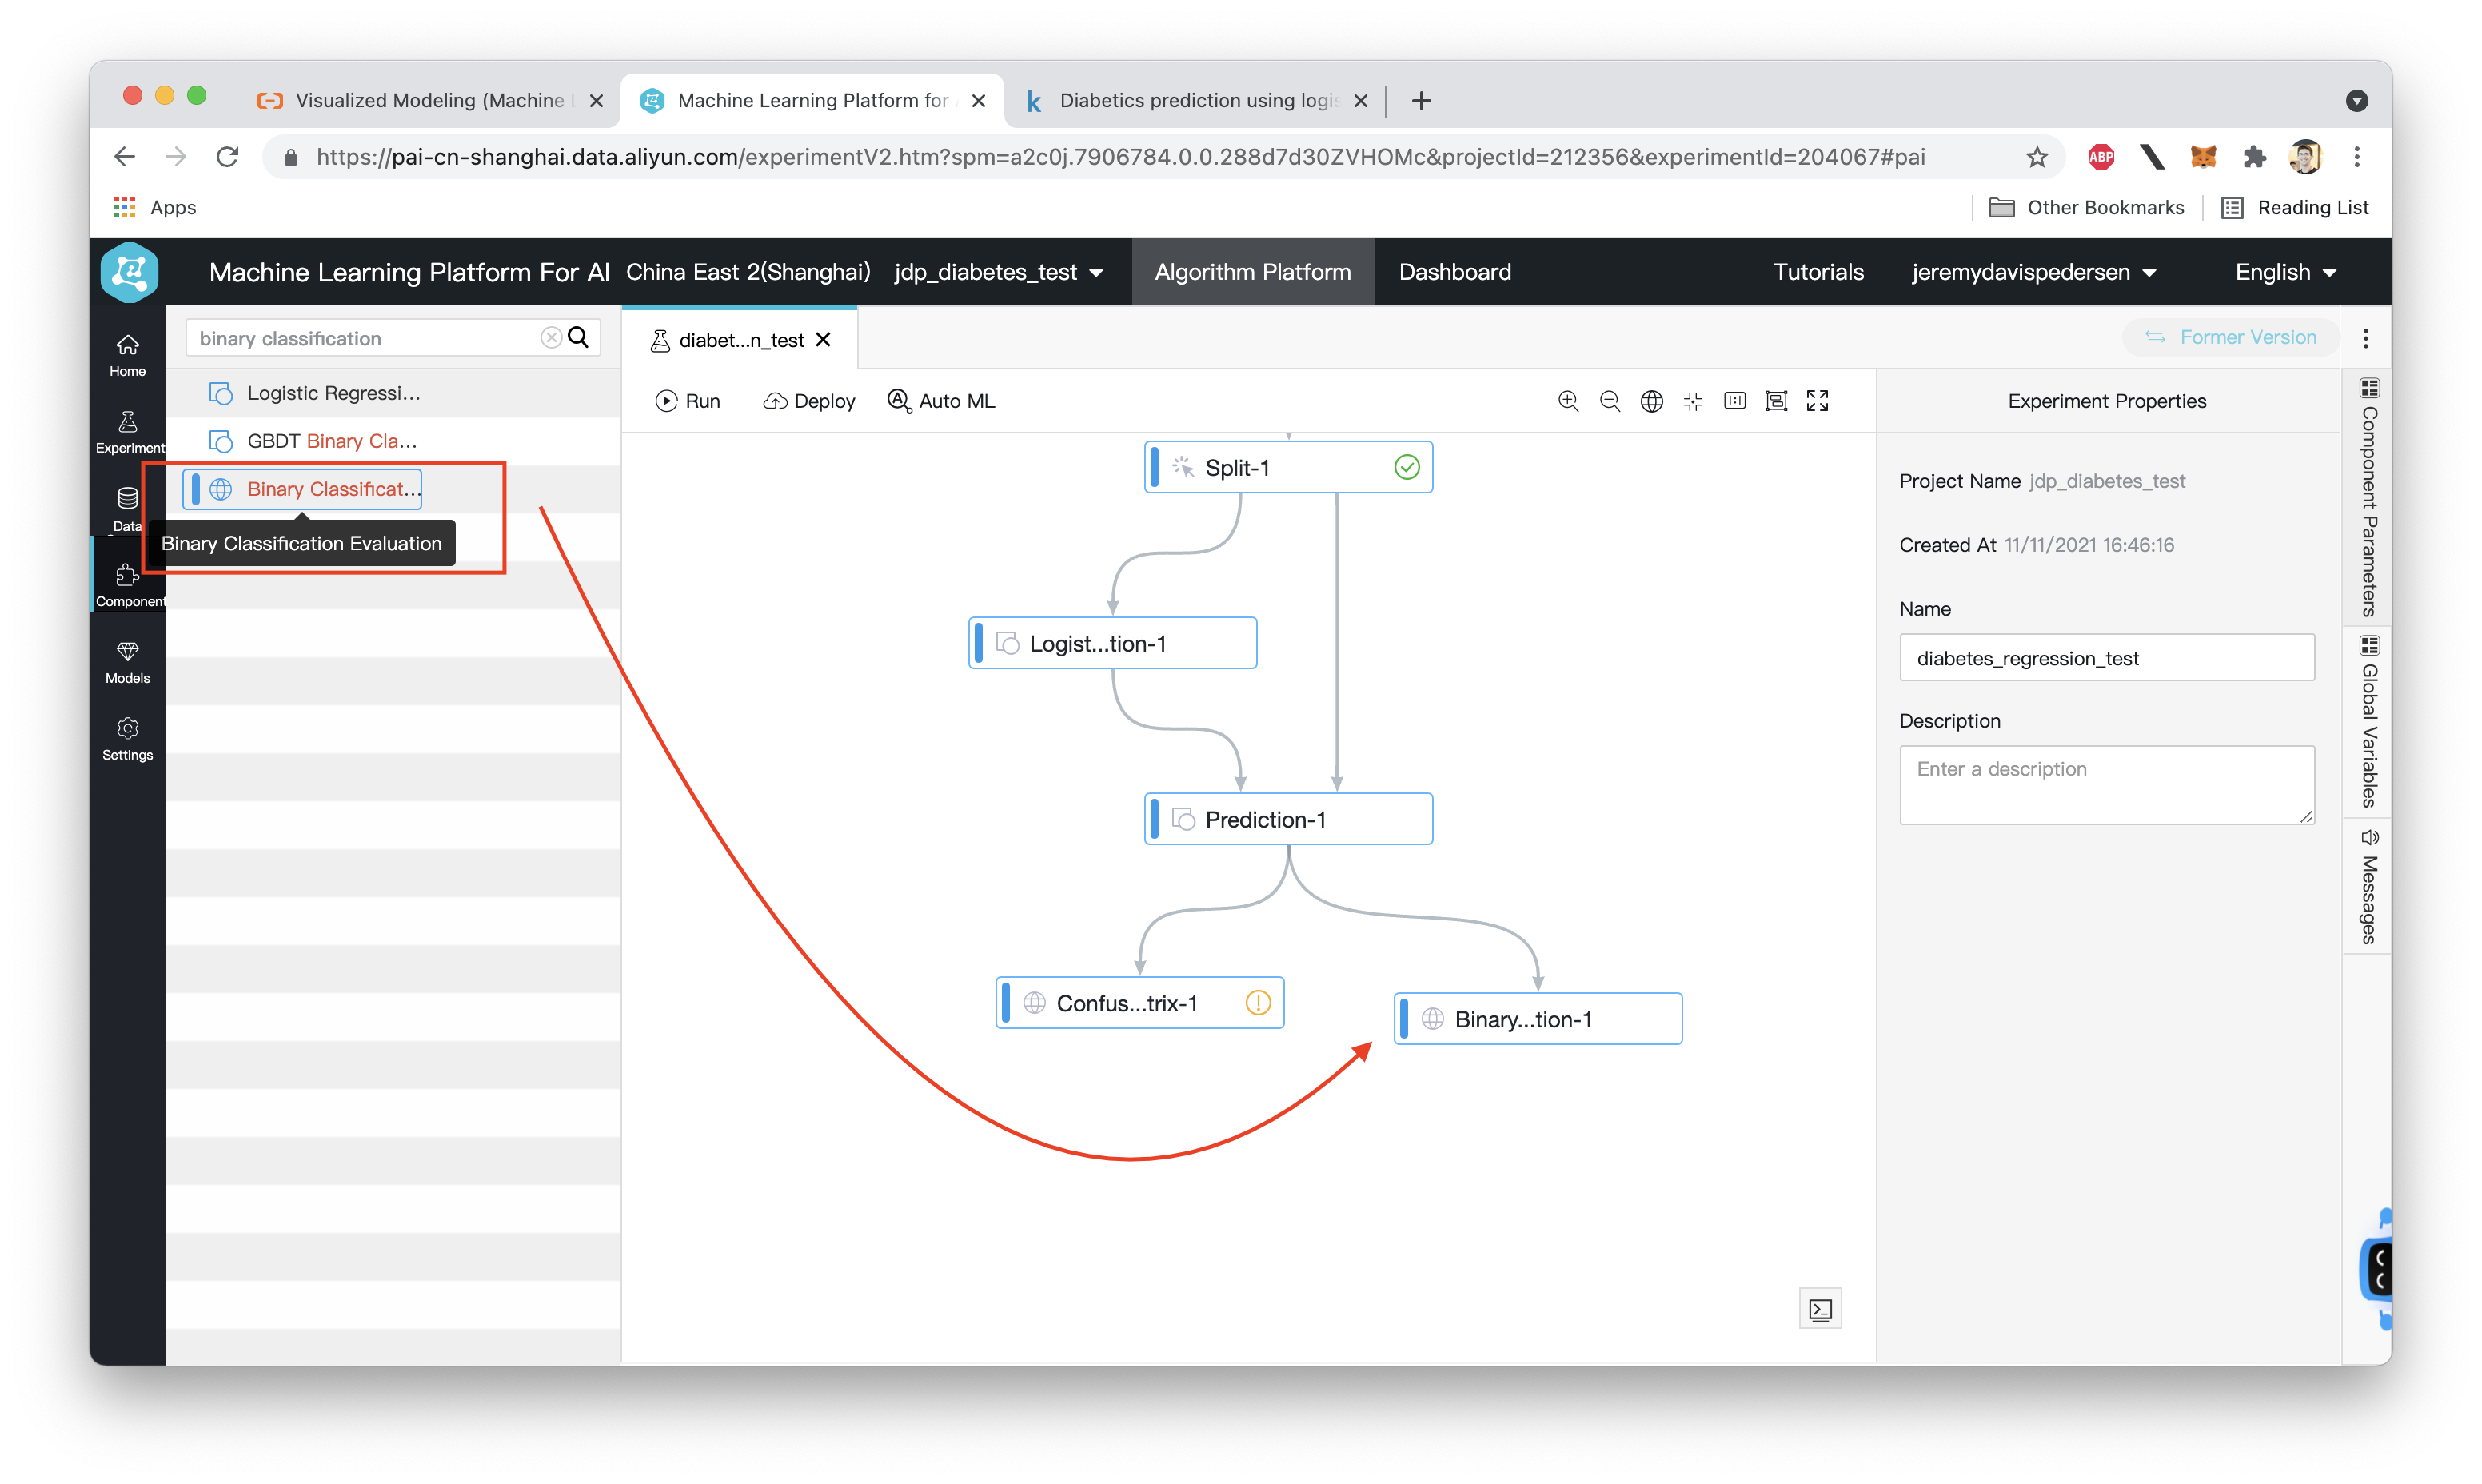
Next, we add "Confusion Matrix" and "Binary Classifier Evaluator" nodes:
For each of these nodes, we need to indicate which column in our dataset is the "label" (i.e. which column indicates whether or not a patient really has diabetes). In this case, that is the outcome column:
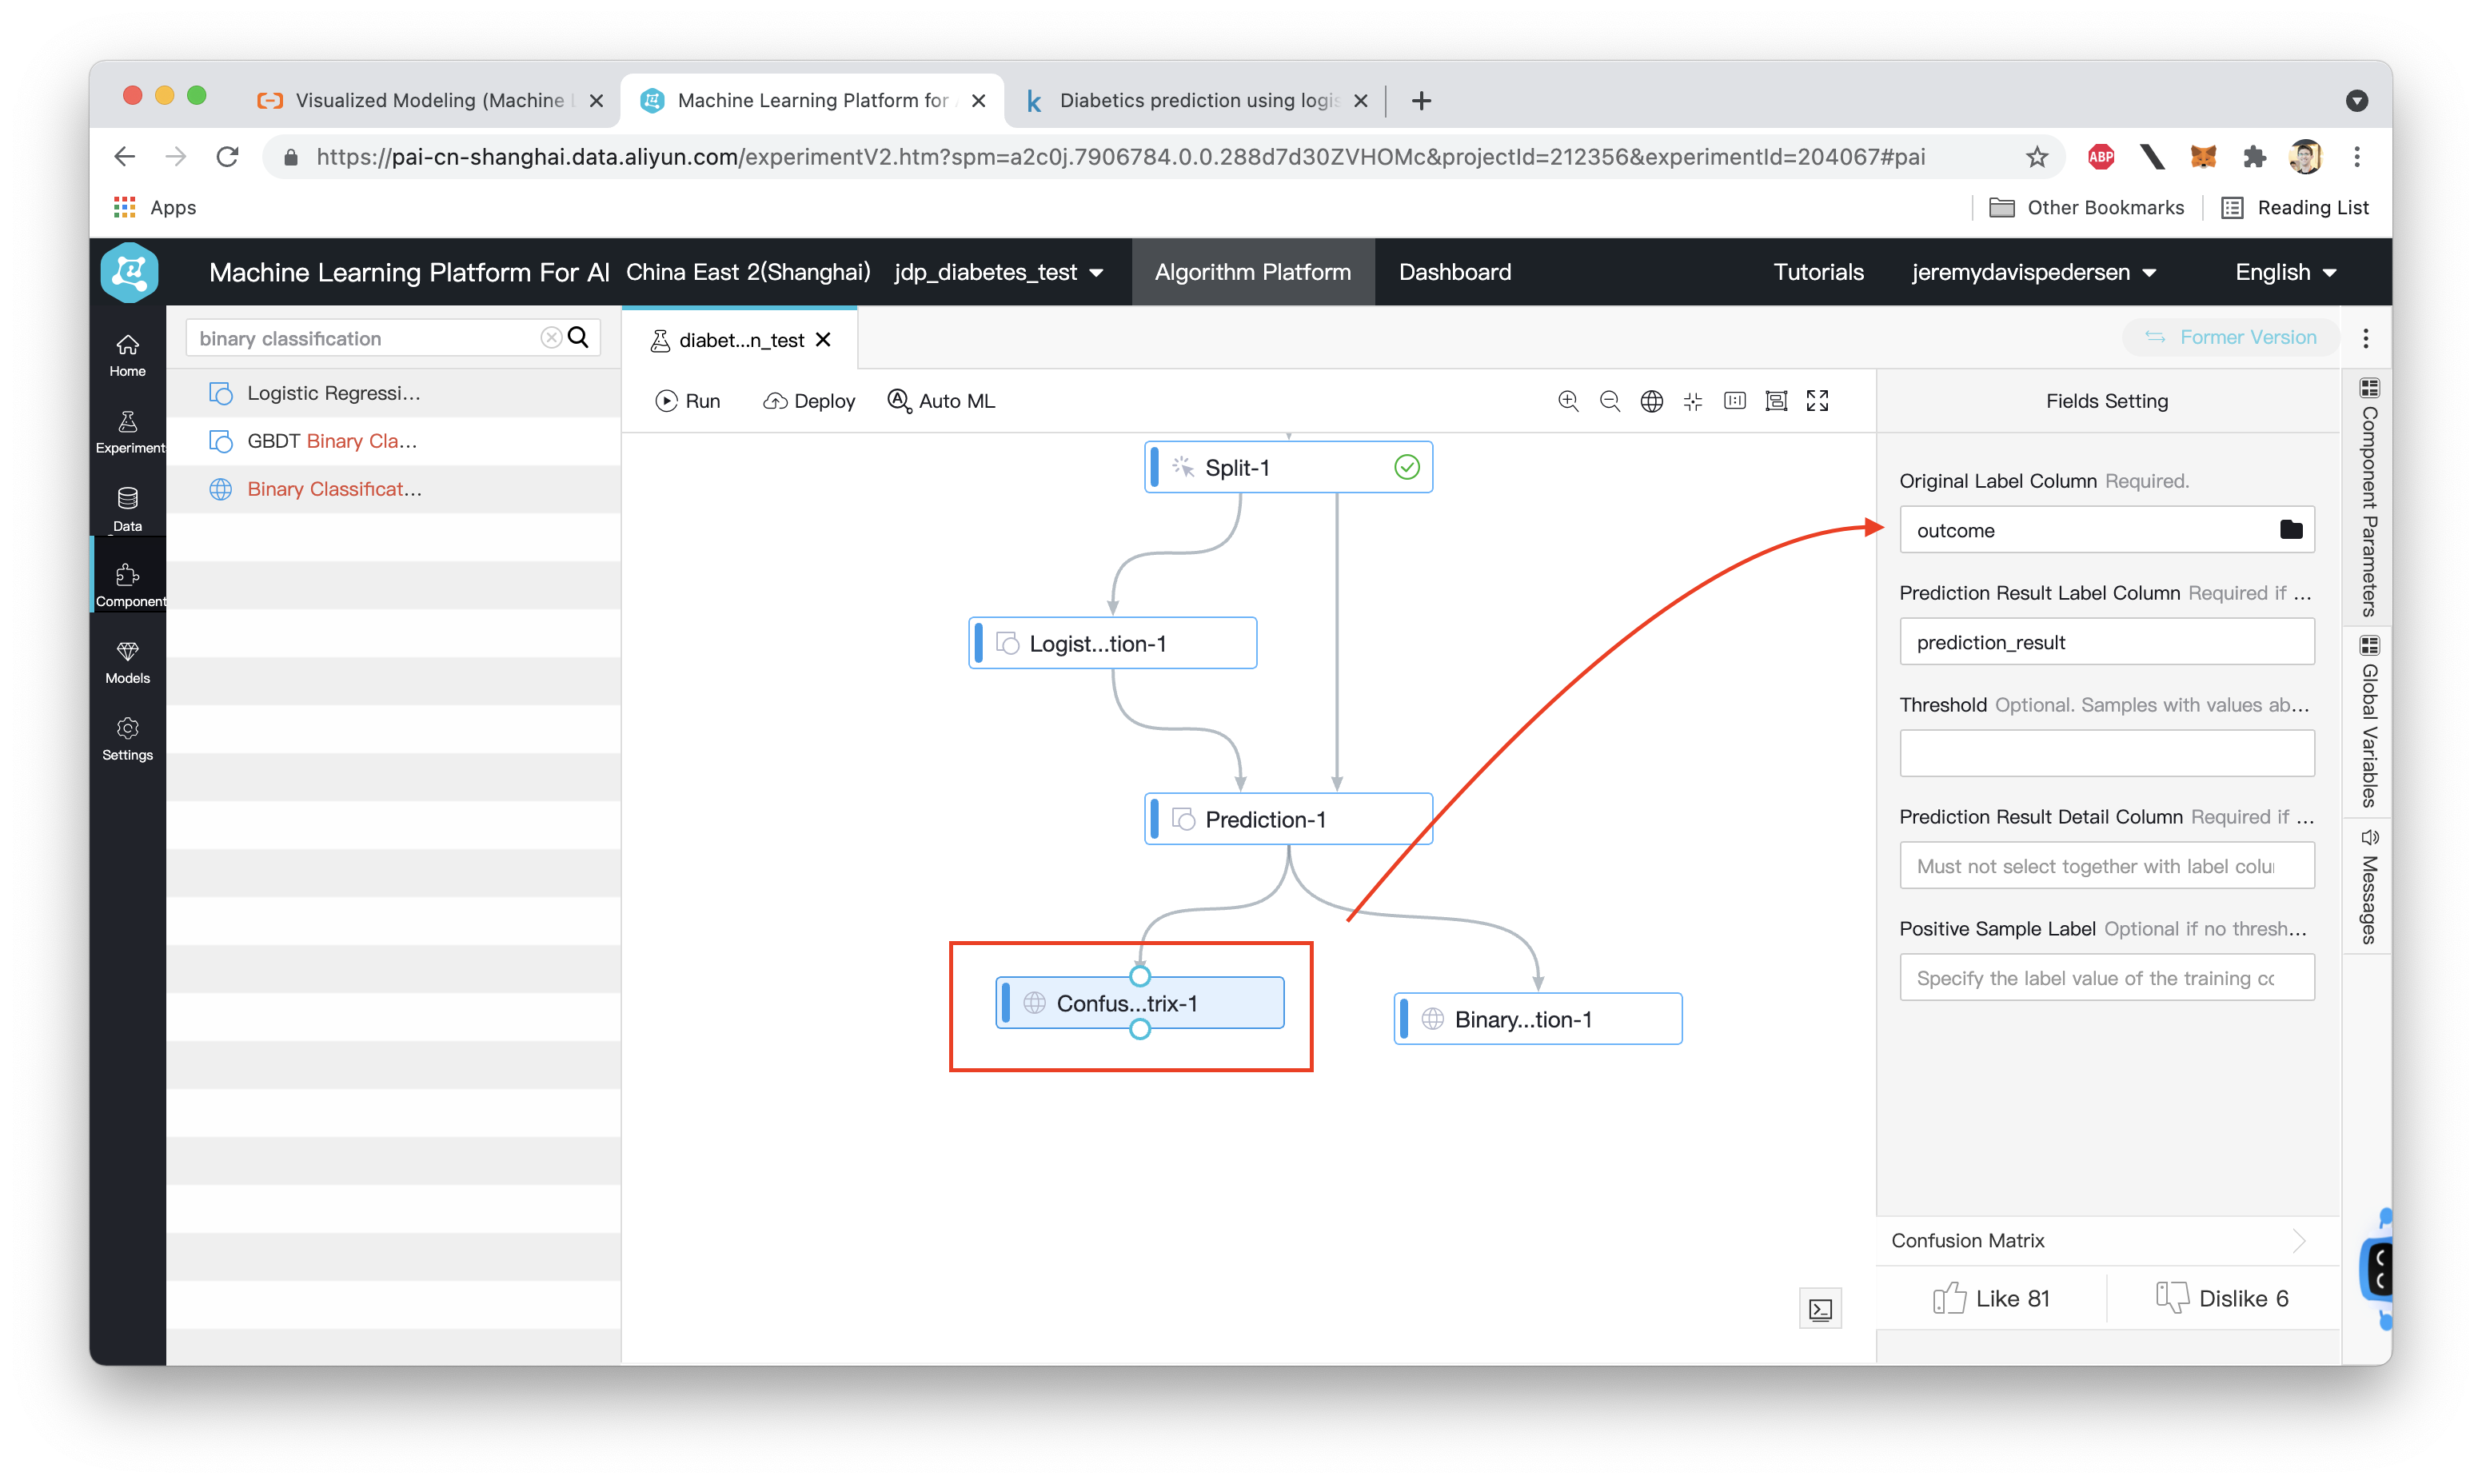
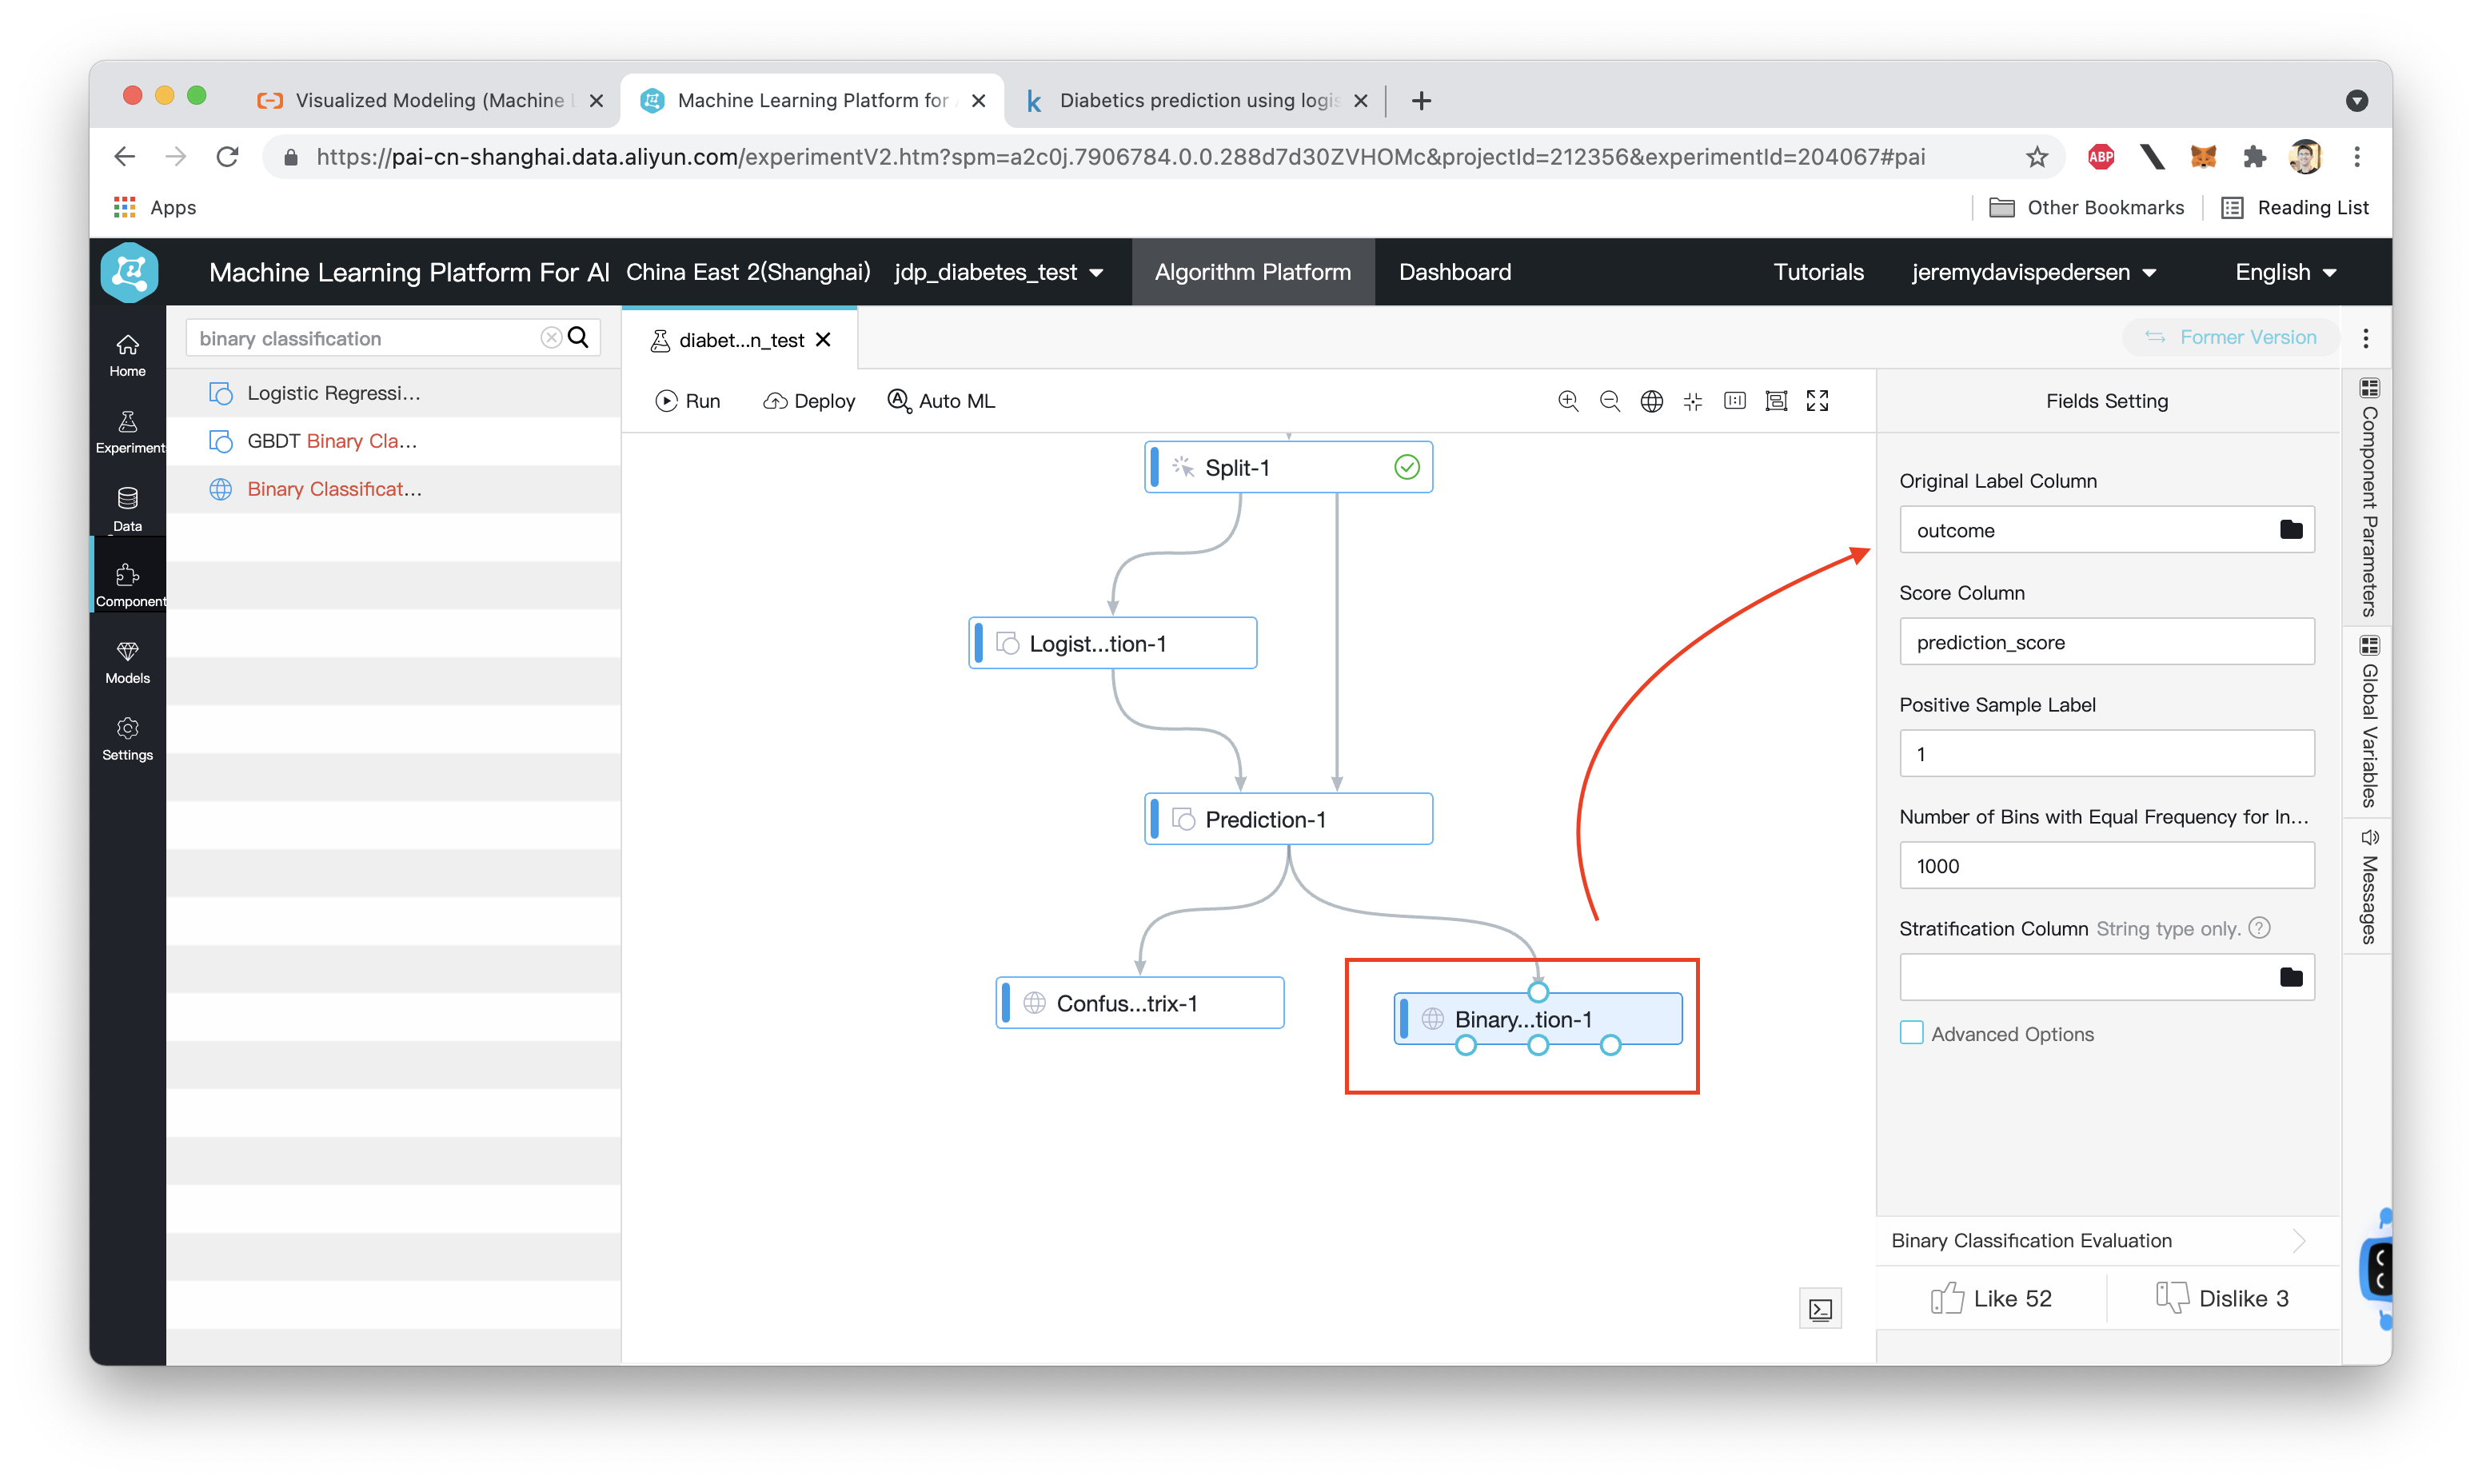
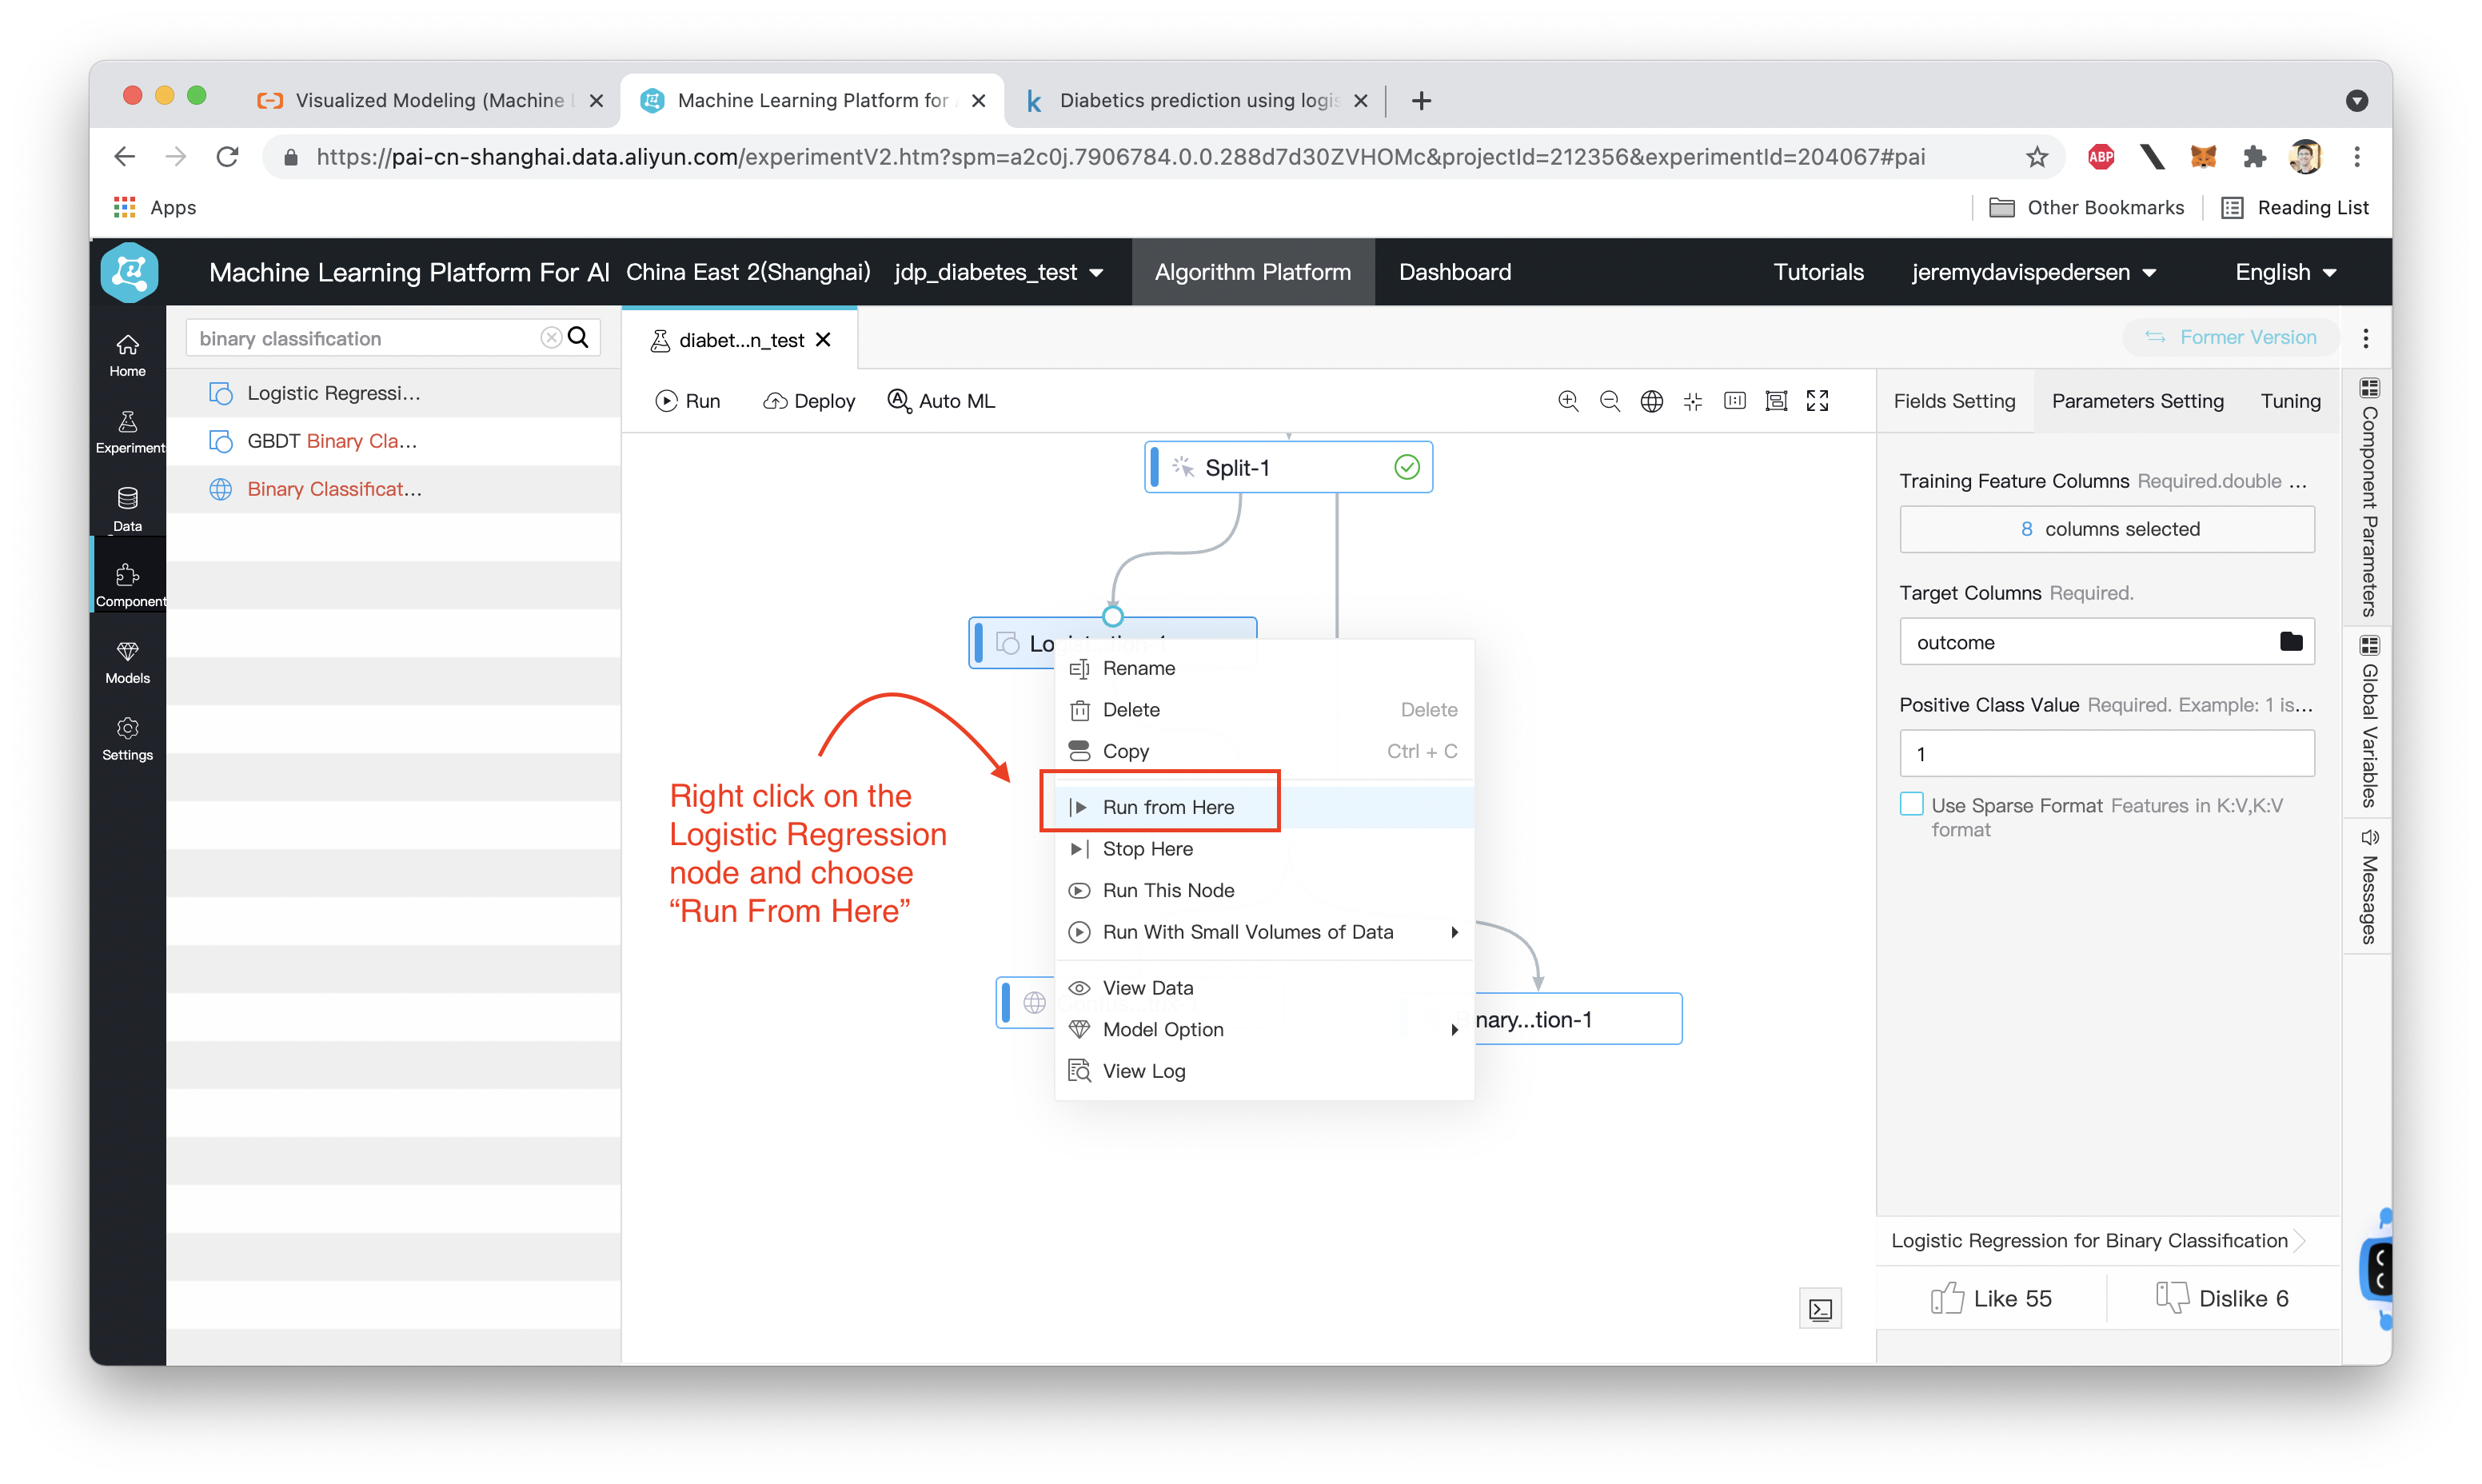
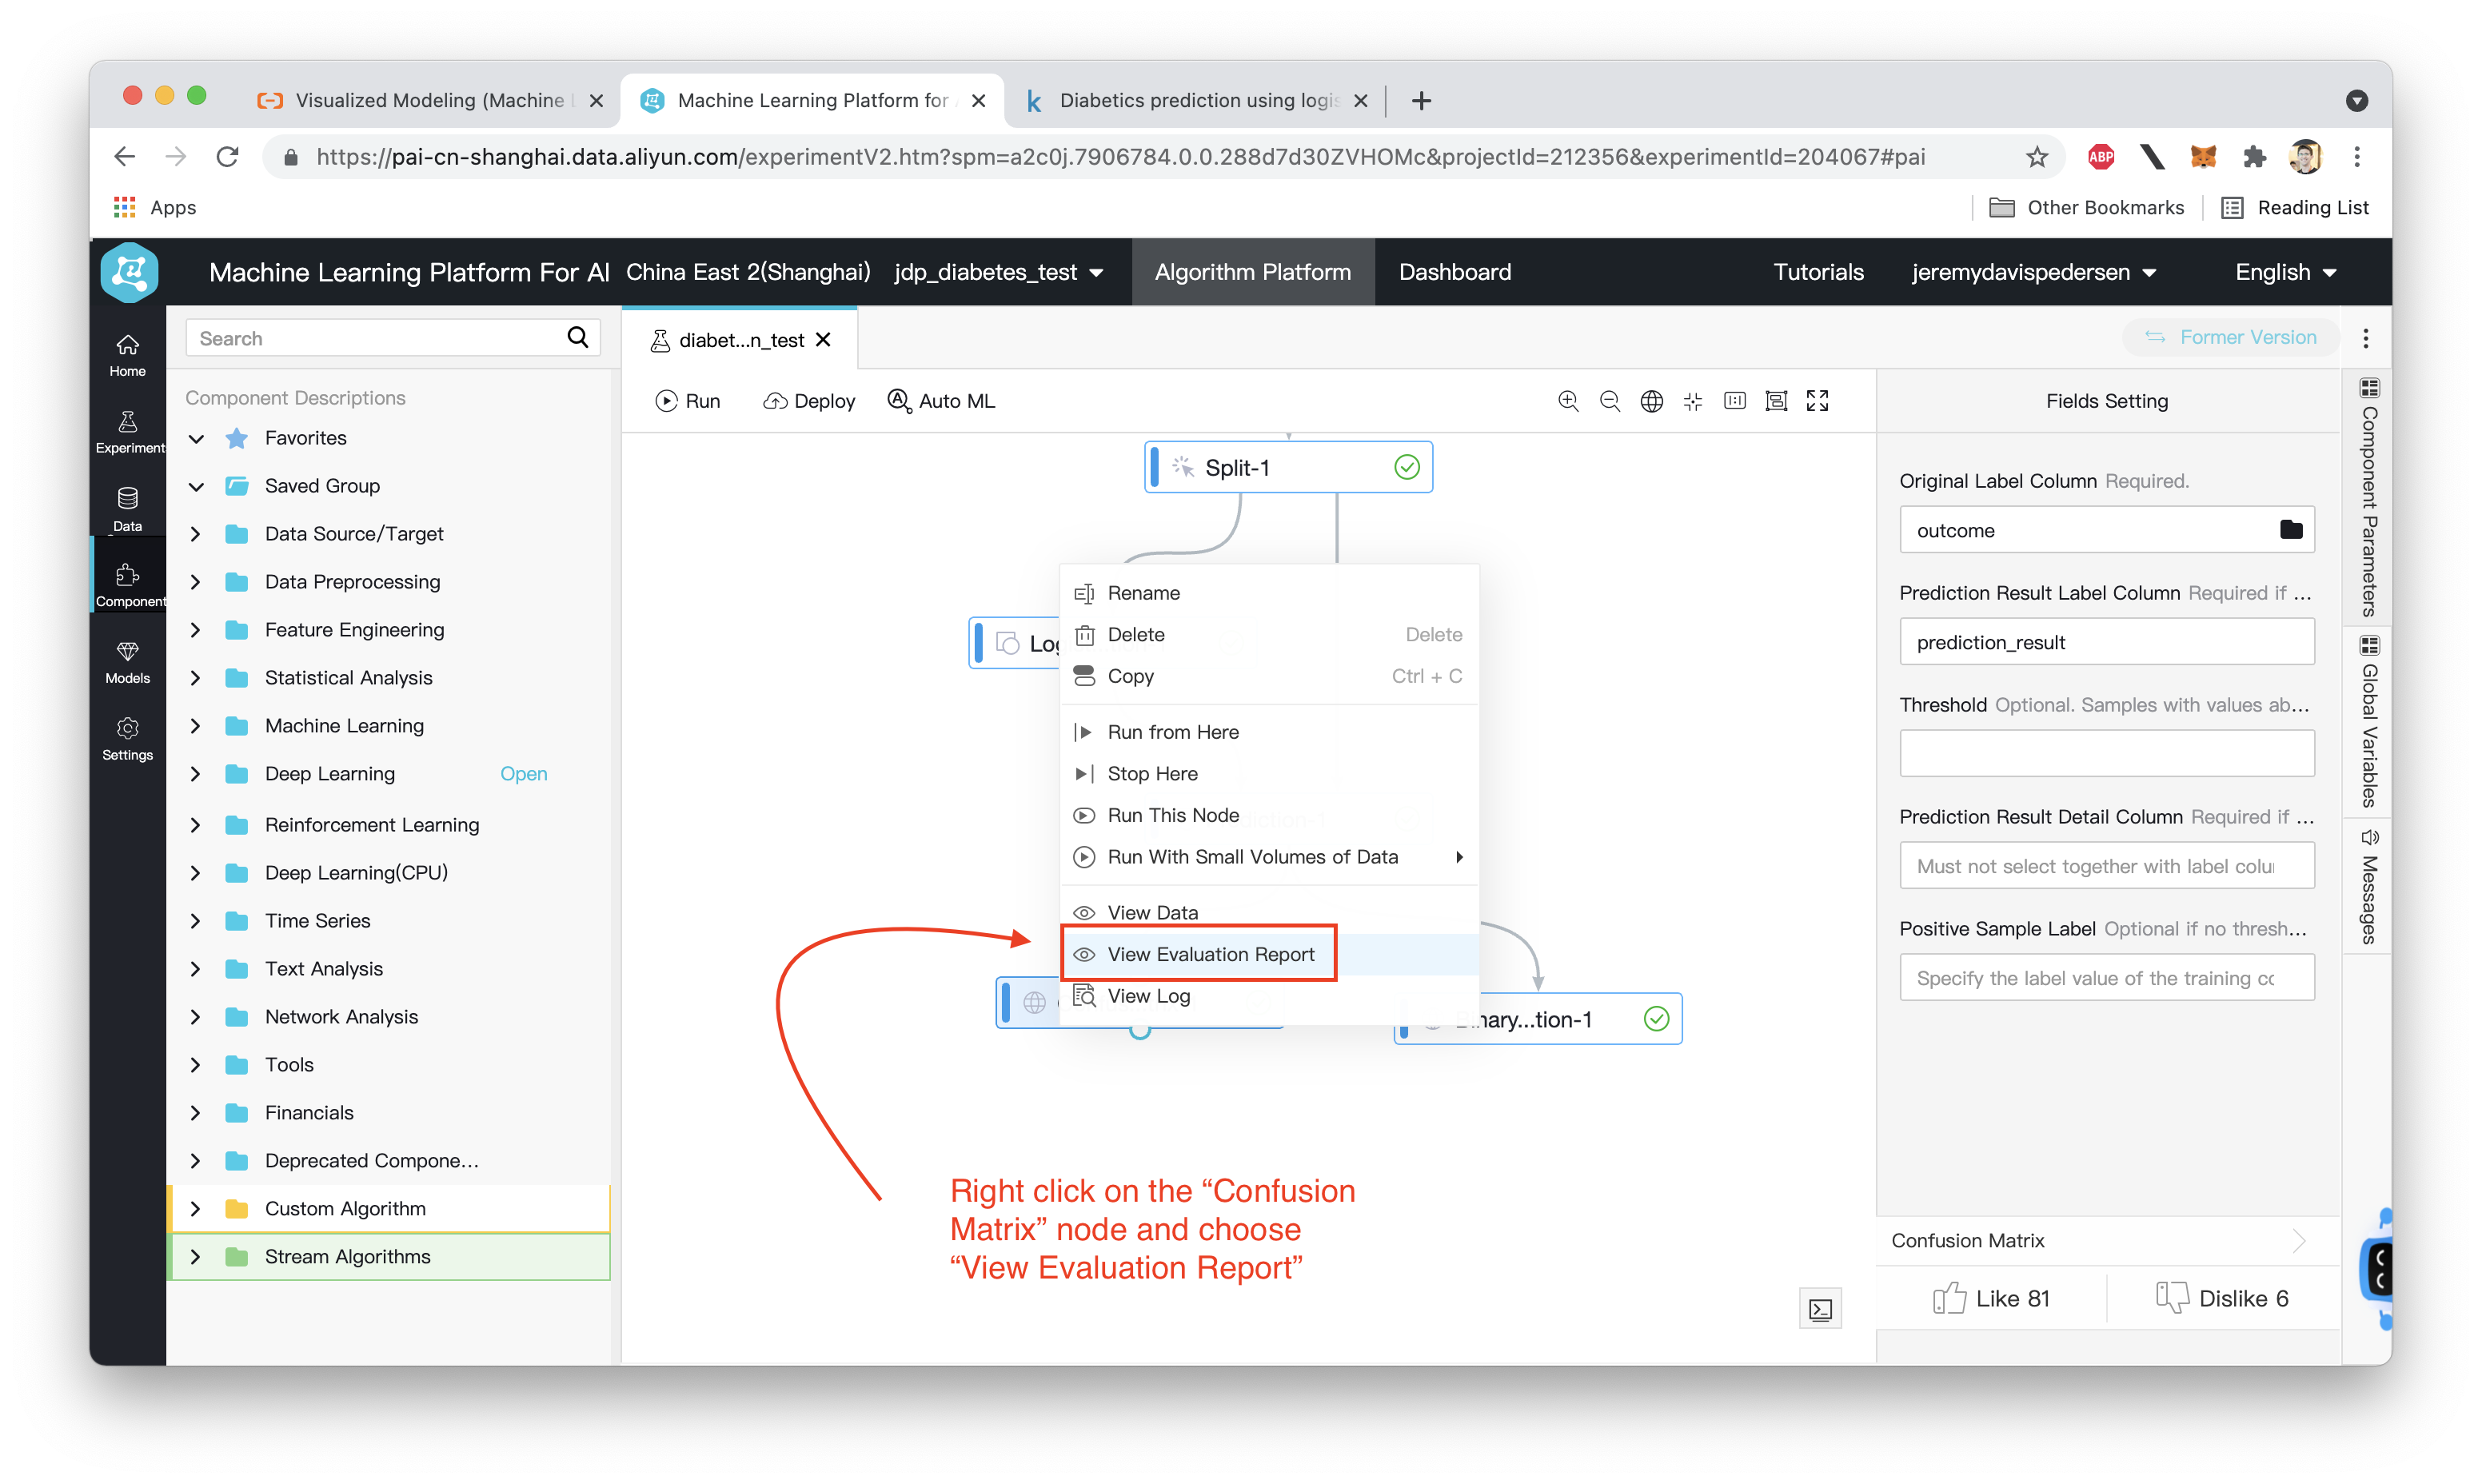
Finally, we need to train our model and then test its performance using the Prediction node and the two evaluation nodes, Confusion Matrix and Binary Classification Evaluation. To do this, we right click on the Logistic Regression node and choose "Run From Here", like this:
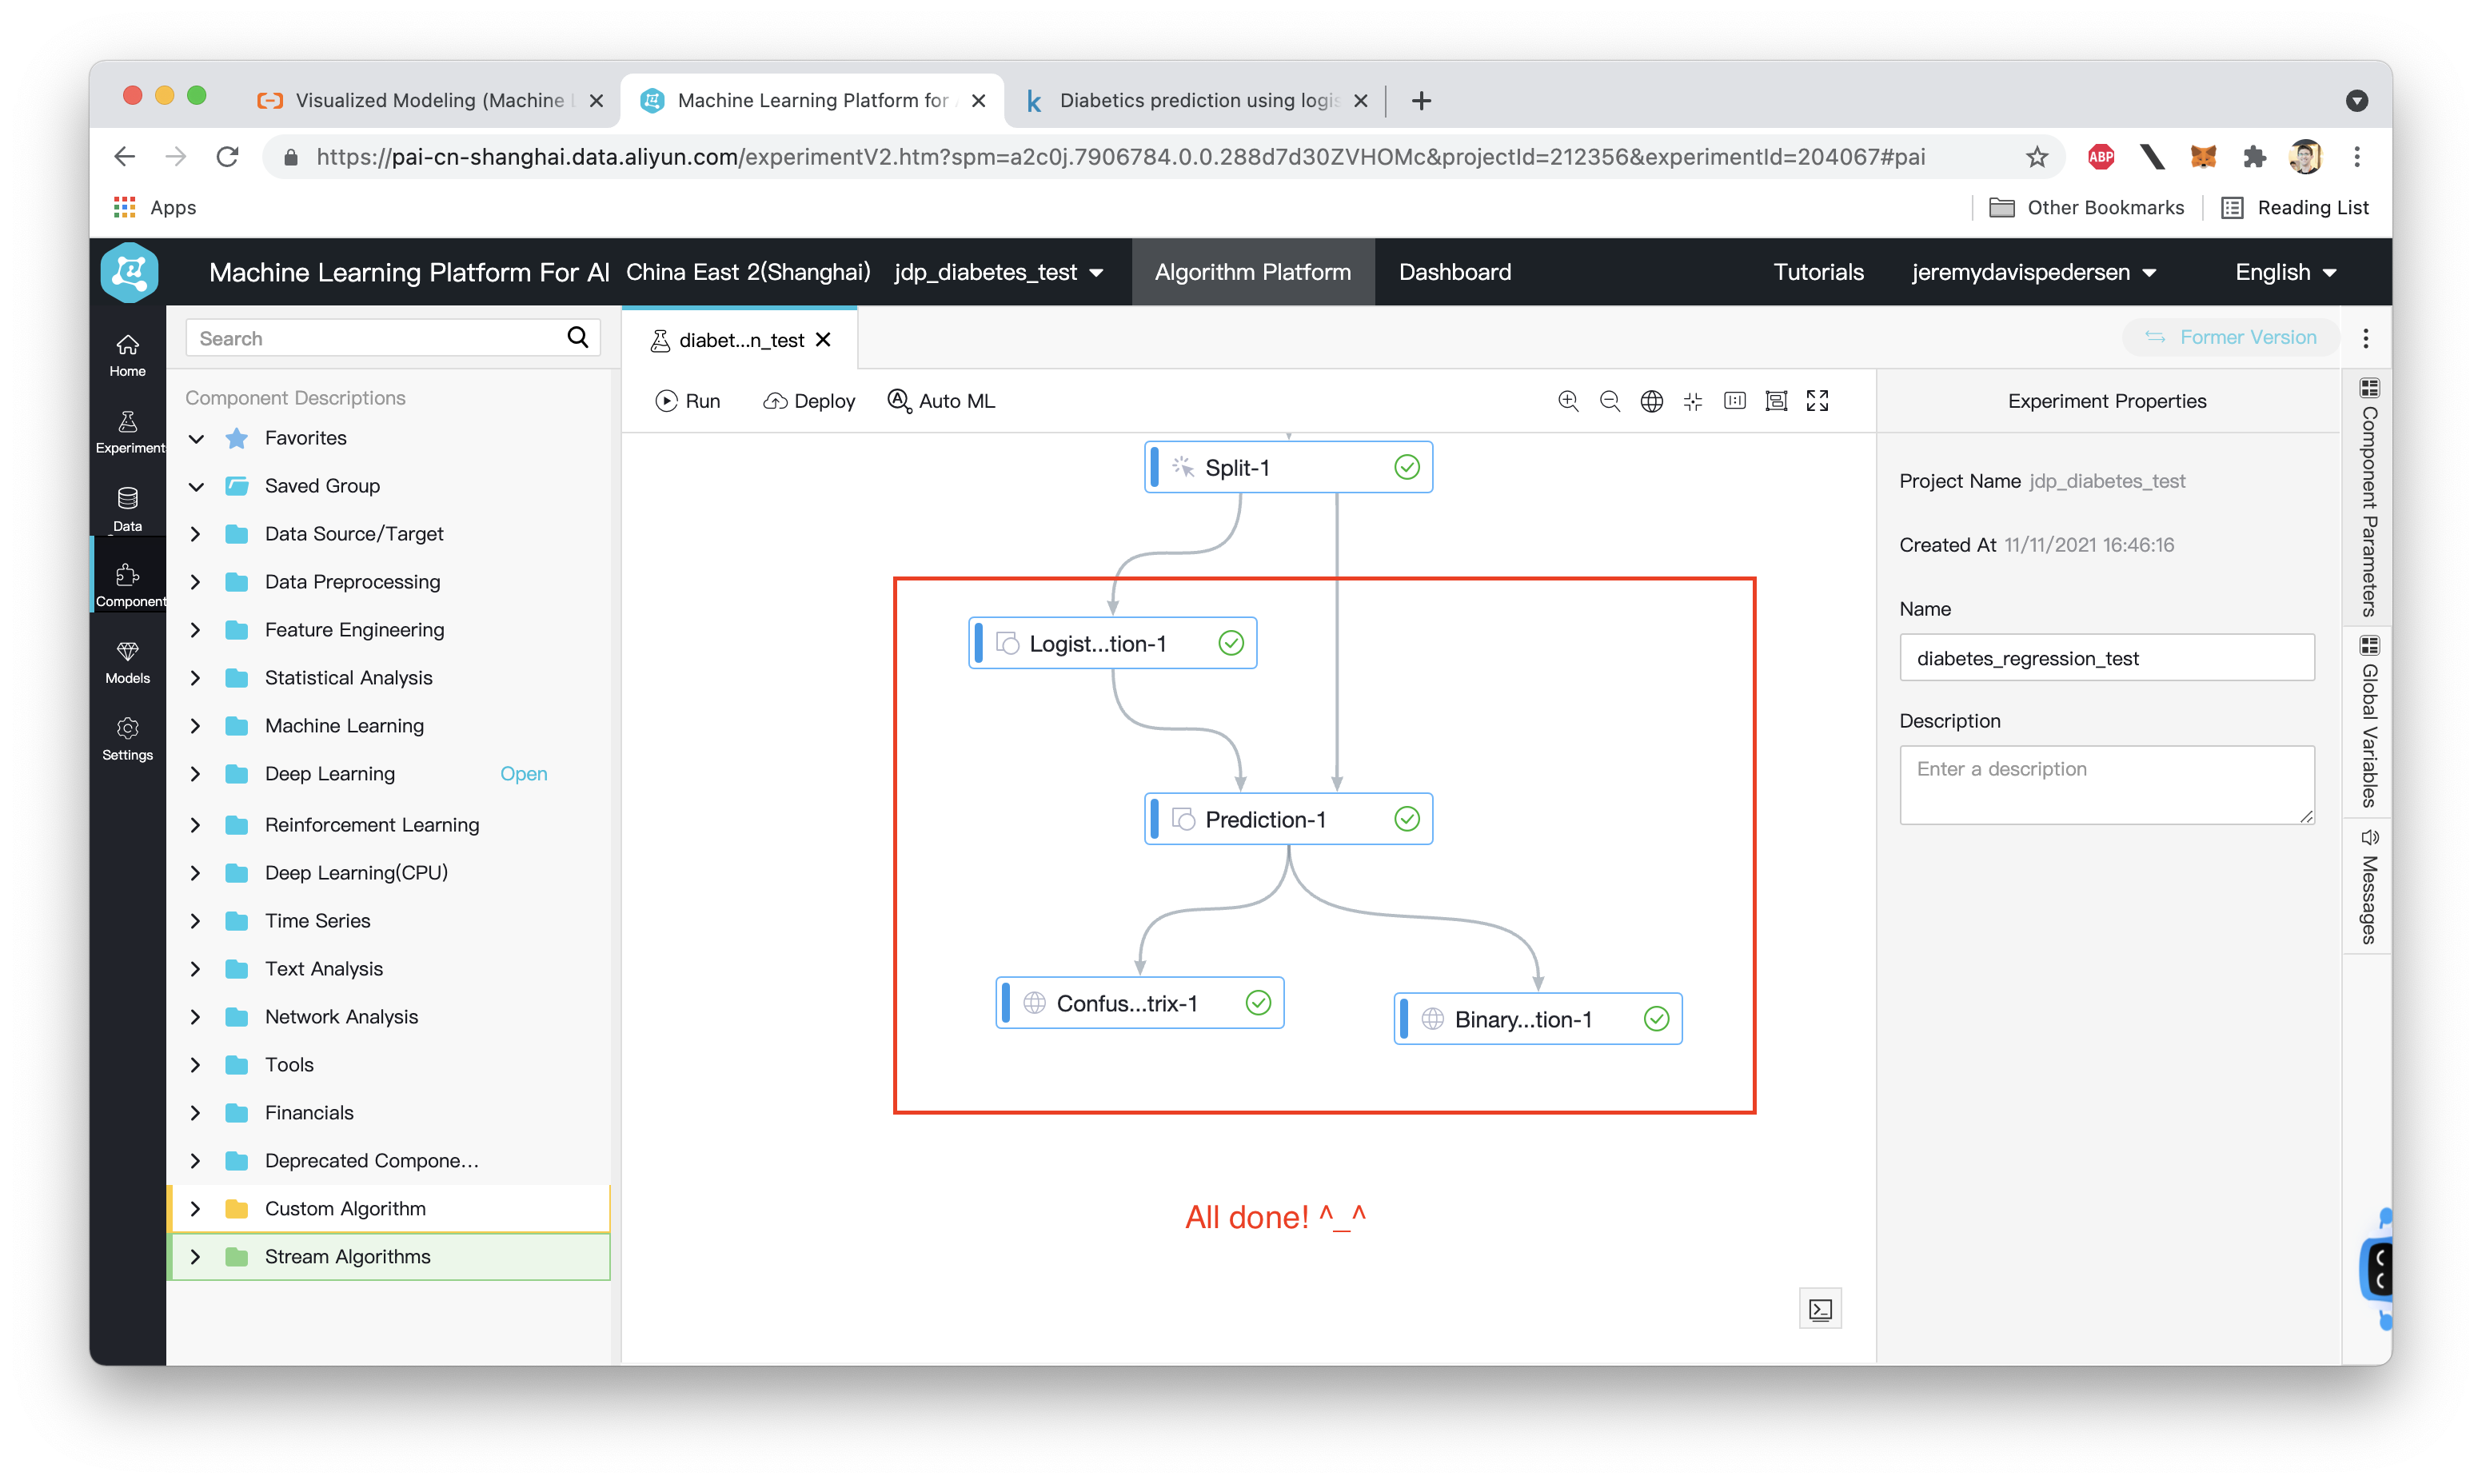
If everything runs successfully, green check marks will appear next to each node, like so:
We can now take a look at the confusion matrix as well as some of the charts (such as ROC and precision/recall) generated by the "Confusion Matrix" and "Binary Classification Evaluation" nodes. First, the Confusion Matrix:
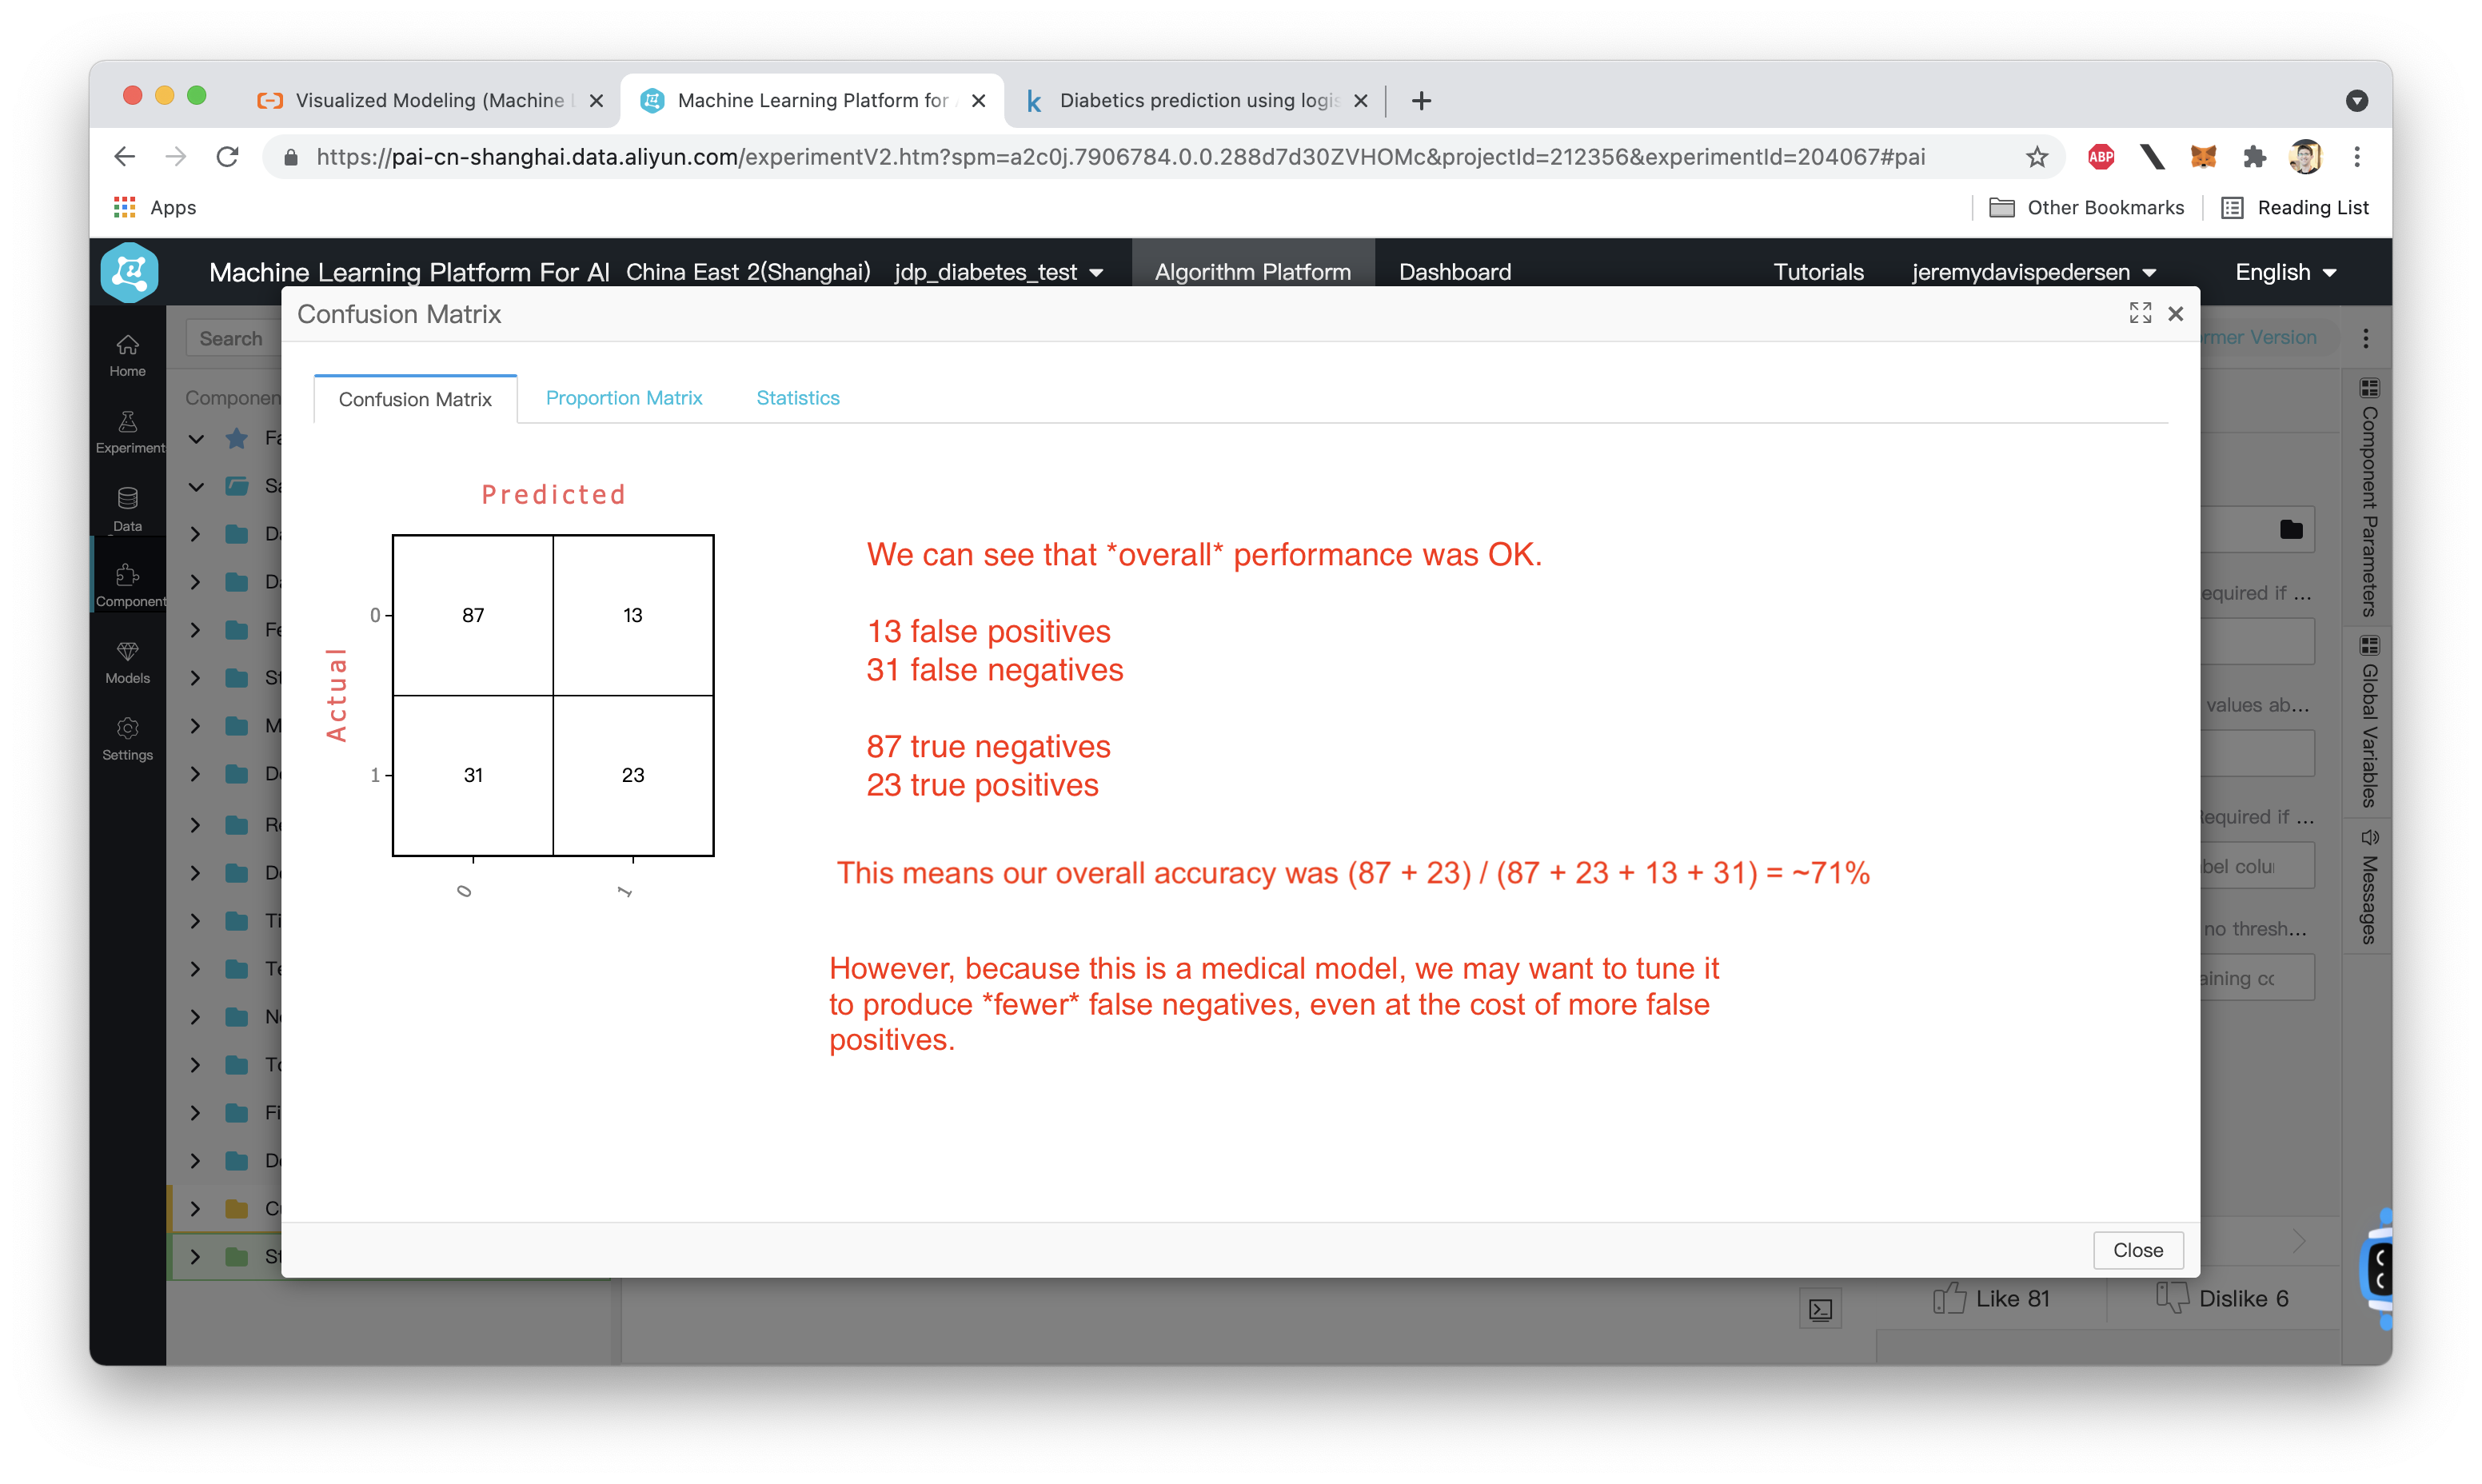
Next, let's look at the ROC curve, and evaluate the AUC (area under curve) which gives us a rough idea how accurate the model is:
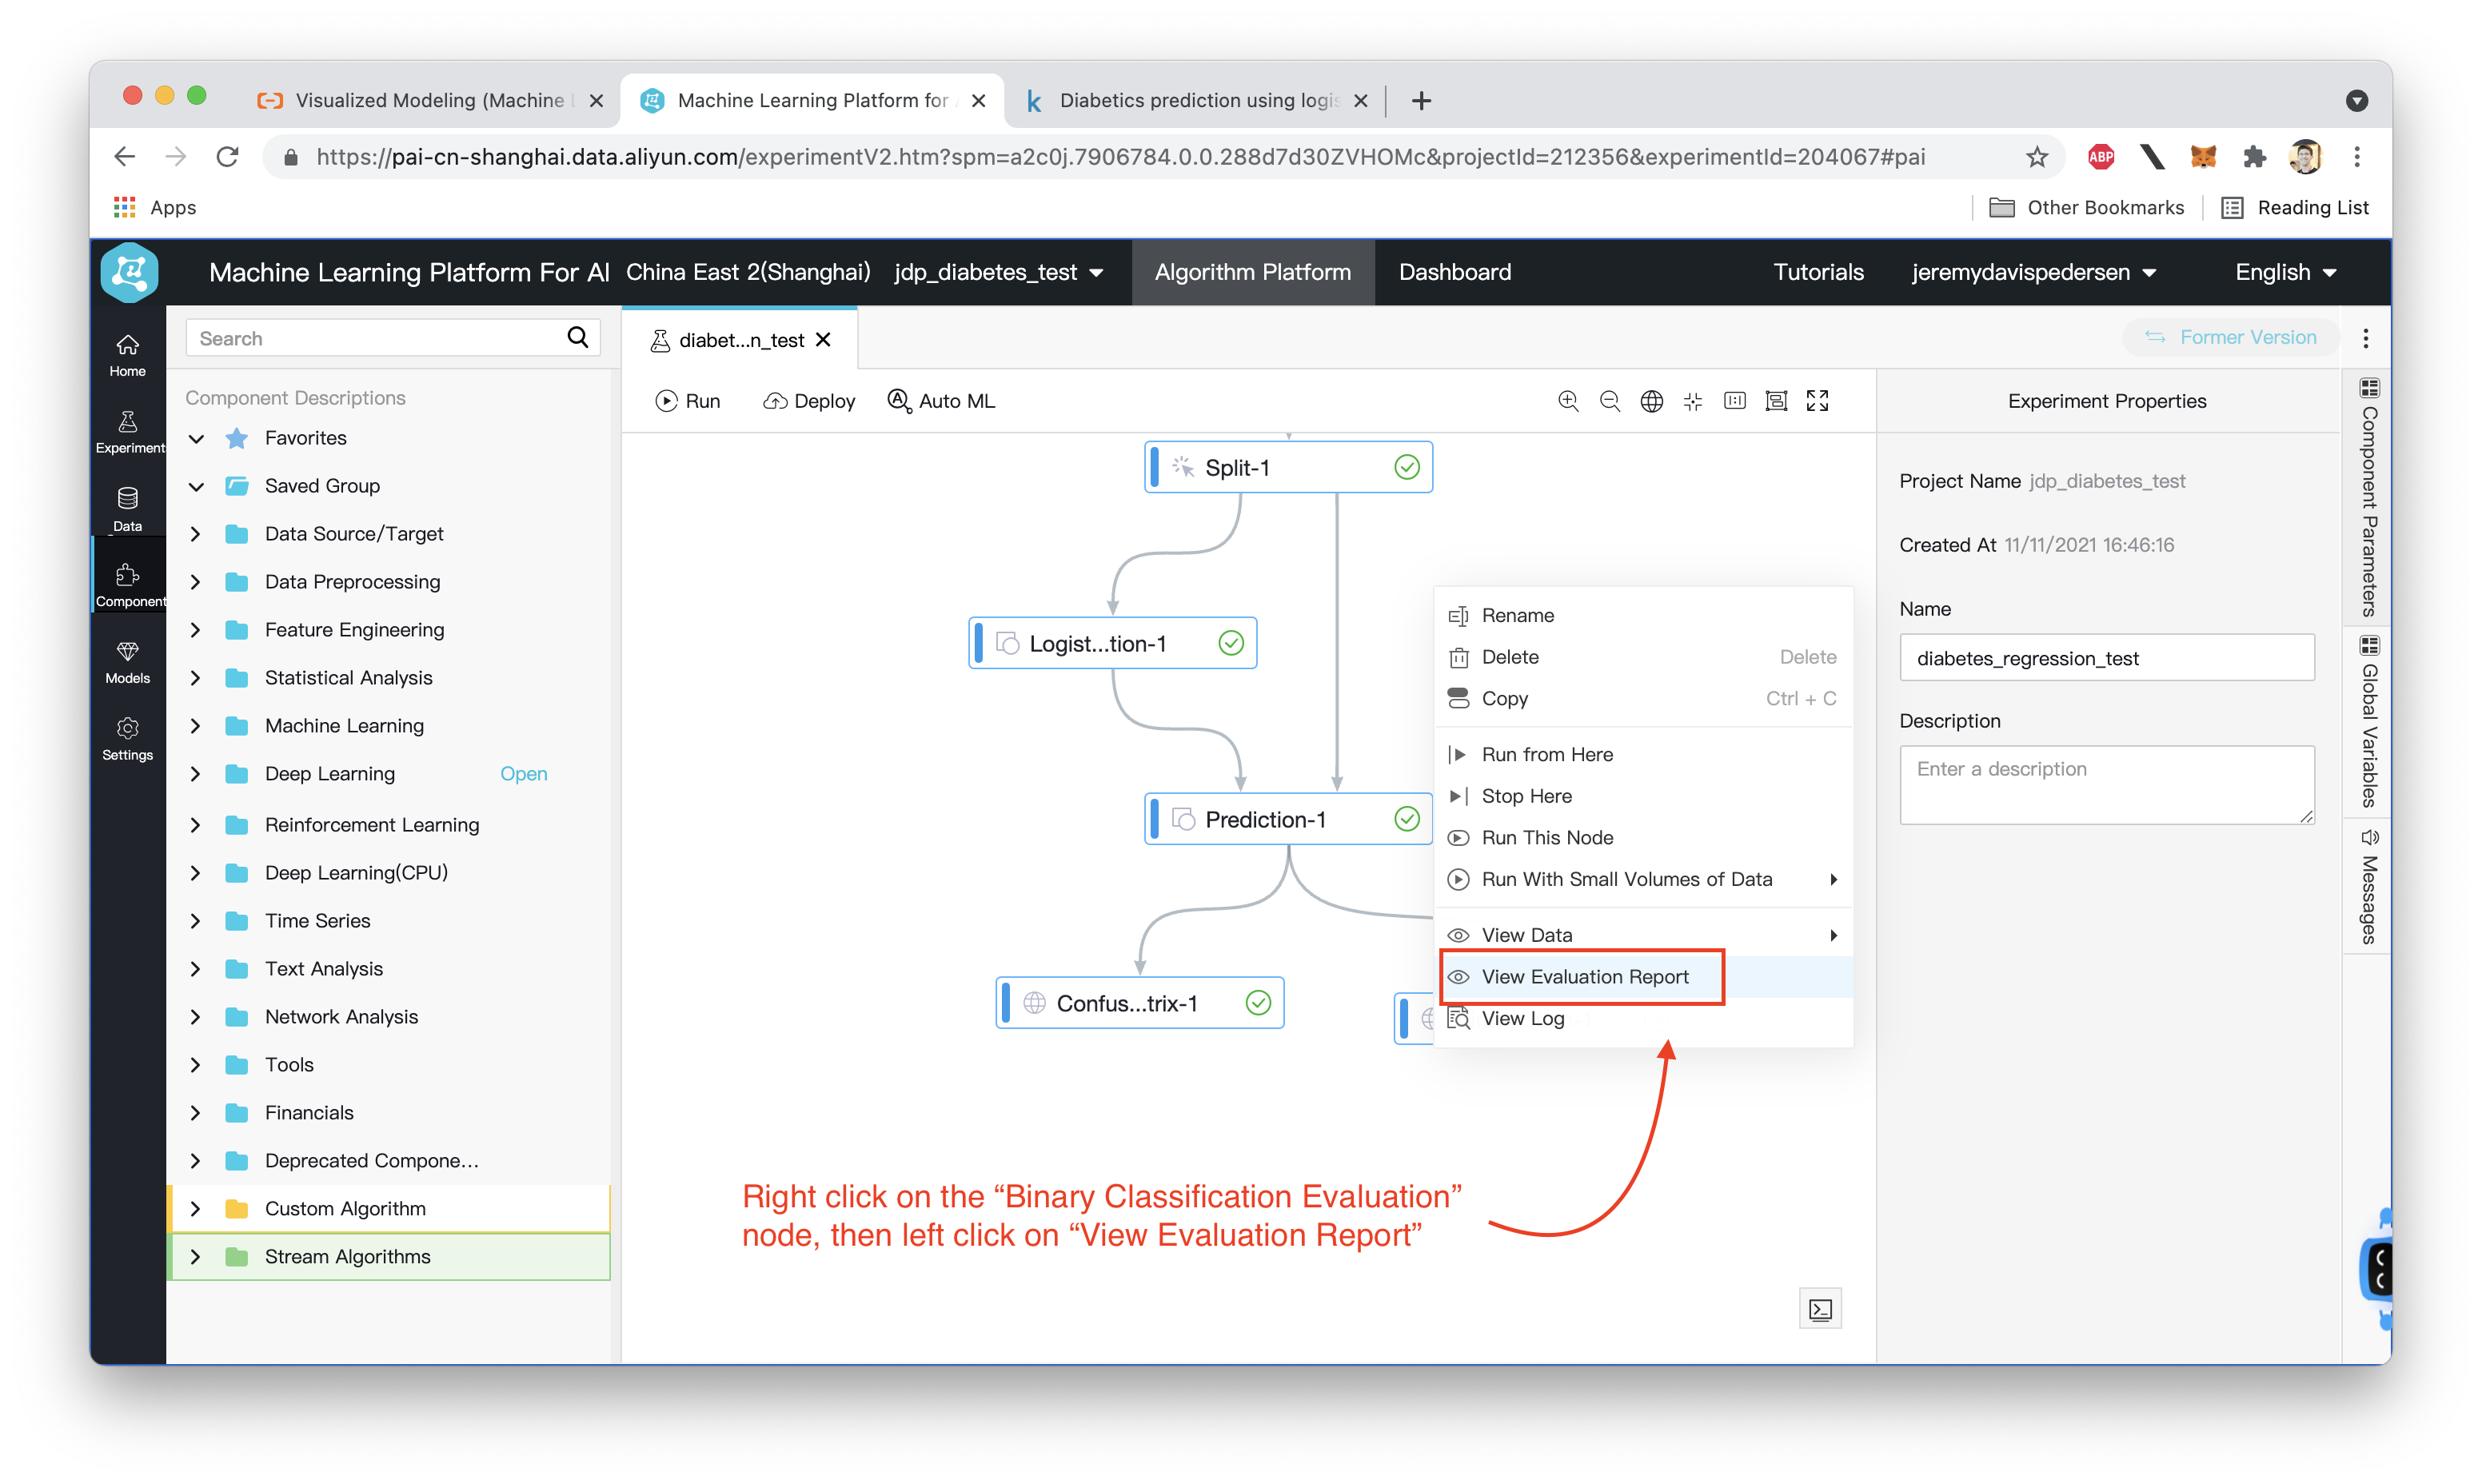
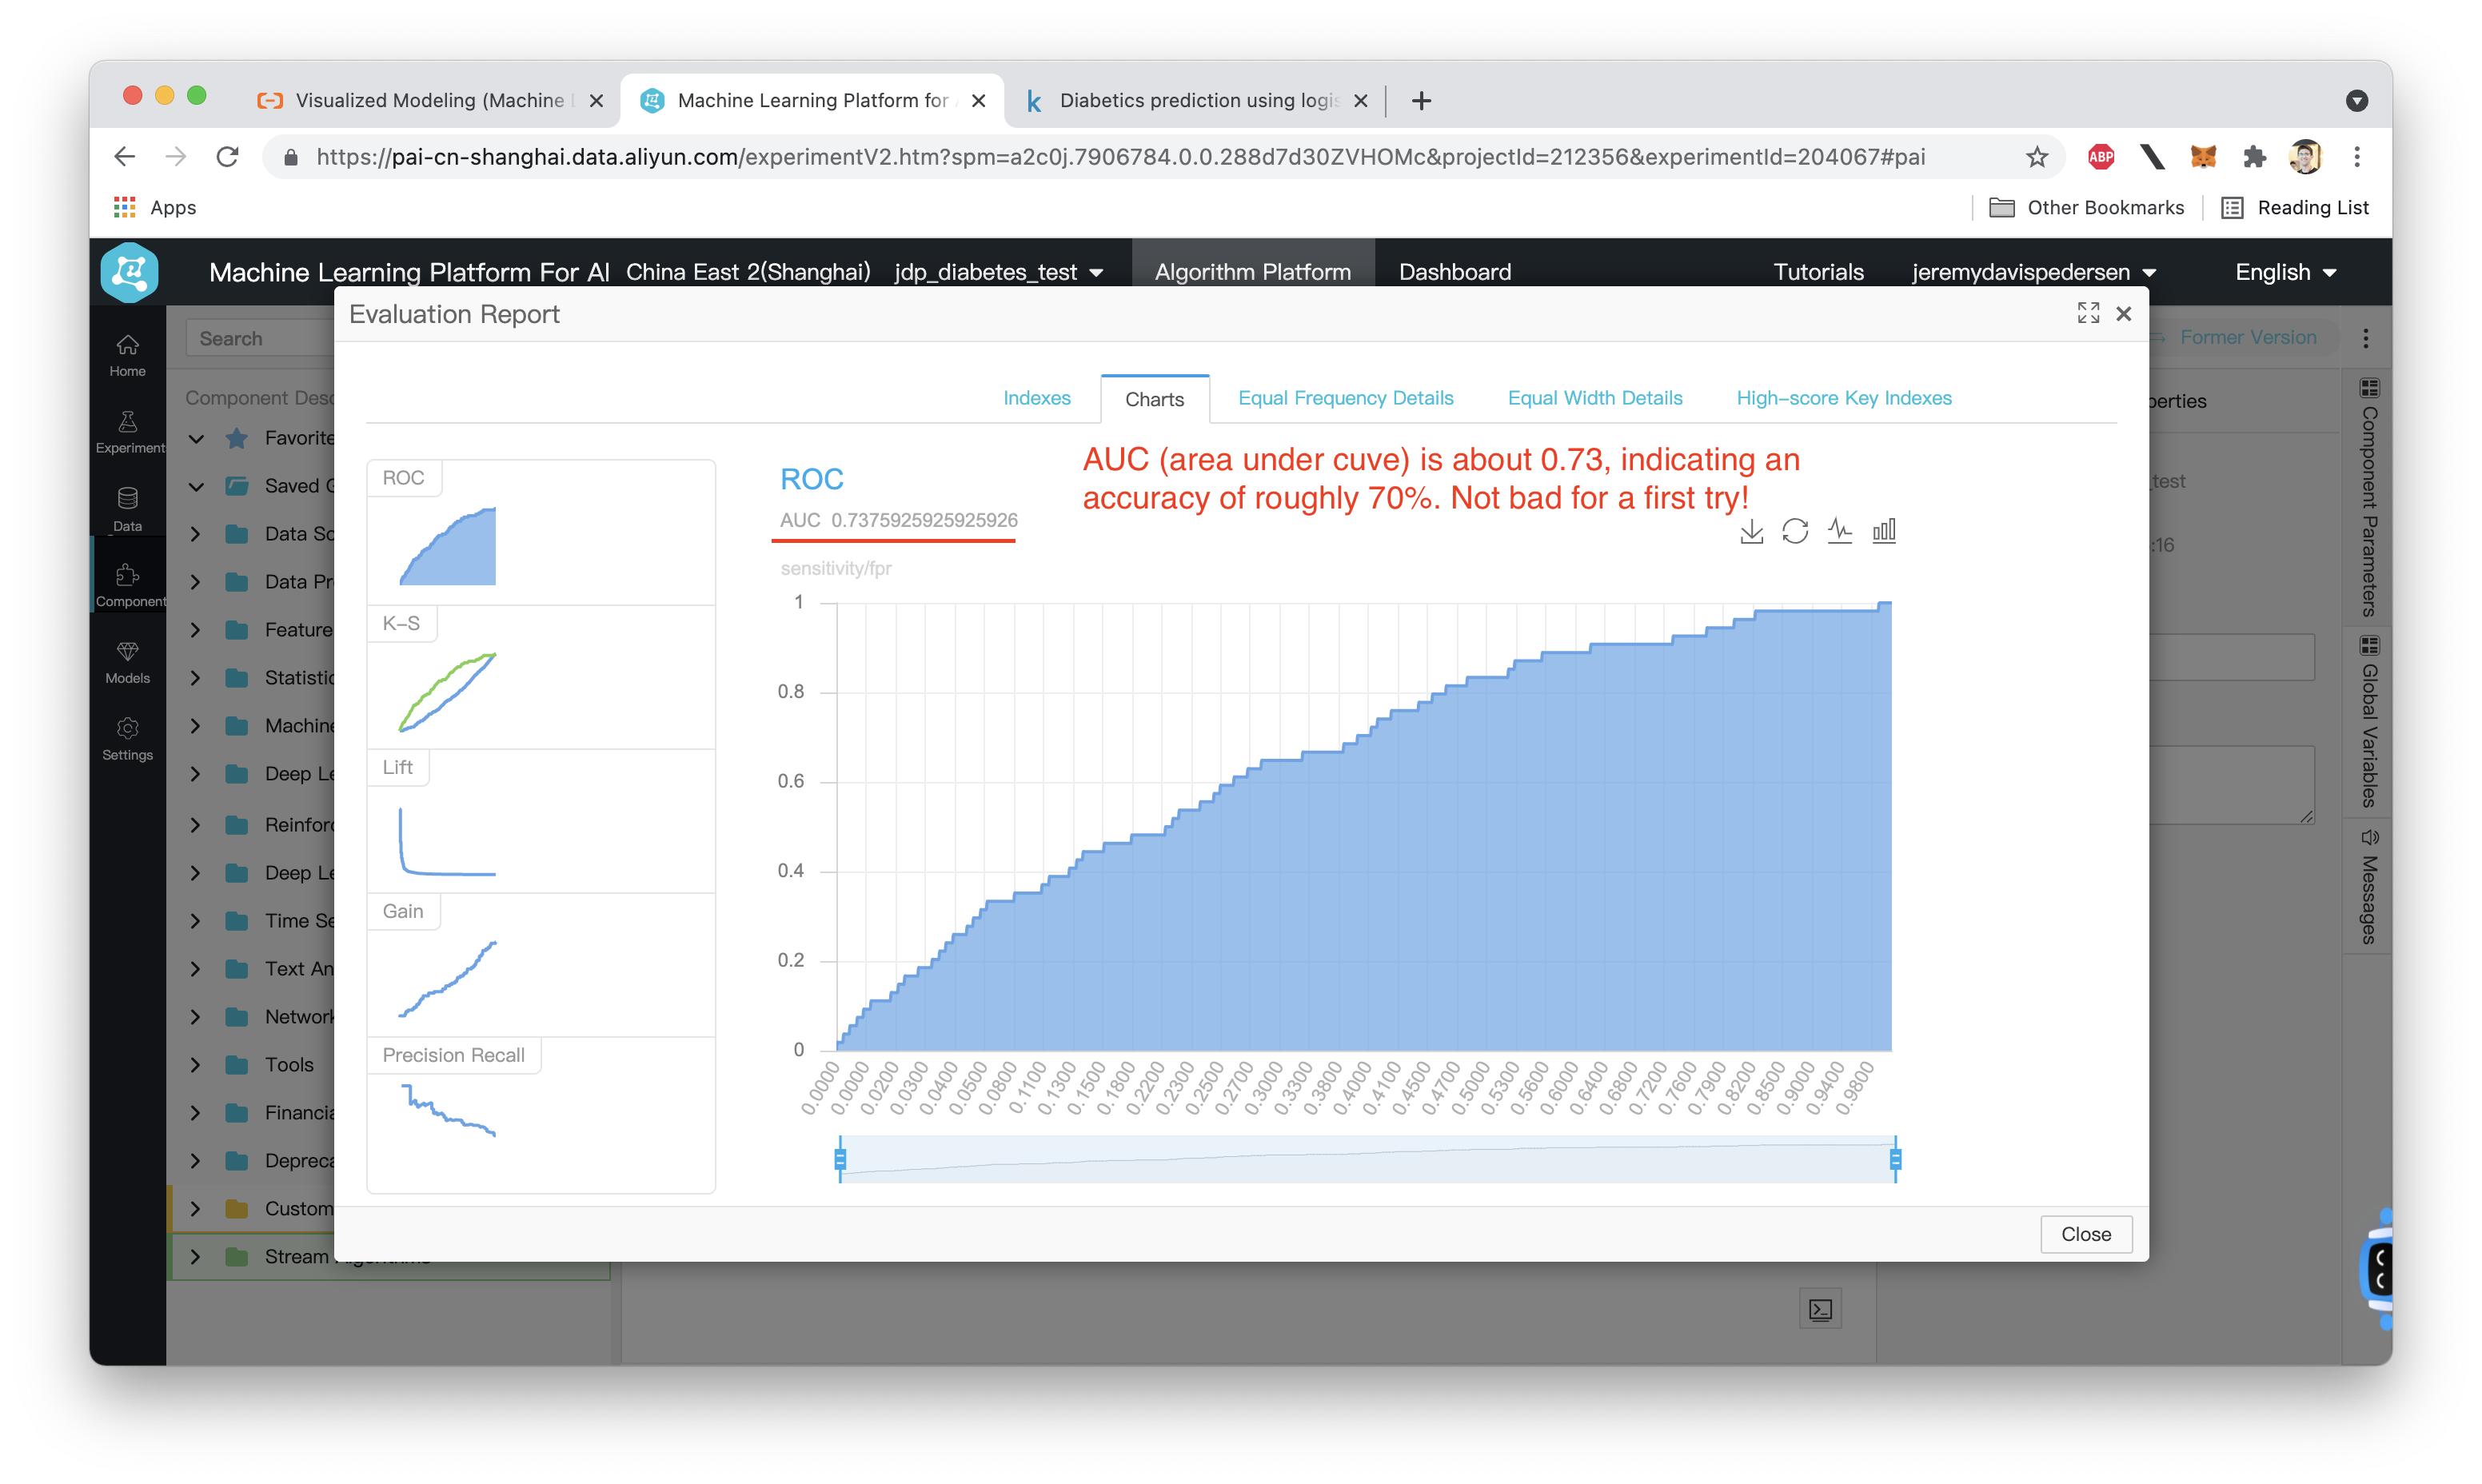
Not bad! This model is OK for a first try, with an accuracy of around 70% on the test data. We could play around with PAI's AutoML feature to adjust the parameters of our Logistic Regression model and try for better accuracy. You can learn more about AutoML in this blog post. We could also experiment with different models such as GBDT (Gradient Boosting Decision Tree) to see if we can get higher accuracy.
Great! Reach out to me at jierui.pjr@alibabacloud.com and I'll do my best to answer in a future Friday Q&A blog.
You can also follow the Alibaba Cloud Academy LinkedIn Page. We'll re-post these blogs there each Friday.
Friday Blog - Week 35 - "The Price Is Right": Understanding CDN Pricing on Alibaba Cloud
JDP - October 28, 2021
JDP - June 18, 2021
JDP - December 23, 2021
JDP - June 11, 2021
JDP - November 19, 2021
JDP - April 15, 2022
 Platform For AI
A platform that provides enterprise-level data modeling services based on machine learning algorithms to quickly meet your needs for data-driven operations.
Learn More Epidemic Prediction Solution
This technology can be used to predict the spread of COVID-19 and help decision makers evaluate the impact of various prevention and control measures on the development of the epidemic.
Learn More Machine Translation
Relying on Alibaba's leading natural language processing and deep learning technology.
Learn More Managed Service for Prometheus
Multi-source metrics are aggregated to monitor the status of your business and services in real time.
Learn MoreMore Posts by JDP