After you enable the log delivery feature for the protected objects of Web Application Firewall (WAF), you can query and analyze the logs of the protected objects. You can then generate charts and configure alerts based on the query and analysis results.
Prerequisites
The Simple Log Service for WAF feature is enabled. For more information, see Enable or disable the Simple Log Service for WAF feature.
Web services are added to WAF 3.0 as protected objects. For more information, see Configure protected objects and protected object groups.
The log delivery feature is enabled for the protected objects of WAF. For more information, see Manage log delivery status.
Query and analyze logs
Log on to the WAF 3.0 console. In the top navigation bar, select the resource group and region of the WAF instance. You can select Chinese Mainland or Outside Chinese Mainland.
In the left-side navigation pane, choose .
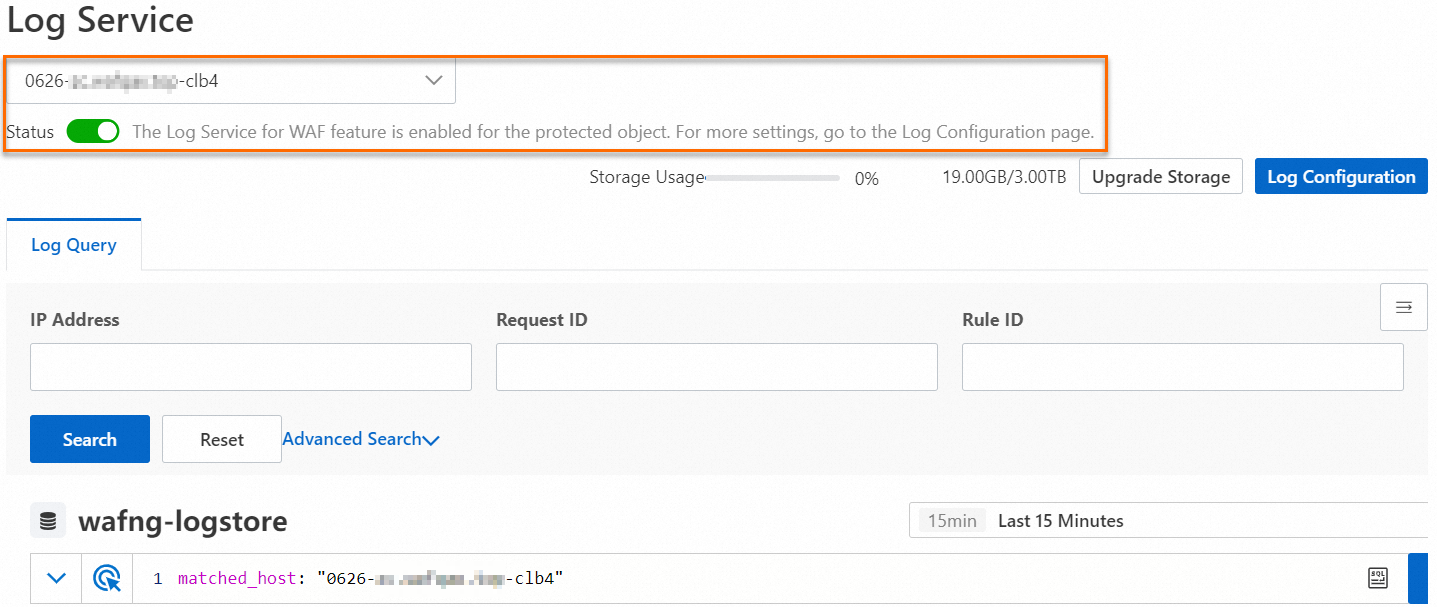
In the upper part of the Log Service page, select the protected object whose logs you want to query.
ImportantMake sure that the log delivery feature is enabled for the protected object (the Status switch is turned on). If the log delivery feature is disabled for the protected object, WAF does not collect the logs of the protected object, and you cannot query or analyze the logs of the protected object. To enable the log delivery feature for a protected object, you can search for and click the name of the protected object on this page, and then turn on the Status switch. You can also go to the Log Configuration page, click the Delivery Settings tab, and manage the log delivery status of all protected objects in the Status of Delivery to Simple Log Service column. For more information, see Manage log delivery status.
Enter a query statement. Then, execute the statement to query and analyze the logs of the protected object that you selected.
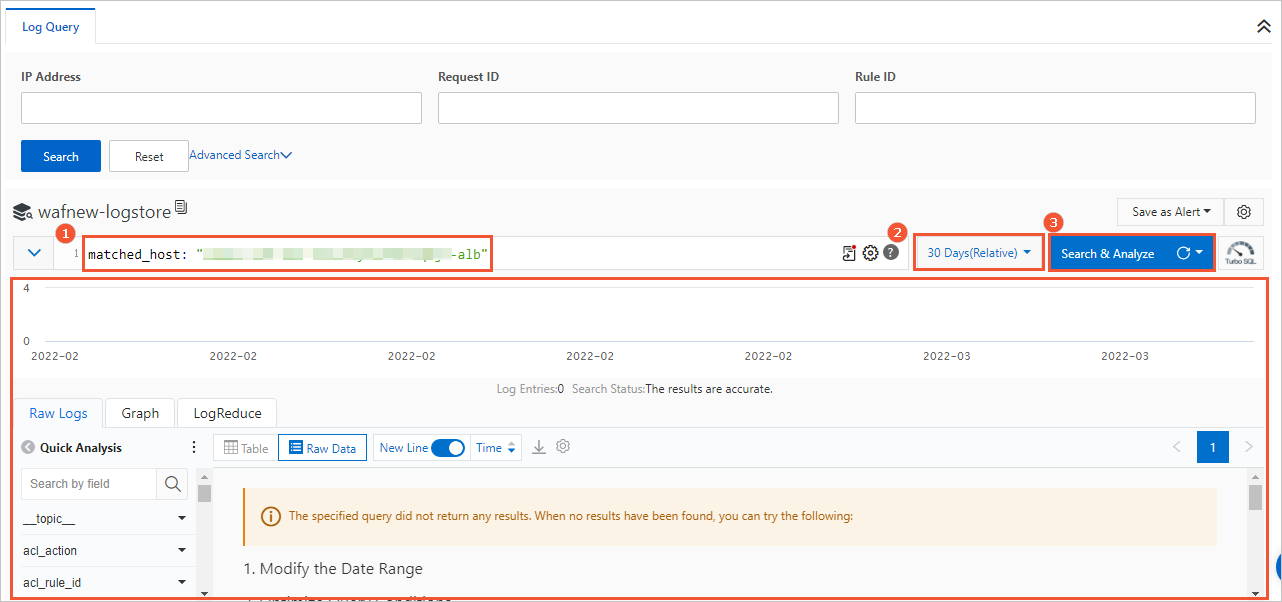
To query and analyze the logs of the protected object, perform the following steps:
Enter a search statement in the search box (labeled 1 in the figure).
You must write the search statement based on the syntax that is specific to Alibaba Cloud Simple Log Service. For more information about the syntax, see Search syntax. You can include the fields of WAF logs in the search statement as search fields. For more information about the log fields that are supported by WAF, see Log fields.
If you are not familiar with the search syntax, we recommend that you click Advanced Search. You can click Advanced Search above the search box. Then, specify search conditions and click Search. A search statement is automatically generated in the search box based on the search conditions.
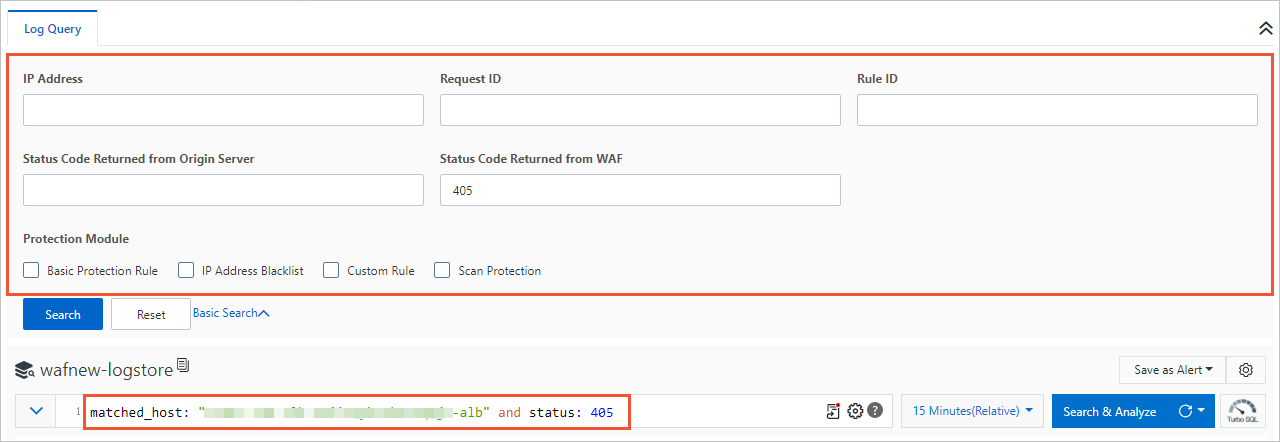 The following table describes the search conditions that you can specify.
Search condition
Description
IP
The IP address of the client that sends the request.
Request ID
The unique identifier that WAF generates for the client request. The request ID is provided when WAF returns a block page or a response page to the client. The response page prompts the client to complete slider CAPTCHA verification. You can use the request ID to analyze and troubleshoot errors.
Rule ID
The ID of the WAF protection rule that matches the request. You can go to the Rule Configuration page to query the ID of a specific rule, or go to the Security Reports page to obtain the ID of the rule that matches the request from rule match records or statistics. For more information, see Security reports.
Status Code Returned From Origin Server
The HTTP status code that is sent by the origin server in response to the request forwarded by WAF.
Status Code Returned From WAF
The HTTP status code that is included in the response from WAF to the client.
Protection Module
The WAF protection module that matches the request. For more information about WAF protection modules and how to configure the modules, see Protection configuration overview.
If you want to perform calculation and statistical operations on the search results, append an analytic statement to the search statement in the search box (labeled 1 in the figure). If you do not want to analyze the search results, skip this step.
Separate the analytic statement and search statement with a vertical bar (|). Write the analytic statement based on the standard SQL-92 syntax. For more information about analytic statements, see Log analysis overview.
Specify the time range to query logs by using the time picker (labeled 2 in the figure).
Click Search & Analyze (labeled 3 in the figure).
In the lower part of the page, you can view the query and analysis results (the WAF logs that match the query conditions) in a log distribution histogram and on the Raw Logs, Graph, and LogReduce tabs. You can perform various operations based on the query and analysis results. For example, you can perform quick analysis, generate charts, and configure alerts. For more information, see Description of the Search & Analyze page.
Description of the query and analysis page
Page overview
Histogram
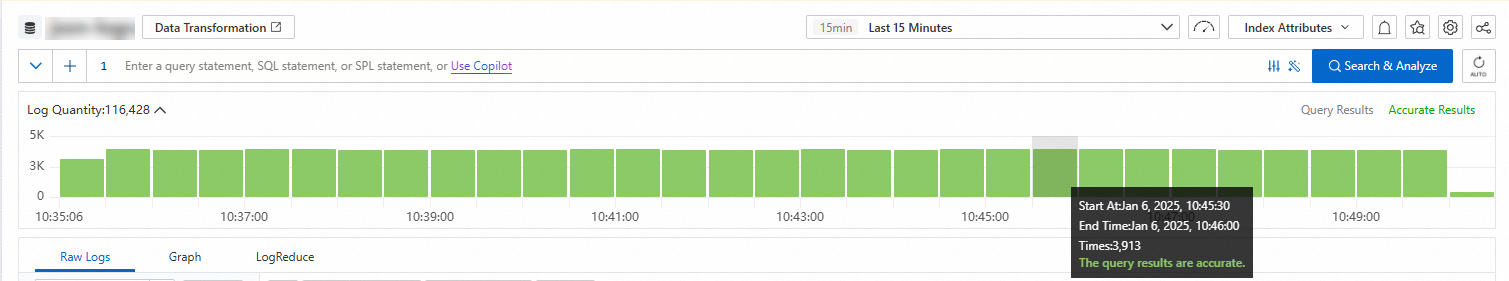
When you move the pointer over a green rectangle, you can view the period of time that is represented by the rectangle and the number of returned logs within the period of time.
If you double-click a green rectangle, you can view log distribution in a finer-grained manner. You can also view the returned logs within the specified period of time on the Raw Logs tab.
Raw Logs
Log details
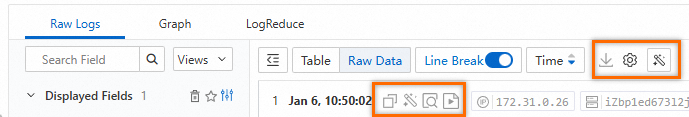
Click Table or Raw Data to switch between the display formats of logs.
 > Download Log: allows you to download logs to your computer. For more information, see Download logs.
  > JSON Configurations: allows you to specify the display type of JSON and the level of JSON expansion.
 - > Event Settings: allows you to configure events for raw logs. For more information, see Event settings.
 : allows you to copy log content.
  : allows you to label specific information or query error information in log content. This icon also serves as a copilot.
  : allows you to view the context information of a specific log in the raw log file. You can use contextual query only on the logs that are collected by Logtail. For more information, see Contextual query.
  : allows you to monitor log content in real time and extract key log information. You can use LiveTail only on the logs that are collected by Logtail. For more information, see LiveTail.
Displayed fields
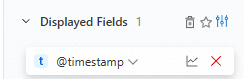
Below Displayed Fields, move the pointer over a field and click the
 icon to remove the field from Displayed Fields. Then, the field is no longer displayed in the log content on the right side.
  : allows you to add a view to your favorites. After fields are displayed in Section 5, you can add the current view to your favorites. Then, you can select the view from the drop-down list above Section 4.
  > Tag Settings: allows you to add fields as system tags.
 - > Alias: After you turn on Alias, the names of fields are replaced with aliases. If you do not specify an alias for a field, the name of the field is retained. For more information about how to specify an alias for a field, see Create indexes.
Indexed fields
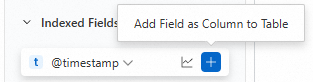
Below Indexed Fields, move the pointer over a field and click the
 icon to add the field to Displayed Fields. Then, the field is displayed in the log content on the right side.
  : allows you to view field details, including Basic Distribution and Statistical Metrics. For more information, see Field settings.
Graph
Simple Log Service renders the results of a query statement to charts. Simple Log Service provides various types of charts, such as tables, line charts, and column charts. For more information, see Charts. After you execute a query statement, you can view the query and analysis results on the Graph tab. 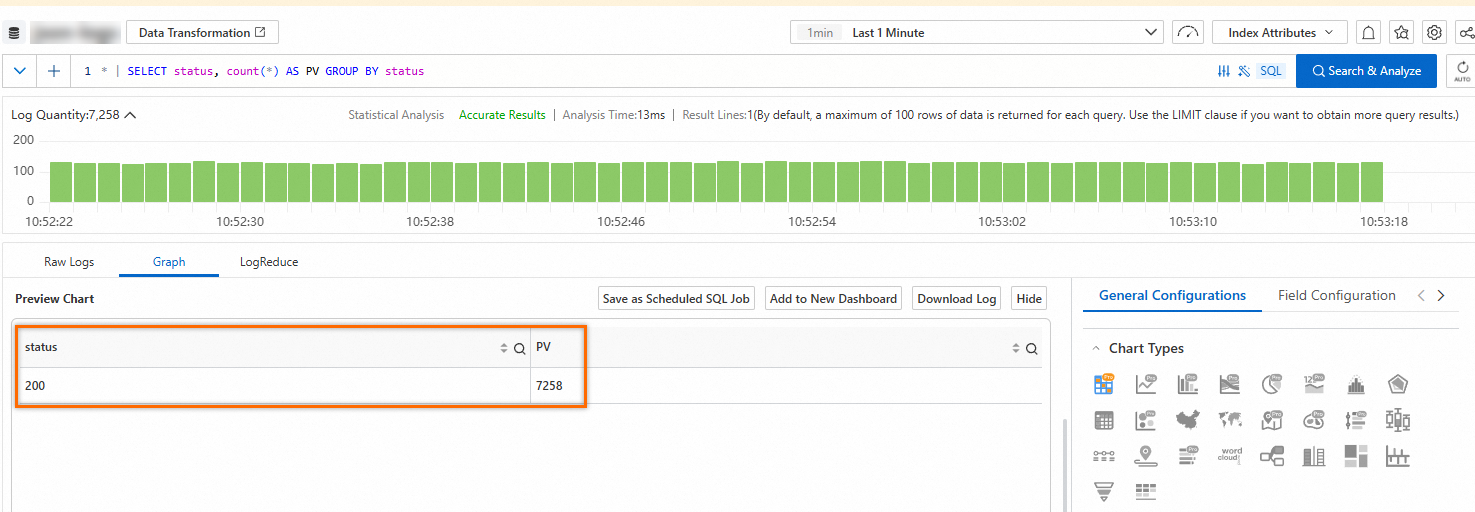
Description of other features on the Graph tab:
Add to New Dashboard: Simple Log Service provides dashboards on which you can analyze data in real time. You can click Add to New Dashboard to save the query and analysis results as a chart to a dashboard. For more information, see Overview of visualization.
Save as Scheduled SQL Job: Simple Log Service provides the Scheduled SQL feature. You can use the feature to automatically analyze data at a scheduled time and aggregate data for storage. You can also use the feature to project and filter data. For more information, see How Scheduled SQL works.
Interaction Occurrences: Interaction occurrences are important for data analysis. You can use interaction occurrences to switch between the levels of data dimensions and the analysis granularities to obtain more detailed information. For more information, see Configure an interaction occurrence for a dashboard to perform drill-down analysis.
LogReduce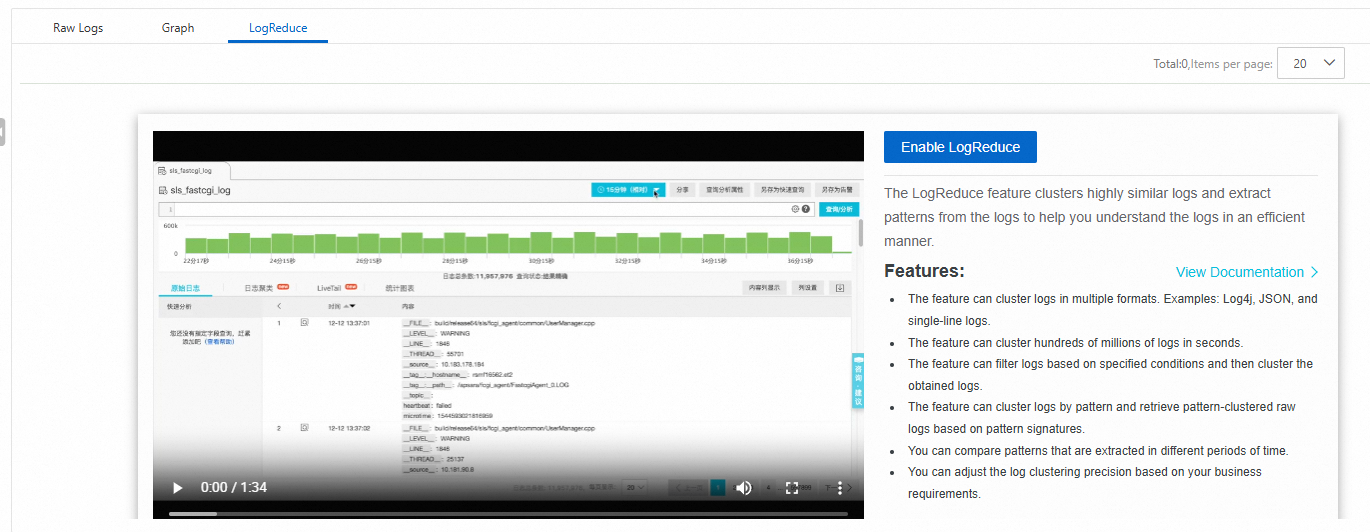
On the LogReduce tab, you can click Enable LogReduce to cluster similar logs during log collection. For more information, see LogReduce.
SQL Enhancement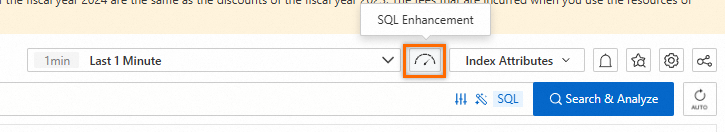
You can click the ![]() icon in the upper-right corner to enable Dedicated SQL. If you use the Standard SQL feature to analyze a large amount of data that is generated over a period of time, Simple Log Service cannot analyze all data in a single query request. You can enable the Dedicated SQL feature to increase computing resources and the amount of data that can be analyzed in a single query request. For more information, see Enable Dedicated SQL.
icon in the upper-right corner to enable Dedicated SQL. If you use the Standard SQL feature to analyze a large amount of data that is generated over a period of time, Simple Log Service cannot analyze all data in a single query request. You can enable the Dedicated SQL feature to increase computing resources and the amount of data that can be analyzed in a single query request. For more information, see Enable Dedicated SQL.
Alerting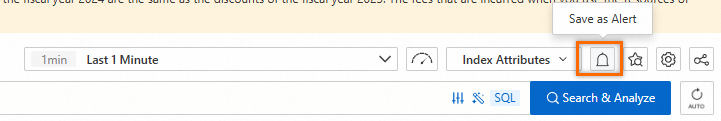
You can click the  icon in the upper-right corner to configure alerts for the query and analysis results. For more information, see Configure an alert rule in Simple Log Service.
Saved search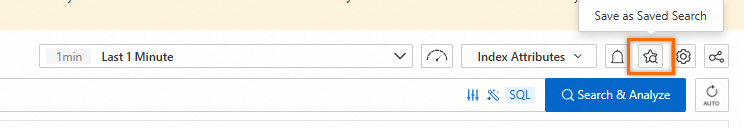
You can click the  icon in the upper-right corner to save a query statement as a saved search. You can use a saved search to quickly perform query and analysis operations. For more information, see Saved search.
Sharing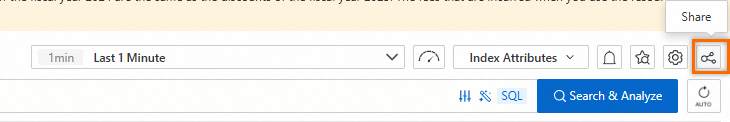
You can click the  icon in the upper-right corner to copy the link to the current page and share the link with other users. For more information, see Embed console pages and share log data.