When a VPN gateway instance runs in dual-tunnel mode, the system automatically creates elastic network interfaces (ENIs) in the vSwitches of your VPC to handle traffic between the VPC and the gateway. Capture flow logs for those ENIs and query them in Simple Log Service (SLS) to identify which hosts are communicating, how much bandwidth each pair consumes, and which direction traffic is flowing.
How it works
The following diagram shows the example setup used in this topic: two VPCs connected through an IPsec-VPN connection, with flow logs enabled on the ENIs of VPN gateway 1.

To set up a VPC-to-VPC IPsec-VPN connection in dual-tunnel mode before following this topic, see Create a VPC-to-VPC IPsec-VPN connection (dual-tunnel mode).
ENI count by feature combination:
| Enabled features | ENIs created |
|---|---|
| IPsec-VPN only | 2 |
| SSL-VPN only | 2 |
| IPsec-VPN and SSL-VPN | 4 |
In this example, only IPsec-VPN is enabled, so the system creates two ENIs.
Traffic direction in flow log records:
| Value | Meaning |
|---|---|
in | Traffic from the VPC to the ENI |
out | Traffic from the ENI to the VPC |
Prerequisites
Before you begin, make sure that you have:
A VPN gateway instance in dual-tunnel mode
Simple Log Service activated
Step 1: Find the ENI IDs
After you create a VPN gateway instance in dual-tunnel mode, the instance details page lists the system-created ENIs.
Log on to the VPN gateway console.
In the top navigation bar, select the region where the VPN gateway instance resides.
On the VPN Gateways page, click the ID of the target VPN gateway instance.
In the Basic Information section, note the IDs and names of the system-created ENIs.

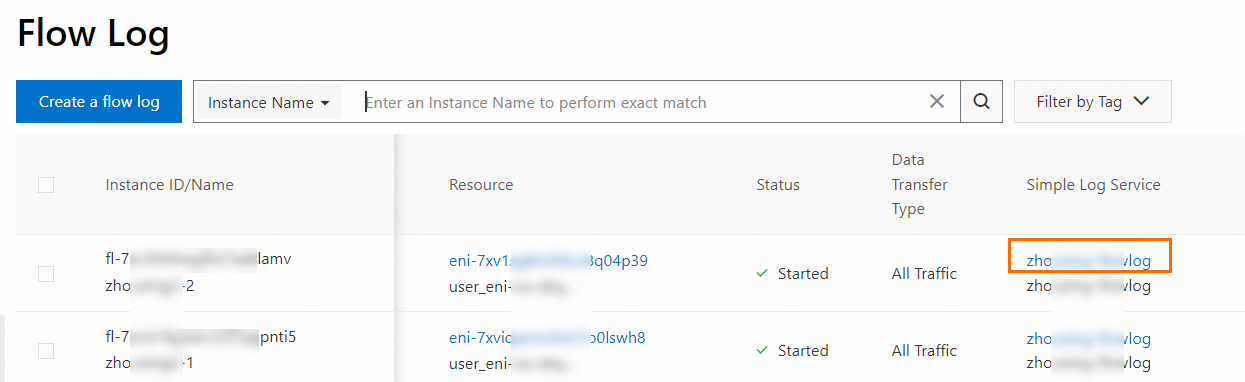
Step 2: Create a flow log
Flow logs are enabled by default upon creation and immediately start recording traffic. For details on all flow log fields, see Introduction to flow logs.
Go to the Flow Log page in the VPC console and click Create a flow log. If this is your first time using flow logs, click Activate Now.
In the Create a flow log dialog box, configure the following parameters and click OK: For all other parameters, keep the default values. For a full parameter reference, see Create a flow log.
Parameter Value for this example Notes Resource Type ENI Captures traffic at the network interface level Resource Instance ENI of the VPN gateway instance Select from the ENIs identified in Step 1 Data Transfer Type All Traffic Logs all traffic. Choose Allowed Traffic or Denied Traffic to filter by security group and network ACL rules Project Create Project Creates a new SLS project to manage the flow logs Logstore Create Logstore Deliver all ENI logs for VPN gateway 1 to the same Logstore to centralize analysis Enable Log Analysis Report Enabled Enables indexing and creates a dashboard, allowing SQL queries and data visualization. Indexing is billed based on data usage; dashboards are free Sampling Interval (Minutes) 1 minute Controls how frequently traffic data is captured. A shorter interval produces more granular data but increases log volume
Step 3: Query and analyze flow logs
Flow log data is automatically delivered to Simple Log Service. Use the SLS console to run queries and visualize traffic patterns.
Log on to the VPC console.VPC console
In the left-side navigation pane, choose O&M and Monitoring > Flow Log.
In the top navigation bar, select the region where the flow log was created.
On the Flow Log page, find the flow log and click the Logstore name in the Simple Log Service column. The SLS console opens automatically.
On the Logstore details page, query and analyze ENI logs to identify VPN gateway traffic patterns.
Example: identify top communicating hosts
This query returns the hosts communicating through each ENI, the traffic direction, and the total bytes transferred for each host pair.
Query statement:
* | select "eni-id",srcaddr,dstaddr,direction,sum(bytes) as byte from log GROUP BY "eni-id",srcaddr,dstaddr,direction ORDER BY "eni-id" DESC limit 10Procedure:
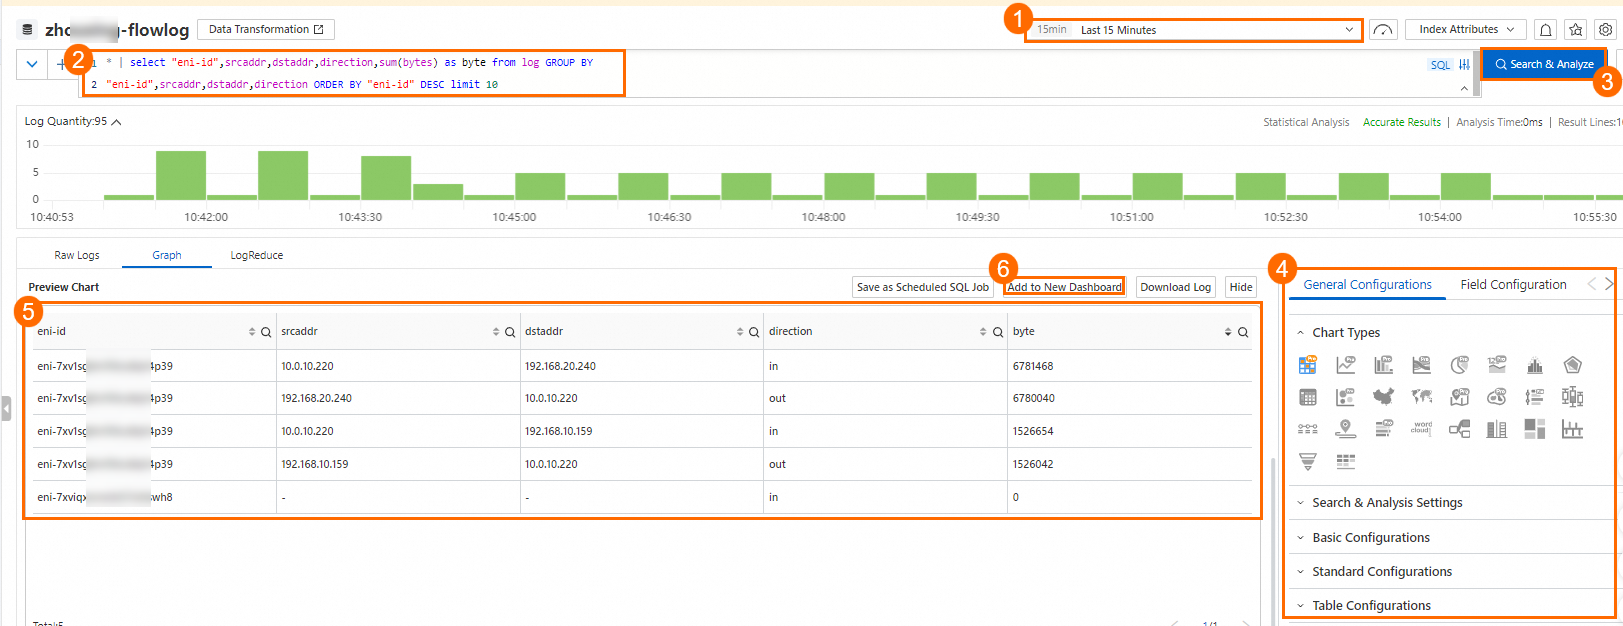
| Step | Action |
|---|---|
| ① | Select the time range for the query |
| ② | Enter the SQL query |
| ③ | Click Search & Analyze |
| ④ | On the General Configurations tab, keep the default settings for all modules. Customize the chart display as needed — see Overview of charts |
| ⑤ | In the Preview Chart section, review and filter the results. Example insights from VPN gateway 1: VPN gateway 1 is transferring traffic through eni-7xv1sg8m****39. ECS2 in VPC1 has not communicated in the last 15 minutes. ECS1 and ECS4 consumed significant bandwidth in the last 15 minutes |
| ⑥ | (Optional) Click Add to New Dashboard to save the query results as a persistent dashboard view. Set Operation to Create Dashboard, Layout Mode to Grid Layout, and enter a Dashboard Name (for example, VPN gateway 1). See Dashboards for details |
Other query scenarios
Adapt the SQL to answer other questions about your VPN gateway traffic:
Top bandwidth consumers: Sort by
sum(bytes) DESCto find which host pairs generate the most traffic.Per-ENI traffic split: Group by
"eni-id"only to compare traffic volume across the two ENIs and verify load distribution.Single-host activity: Add
WHERE srcaddr = '<IP>'to trace all connections from a specific host.
What's next
For more information about log query and analysis, see Index-based query and analysis.