When you use a VPN Gateway instance in dual-tunnel mode, the system creates elastic network interfaces (ENIs) in the VPC's VSwitch. These ENIs serve as interfaces for traffic between the VPC and the VPN Gateway. You can use the VPC flow log feature to record traffic for the VPN Gateway ENIs. Then, query and analyze these logs to understand the instance's traffic patterns, such as which hosts communicate through the gateway, access VPC resources, or generate high traffic.
Use case
This topic demonstrates how to use the VPC flow log feature to record, query, and analyze traffic from a VPN Gateway instance.
As shown in the following figure, two VPC instances are connected through an IPsec-VPN connection. This topic describes how to create a flow log for the ENIs of VPN Gateway instance 1 to record its traffic.
For information about how to connect two VPC instances by using an IPsec-VPN connection, see Establish a VPC-to-VPC IPsec-VPN connection (dual-tunnel mode).
Step 1: View VPN Gateway ENI information
After you create a VPN Gateway instance in dual-tunnel mode, you can view the system-created ENIs on the instance details page.
- Log on to the VPN gateway console.
In the top navigation bar, select the region where the VPN gateway instance resides.
-
On the VPN Gateways page, click the ID of the target VPN Gateway instance.
-
In the Basic Information section of the instance details page, view the IDs and names of the system-created ENIs.
NoteIf only the IPsec-VPN feature or only the SSL-VPN feature is enabled on a VPN Gateway, the system creates two ENIs in the VPC's VSwitch. If both the IPsec-VPN and SSL-VPN features are enabled, the system creates four ENIs.
In this topic, only the IPsec-VPN feature is enabled on the VPN Gateway instance.
Step 2: Create a flow log
Prerequisites Before you create a flow log, make sure that you have activated Simple Log Service.
Create a flow log for each ENI of VPN Gateway instance 1. After creation, the flow log is enabled by default and automatically starts recording traffic for the ENIs. For more information about the fields recorded in flow logs, see Introduction to flow logs.
-
Go to the Flow Log page in the VPC console and click Create a flow log.
If this is the first time you use the flow log feature, click Activate Now.
-
In the Create a flow log dialog box, configure the flow log based on the following information and click OK.
The following table describes only the parameters that are relevant to this topic. Keep the default or empty values for other parameters. For more information, see Create a flow log.
Parameter
Description
Resource Type
The type of resource whose traffic you want to record.
In this topic, select ENI.
Resource Instance
Select the ENIs of the VPN Gateway instance.
Data Transfer Type
Select the type of traffic to record:
-
All Traffic: Captures all traffic of the specified resource.
-
Allowed Traffic: Captures traffic that is allowed by security group rules and network ACL rules.
-
Denied Traffic: Captures traffic that is denied by security group rules and network ACL rules.
In this topic, All Traffic is selected. You can select a traffic type based on your query requirements.
Project
Select a Project to manage the flow log:
-
Select Project: Select an existing Project.
-
Create Project: Create a Project.
In this topic, Create Project is selected.
Logstore
Select a Logstore to store the flow log:
-
Select Logstore: Select an existing Logstore.
-
Create Logstore: Create a Logstore.
In this topic, Create Logstore is selected. In this scenario, the logs of all ENIs of VPN Gateway instance 1 are delivered to the same Logstore for subsequent query and analysis.
Enable Log Analysis Report
If you enable this feature, indexing is enabled on the selected Logstore and a dashboard is created. This allows you to perform SQL queries and visual analysis on the data.
The indexing feature of Simple Log Service is billed based on traffic. Dashboards are free of charge. For more information, see Billing of Simple Log Service.
In this topic, this feature is Enabled for subsequent query and analysis of flow logs.
Sampling Interval (Minutes)
Select the time interval for flow log sampling.
In this topic, 1 minute is selected.
-
Step 3: Query and analyze flow logs
Simple Log Service automatically receives traffic data from flow logs. To query and analyze the VPN Gateway ENI logs, go to the Simple Log Service console.
-
Log on to the VPC console.
-
In the navigation pane on the left, choose .
-
In the top navigation bar, select the region where the flow log is located.
-
On the Flow Log page, find the target flow log, and then click the Logstore name link in the Simple Log Service column. The system automatically redirects you to the Simple Log Service console.
-
On the Logstore details page, you can query and analyze the ENI logs to understand the traffic of VPN Gateway instance 1.
The following example demonstrates how to query and analyze ENI flow logs. You can also create custom queries based on your requirements.
-
Query scenario
Query the hosts that communicate through each ENI of VPN Gateway instance 1 and the bytes transferred between each host pair.
-
Query statement
* | select "eni-id",srcaddr,dstaddr,direction,sum(bytes) as byte from log GROUP BY "eni-id",srcaddr,dstaddr,direction ORDER BY "eni-id" DESC limit 10 -
On the query page, set the time range to Last 1 Hour. In the query box, enter the SQL statement:
* | select "eni-id",srcaddr,dstaddr,direction,sum(bytes) as byte from log GROUP BY "eni-id",srcaddr,dstaddr,direction ORDER BY "eni-id" DESC limit 10, and then click the Search & Analyze button. The query results are displayed as a table on the Charts tab, including columns such as eni-id, srcaddr, dstaddr, direction, and byte. In the right-side panel, you can configure the chart type and fields. Click Add to New Dashboard to save the query results to a dashboard.Query execution steps
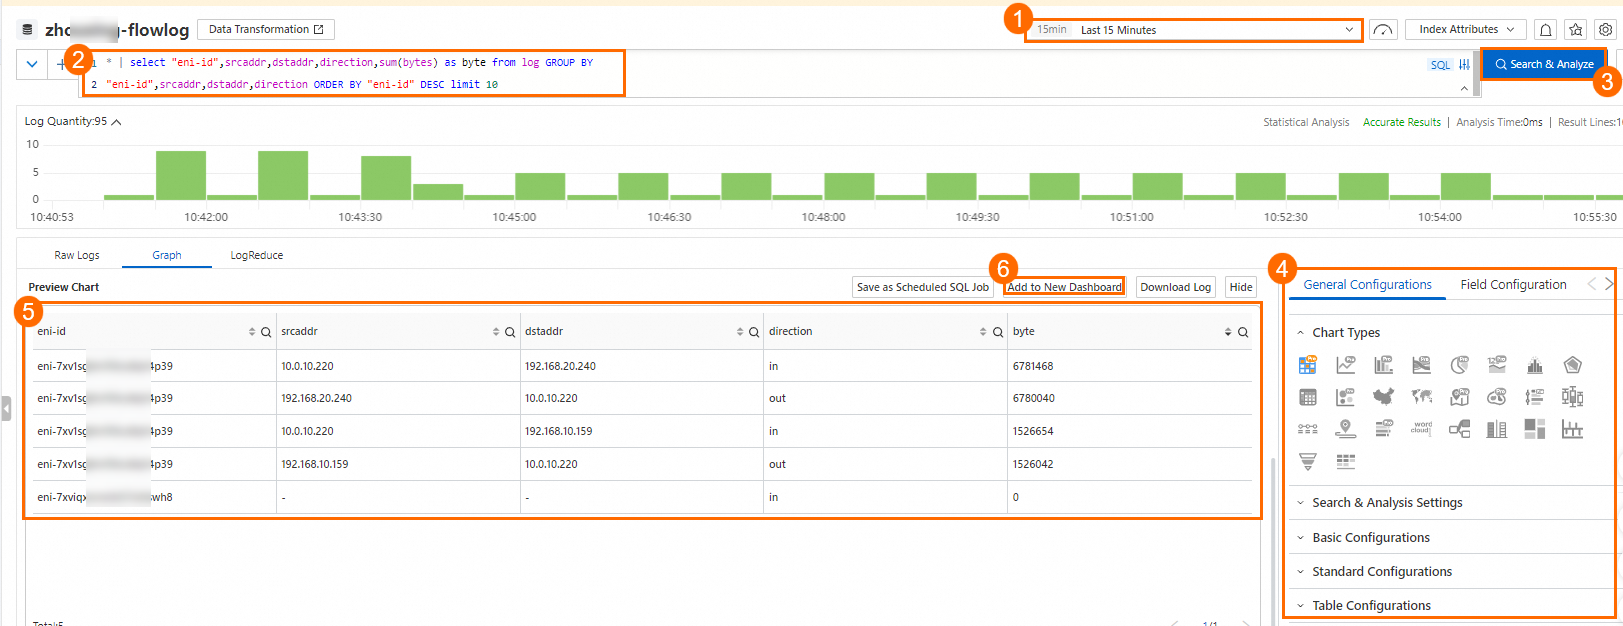
Step
Description
①
Select the time range for the query.
②
Enter the SQL statement.
③
Click Search & Analyze.
④
Keep the default values for all modules on the General Configurations tab.
You can customize the statistical chart display based on your requirements. For more information, see Overview of statistical charts.
⑤
In the Preview Chart area, view, filter, or sort the query results to understand the traffic of the VPN Gateway instance. For example:
-
VPN Gateway instance 1 is currently using eni-7xv1sg8m****39 to transmit traffic.
-
ECS2 in VPC1 has not communicated in the last 15 minutes.
-
ECS1 and ECS4 consumed more bandwidth during communication in the last 15 minutes.
NoteTraffic direction in flow log records:
"in" indicates traffic from the VPC to the ENI.
"out" indicates traffic from the ENI to the VPC.
⑥
(Optional) Add this query scenario to a dashboard so you can view the results at any time.
Click Add to New Dashboard. In the dialog box that appears, set the following parameters:
-
Operation: This topic uses Create Dashboard as an example.
-
Layout Mode: This topic uses Grid Layout as an example.
-
Dashboard Name: Enter a name for the dashboard. In this topic, enter VPN Gateway 1.
For more information about dashboards, see Dashboards.
-
-
References
For more information about the log query and analysis features, see Index-based query and analysis.