Cost analysis
Cost Analysis visualizes cloud spending across multiple dimensions, lets you filter and save reports, and forecasts future costs.
Overview
Cost Analysis is a free tool that provides insights into your cloud resource consumption.
Line and bar charts show cost trends and distribution. Filter by account, product, region, billing item, instance type, time range, or custom tags to drill down from different business perspectives.
Common use cases: monthly cost reviews, anomaly investigation, multi-project cost allocation, budget tracking, and consumption forecasting.
Data source and update schedule
-
Data is aggregated from finalized bills and updated with a one-day delay.
-
Current-month costs are updated 48 hours after detailed bills are generated.
-
Final monthly data is available after 12:00 on the 4th of the following month.
-
Current-month data excludes unsettled (unbilled or accumulating) pay-as-you-go charges.
Get started
-
Log in to the Expenses and Costs console. In the left navigation pane, choose to go to the Cost Analysis page.
-
First-time users: click Activate For Free. The feature becomes available 48 hours after activation if consumption data exists.
Old console users: choose in the navigation pane.
For multiple enterprise accounts under the same verified identity, establish a financial relationship through Financial Association. Once each account activates Cost Analysis, the management account can view member account cost data.
To view Cost Analysis data, a RAM user must be granted the AliyunBSSReadOnlyAccess permission.
Set filters in the Conditions list to narrow results. You can also view historical records by report or by budget period.
Cost distribution
In the Conditions section, you can set the Analysis Dimension and Filters.
-
Set the Category:. You can analyze costs by dimensions such as Product, Product Detail, financial unit, account, management account, consumption type, bill type, resource group, region, availability zone, instance type, billing item, instance ID, and instance tag.
NoteWhen you analyze costs by instance ID, you can add up to 10 instances for cost analysis.
-
Set the Cost Type:. You can view four types of cost data: Billable Amount, list price, Discounted Amount, and Amortized Payable Amount for the Current Period.
NoteAmortized Payable Amount for the Current Period does not support hourly granularity or the instance ID dimension.
-
Select the Time Unit:. You can choose from monthly, daily, or hourly.
-
When analyzing by month, you can view data for up to the last 12 months.
-
When viewing data by day, the selected time range cannot exceed 92 days.
-
When analyzing by hour, you can select a time range of 7 or 14 days.
-
-
Set Filters. By default, all data is included. Configure include or exclude rules to filter the chart results.
-
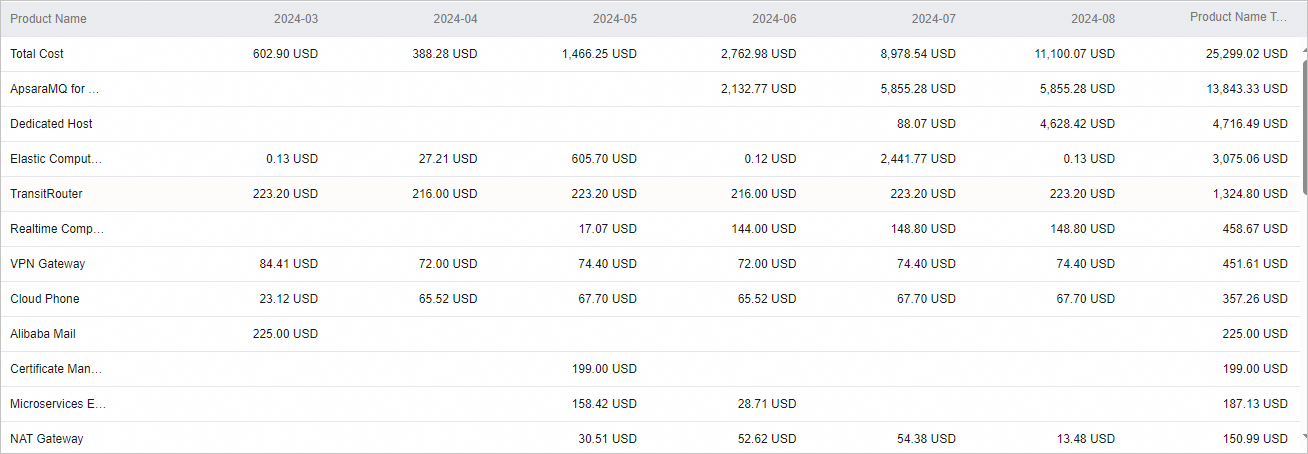
The chart displays data as stacked column, line, or bar charts. Only the top 10 items per time granularity are shown; remaining costs are grouped under "Others". View full product-level details on the Billing Details page.
-
In the Cost Details list, you can preview or export the data for the selected range. The "Total Cost" is the sum of the selected costs.
Budget progress
If you have already created a budget, click Analyze by Budget and select a budget to view cost data for the corresponding time granularity. Click Estimate-to-Actual Analysis to open the comparative analysis page for that budget, which shows the details of your actual consumption versus your set budget.
If you have not created a budget, click Set Budget to create or manage budgets. Budget Management.
Export analysis reports
Save a data view with its analysis dimensions and filters as a report to reuse or share.
-
On the Cost Analysis page, click Save, then name and save the report.
-
Go to the Reports page to open a report's cost analysis chart or to delete reports.
-
You can also return to the Cost Analysis page and select Analyze by Report to choose a saved report for analysis.
Cost forecast
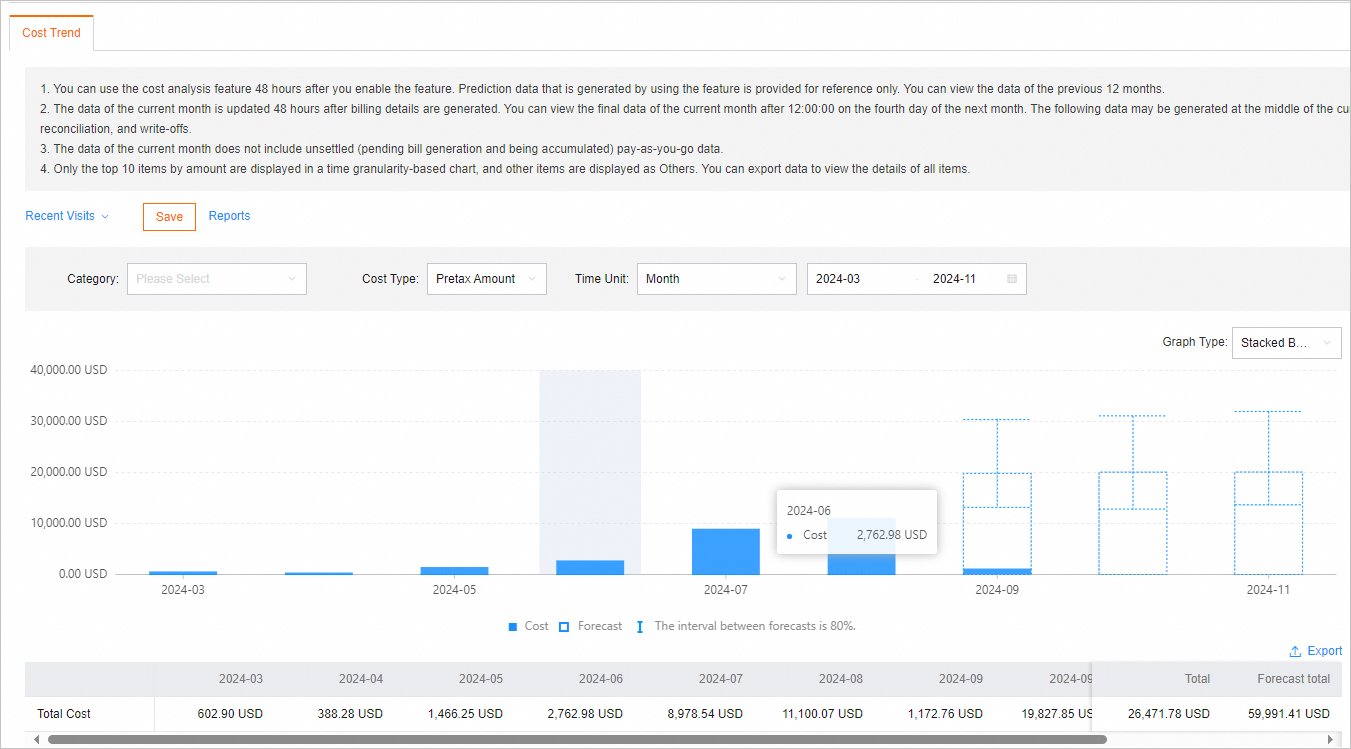
Set the Time Granularity under Analysis Dimension to view forecast expenses for a future date range. Forecasts are for reference only.
-
Enable forecasting: If the selected time granularity includes future dates, click Enable Forecast in the pop-up dialog to activate the cost forecast feature for future dates.
NoteIf you select a category, you cannot perform forecasts. To enable the forecast feature and cancel a category, click Enable Forecast.
If the forecast feature is enabled, you cannot select a category. To disable the forecast feature and use a category, click Enable Category.
-
View forecast trends: Once enabled, you can view forecast trend data for up to 12 months in the future.
-
Billable amount forecasts are available 48 hours after you activate Cost Analysis.
-
Amortized cost forecasts are available 48 hours after you activate amortization.
-
Your consumption history must exceed 60 days, and your average daily spending must be greater than 1 USD.
-
Daily forecasts cover pay-as-you-go costs only. Monthly forecasts cover both subscription and pay-as-you-go costs.
-
Forecasting supports total amounts only, not per-dimension breakdowns.