After connecting Time Series Database (TSDB) to Grafana, you can visualize and monitor TSDB instance data using Grafana's dashboards, metrics queries, and variable-based filtering.
Prerequisites
Before you begin, make sure you have:
A TSDB instance
An Elastic Compute Service (ECS) instance in the same virtual private cloud (VPC) as your TSDB instance, with the following specs:
OS: 64-bit CentOS 7.3
At least 1 CPU core and 2 GB memory
At least 10 GB of available disk storage
The private IP address of the ECS instance added to the TSDB instance whitelist
A security group rule on the ECS instance that allows inbound traffic on port 3000. See Create a security group
(Optional) A public IP address on the ECS instance, if you want to access Grafana from a browser over the internet
For more information about ECS, see What is ECS?
Install Grafana on ECS
SSH into your ECS instance and run the following command to install Grafana:
sudo yum install https://dl.grafana.com/oss/release/grafana-6.2.2-1.x86_64.rpmStart Grafana:
sudo service grafana-server start
For more installation options, see the Grafana documentation.
Add TSDB as a data source
Quick reference
| Setting | Value |
|---|---|
| Database type | OpenTSDB |
| URL | Private endpoint of your TSDB instance (VPC Network Address) |
| Version | ≥2.3 |
| Basic Auth | Enable if user management is on |
| With Credentials | Enable if user management is on |
Steps
Open a browser and go to
http://<ECS-public-IP>:3000/. The Grafana login page appears.On the Grafana logon page, enter admin for the username and the password.
Create a new data source and configure the following settings. Leave all other settings at their default values.
Database type: Set to OpenTSDB.
URL: Enter the private endpoint of your TSDB instance. To find this endpoint, go to the Instance Details page in the TSDB console and copy the value from VPC Network Address under Basic Information.
Version: Select ≥2.3.
If user management is enabled on your TSDB instance, select Basic Auth and With Credentials, then enter the credentials of a user with read access to the instance.
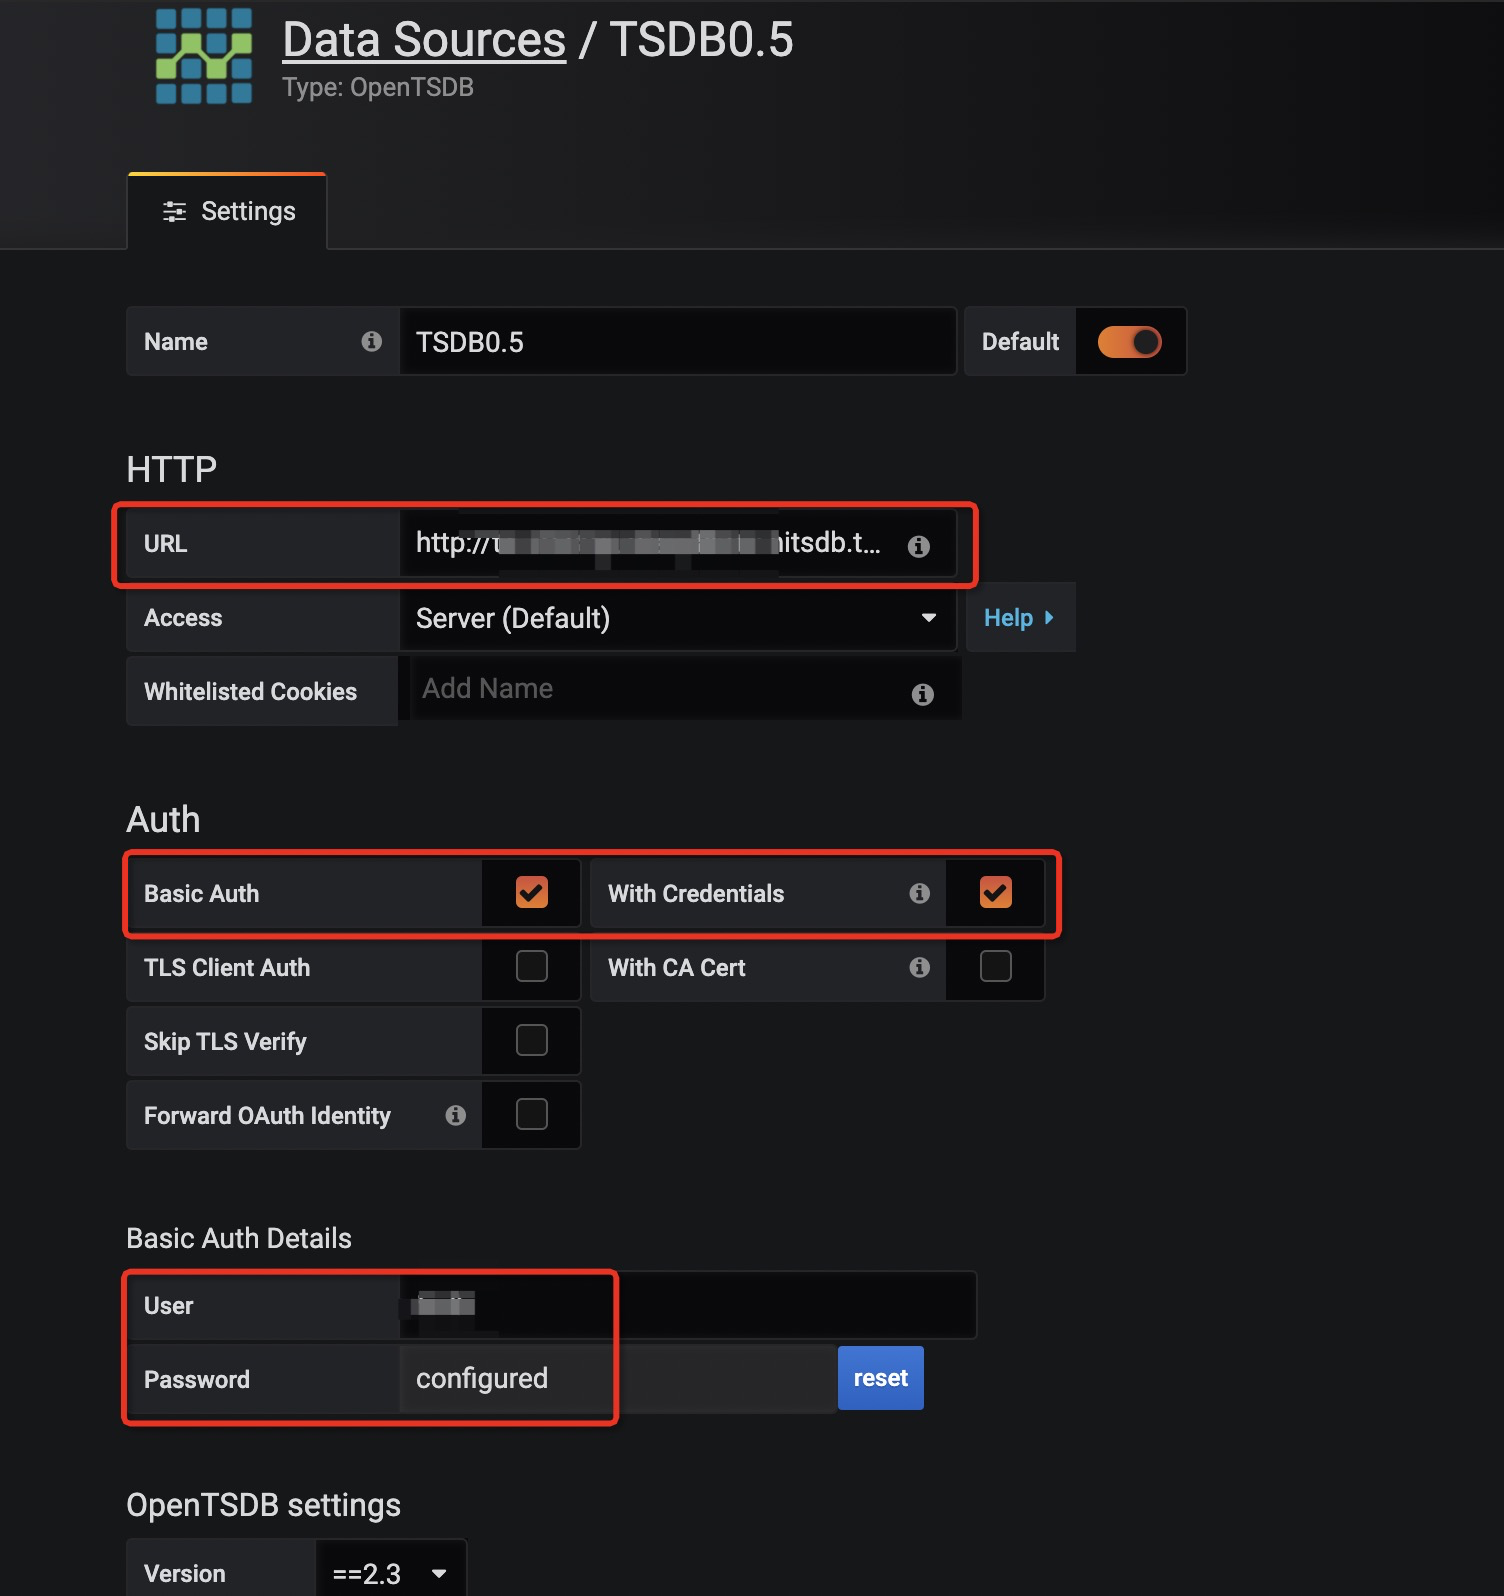
Click Save & Test. When
Data source is workingappears, the connection is established.
Create a monitoring dashboard
The screenshots in this section show Grafana 6.2. The interface may differ in other Grafana versions.
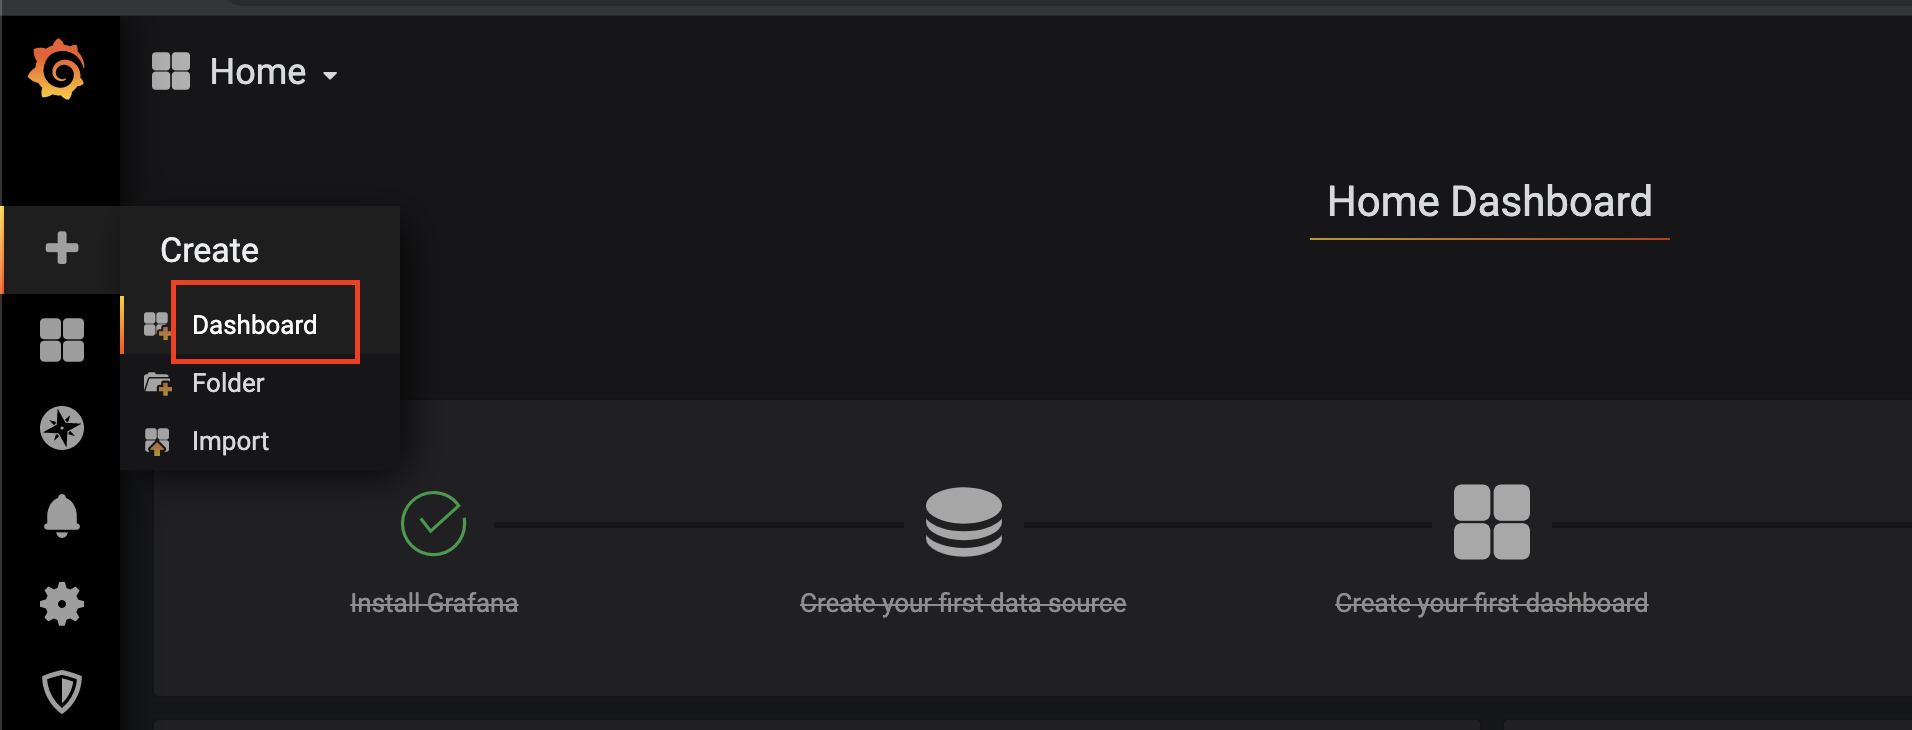
On the Grafana homepage, choose Create > Dashboard. If a dashboard already exists for your TSDB instance, select it instead.
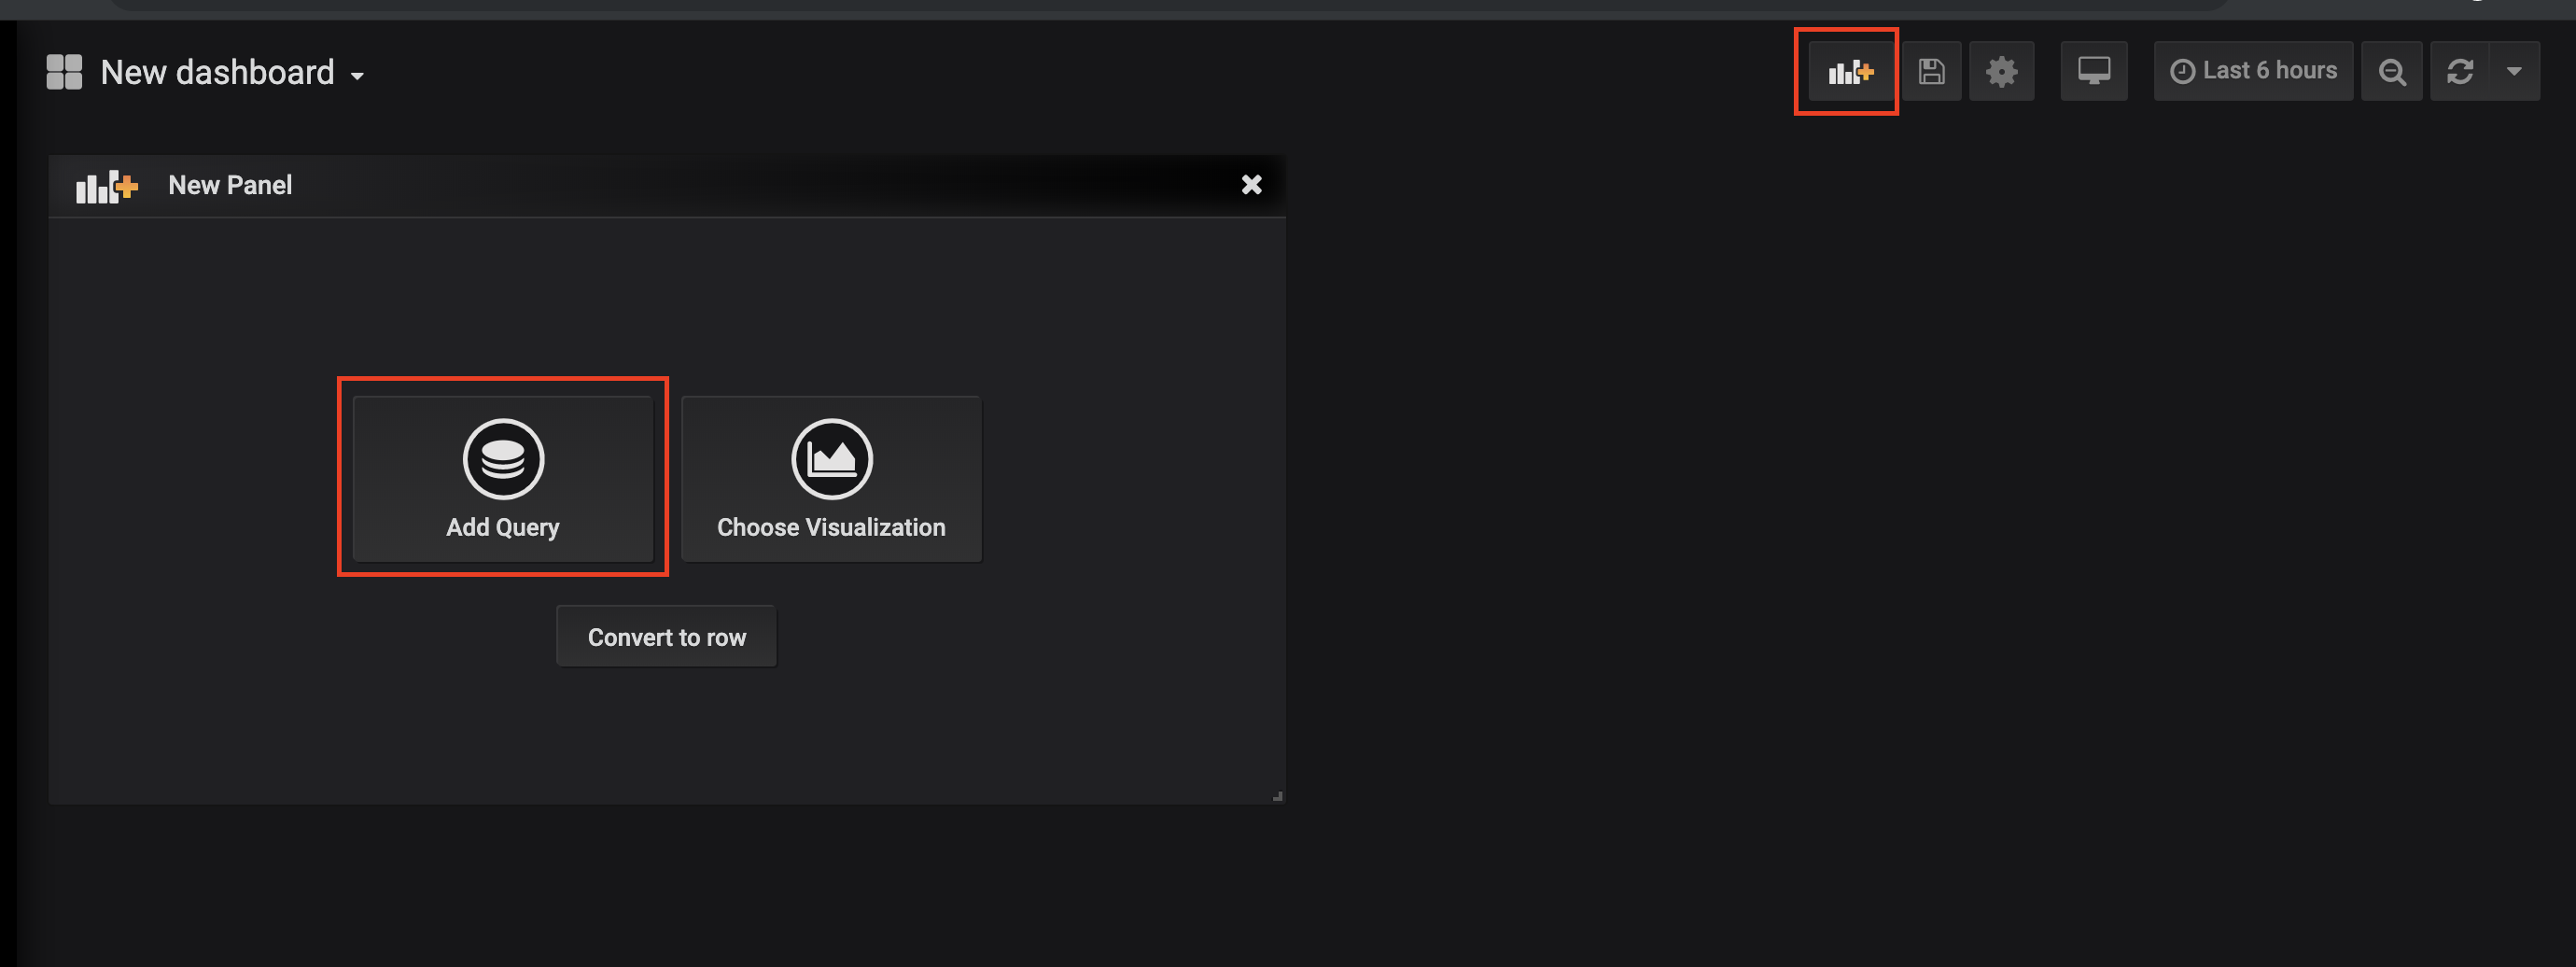
Click New Panel, then click Add Query in the New Panel dialog box.
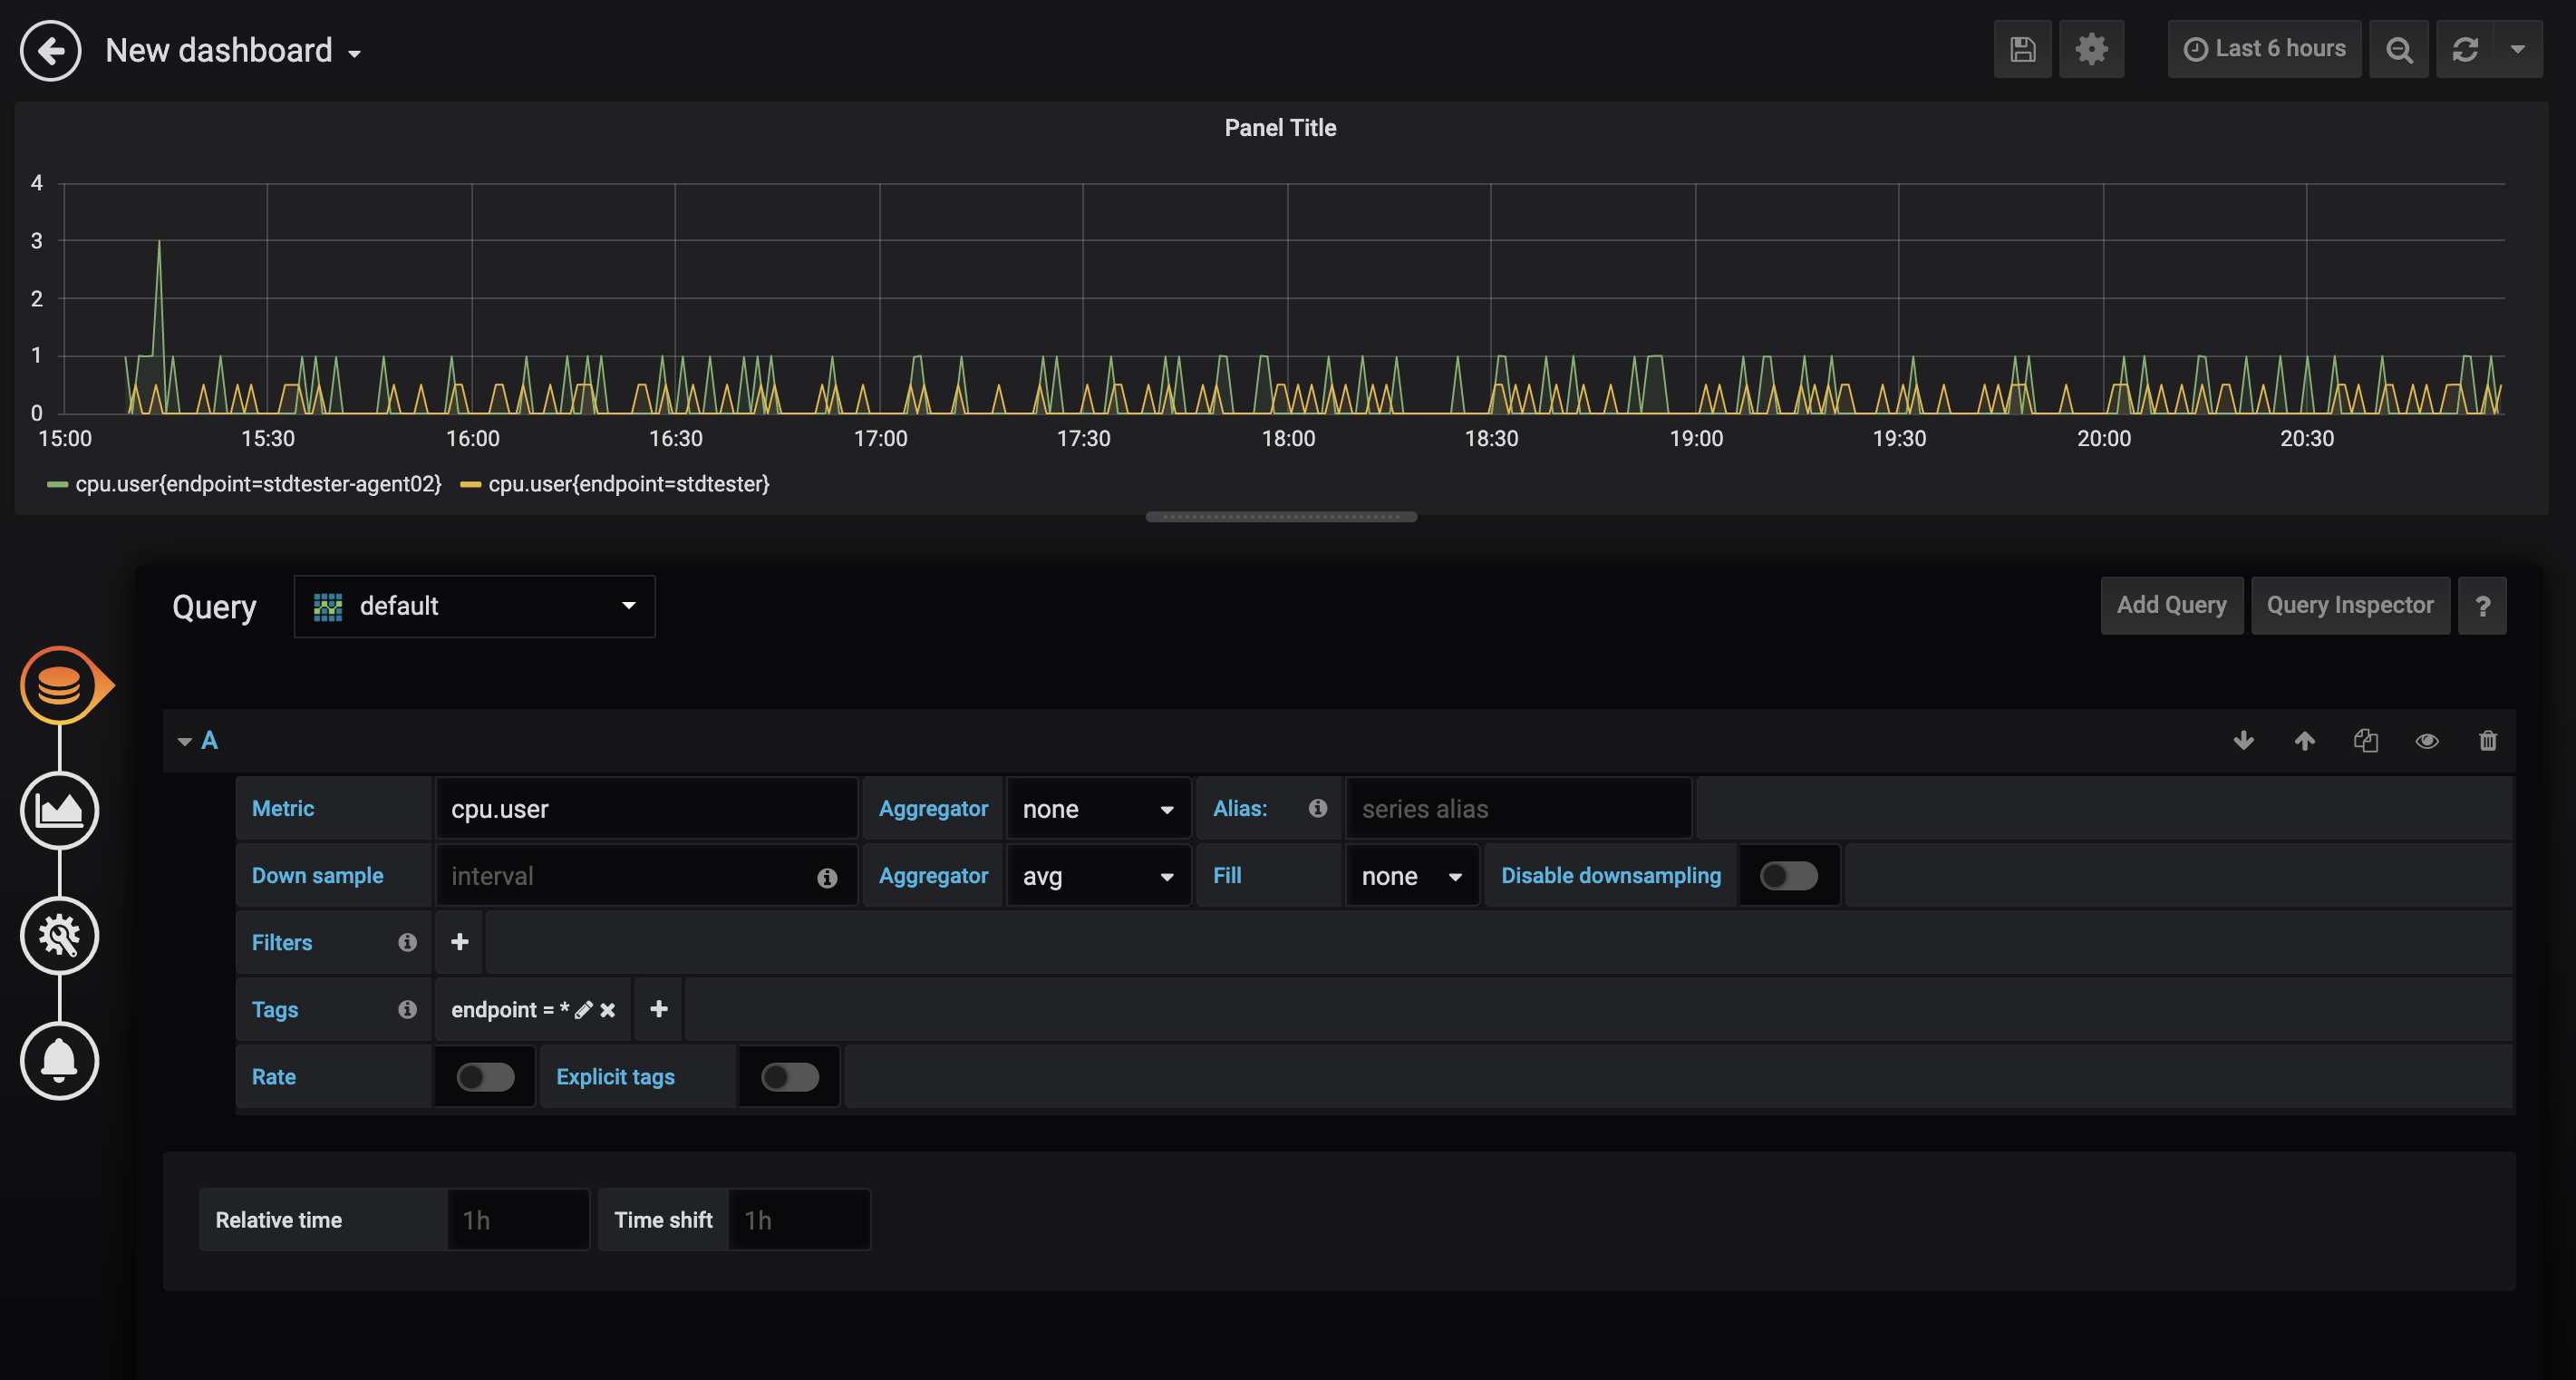
In the panel editor, configure the query parameters:
Select the metric to monitor and specify how to aggregate values across time series.
Configure a downsampling rule by setting the interval, Aggregator, and Fill parameters.
Group time series by tag. To include all tag values for a given tag, enter
*as the tag value.
Aggregator compatibility: TSDB supports a subset of the aggregators available in Grafana. See Query single-value data points for the supported list.
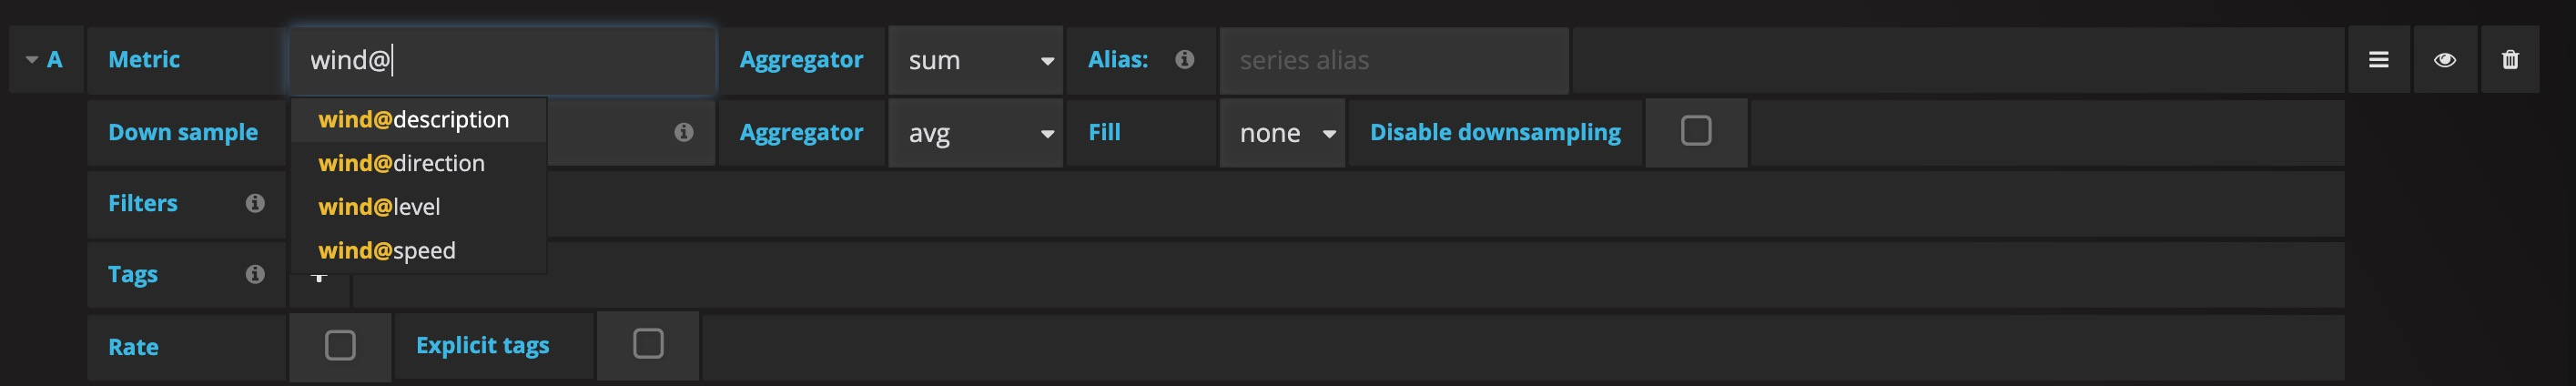
Query multi-value model metrics
To query a metric in a single-value or multi-value model, type the metric name in the query field. The dropdown shows the metric name.
To view all fields of a multi-value model metric, type @ after the metric name. The dropdown then lists all available fields — select the one you want.
Grafana displays only numeric values: TSDB supports numeric, string, and Boolean values. Grafana renders only numeric values, so string and Boolean fields are not displayed in panels.
Filter time series with variables
When the number of time series grows, manually updating each panel query becomes impractical. Grafana variables let you create dynamic filters that apply across panels. The following example creates a variable to filter time series by tag.
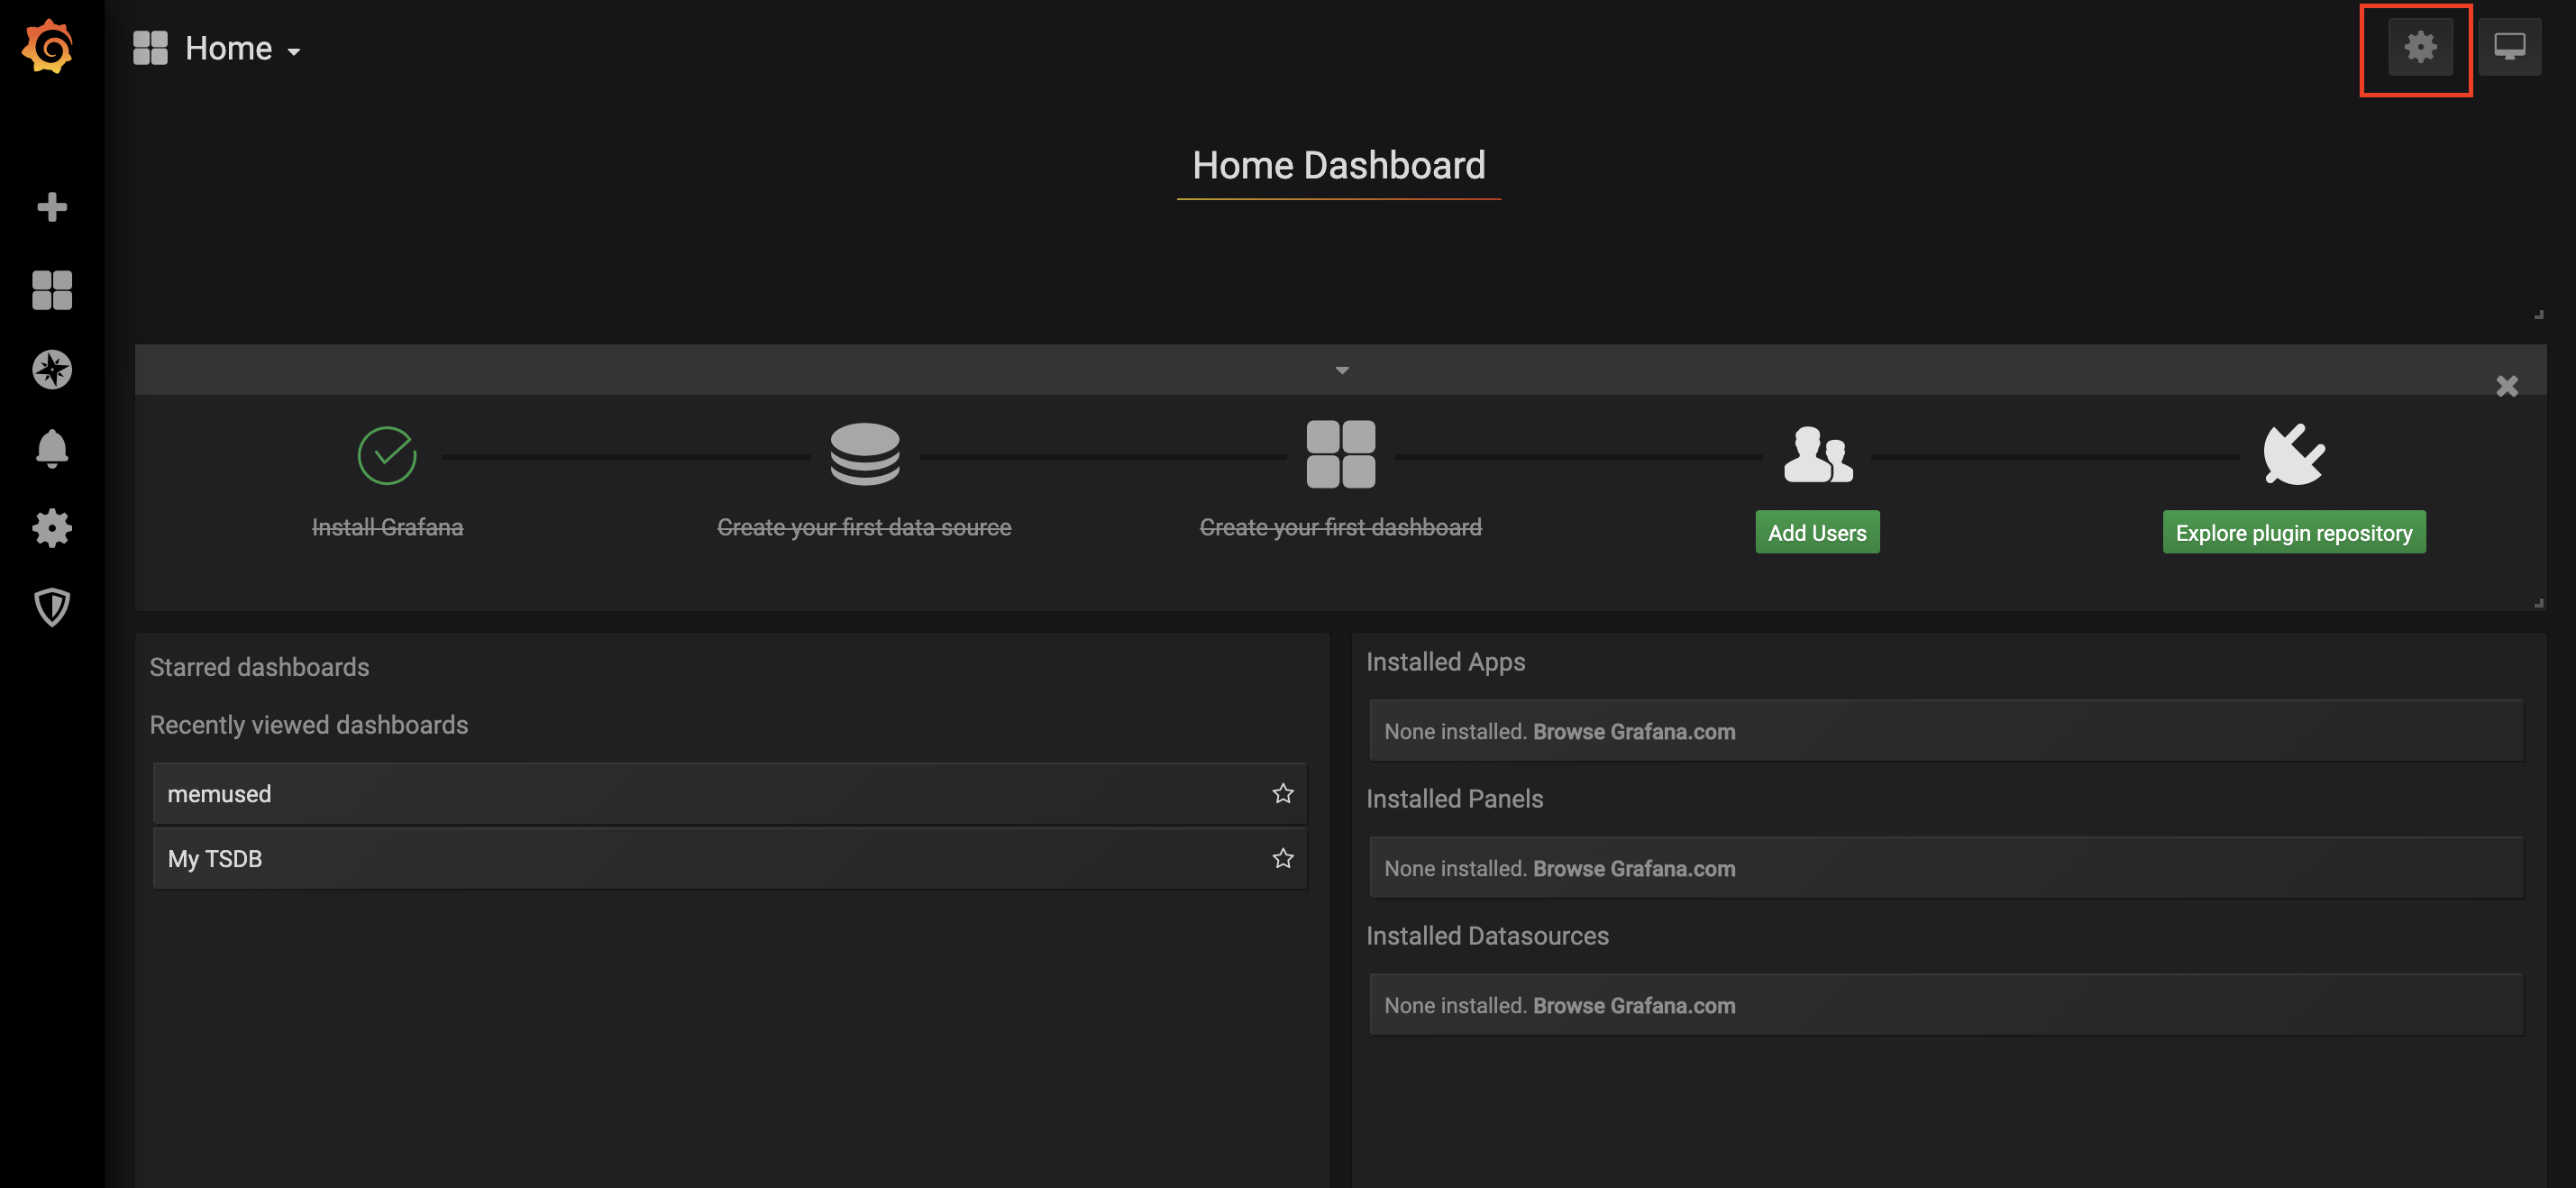
On the dashboard, click the Settings icon.
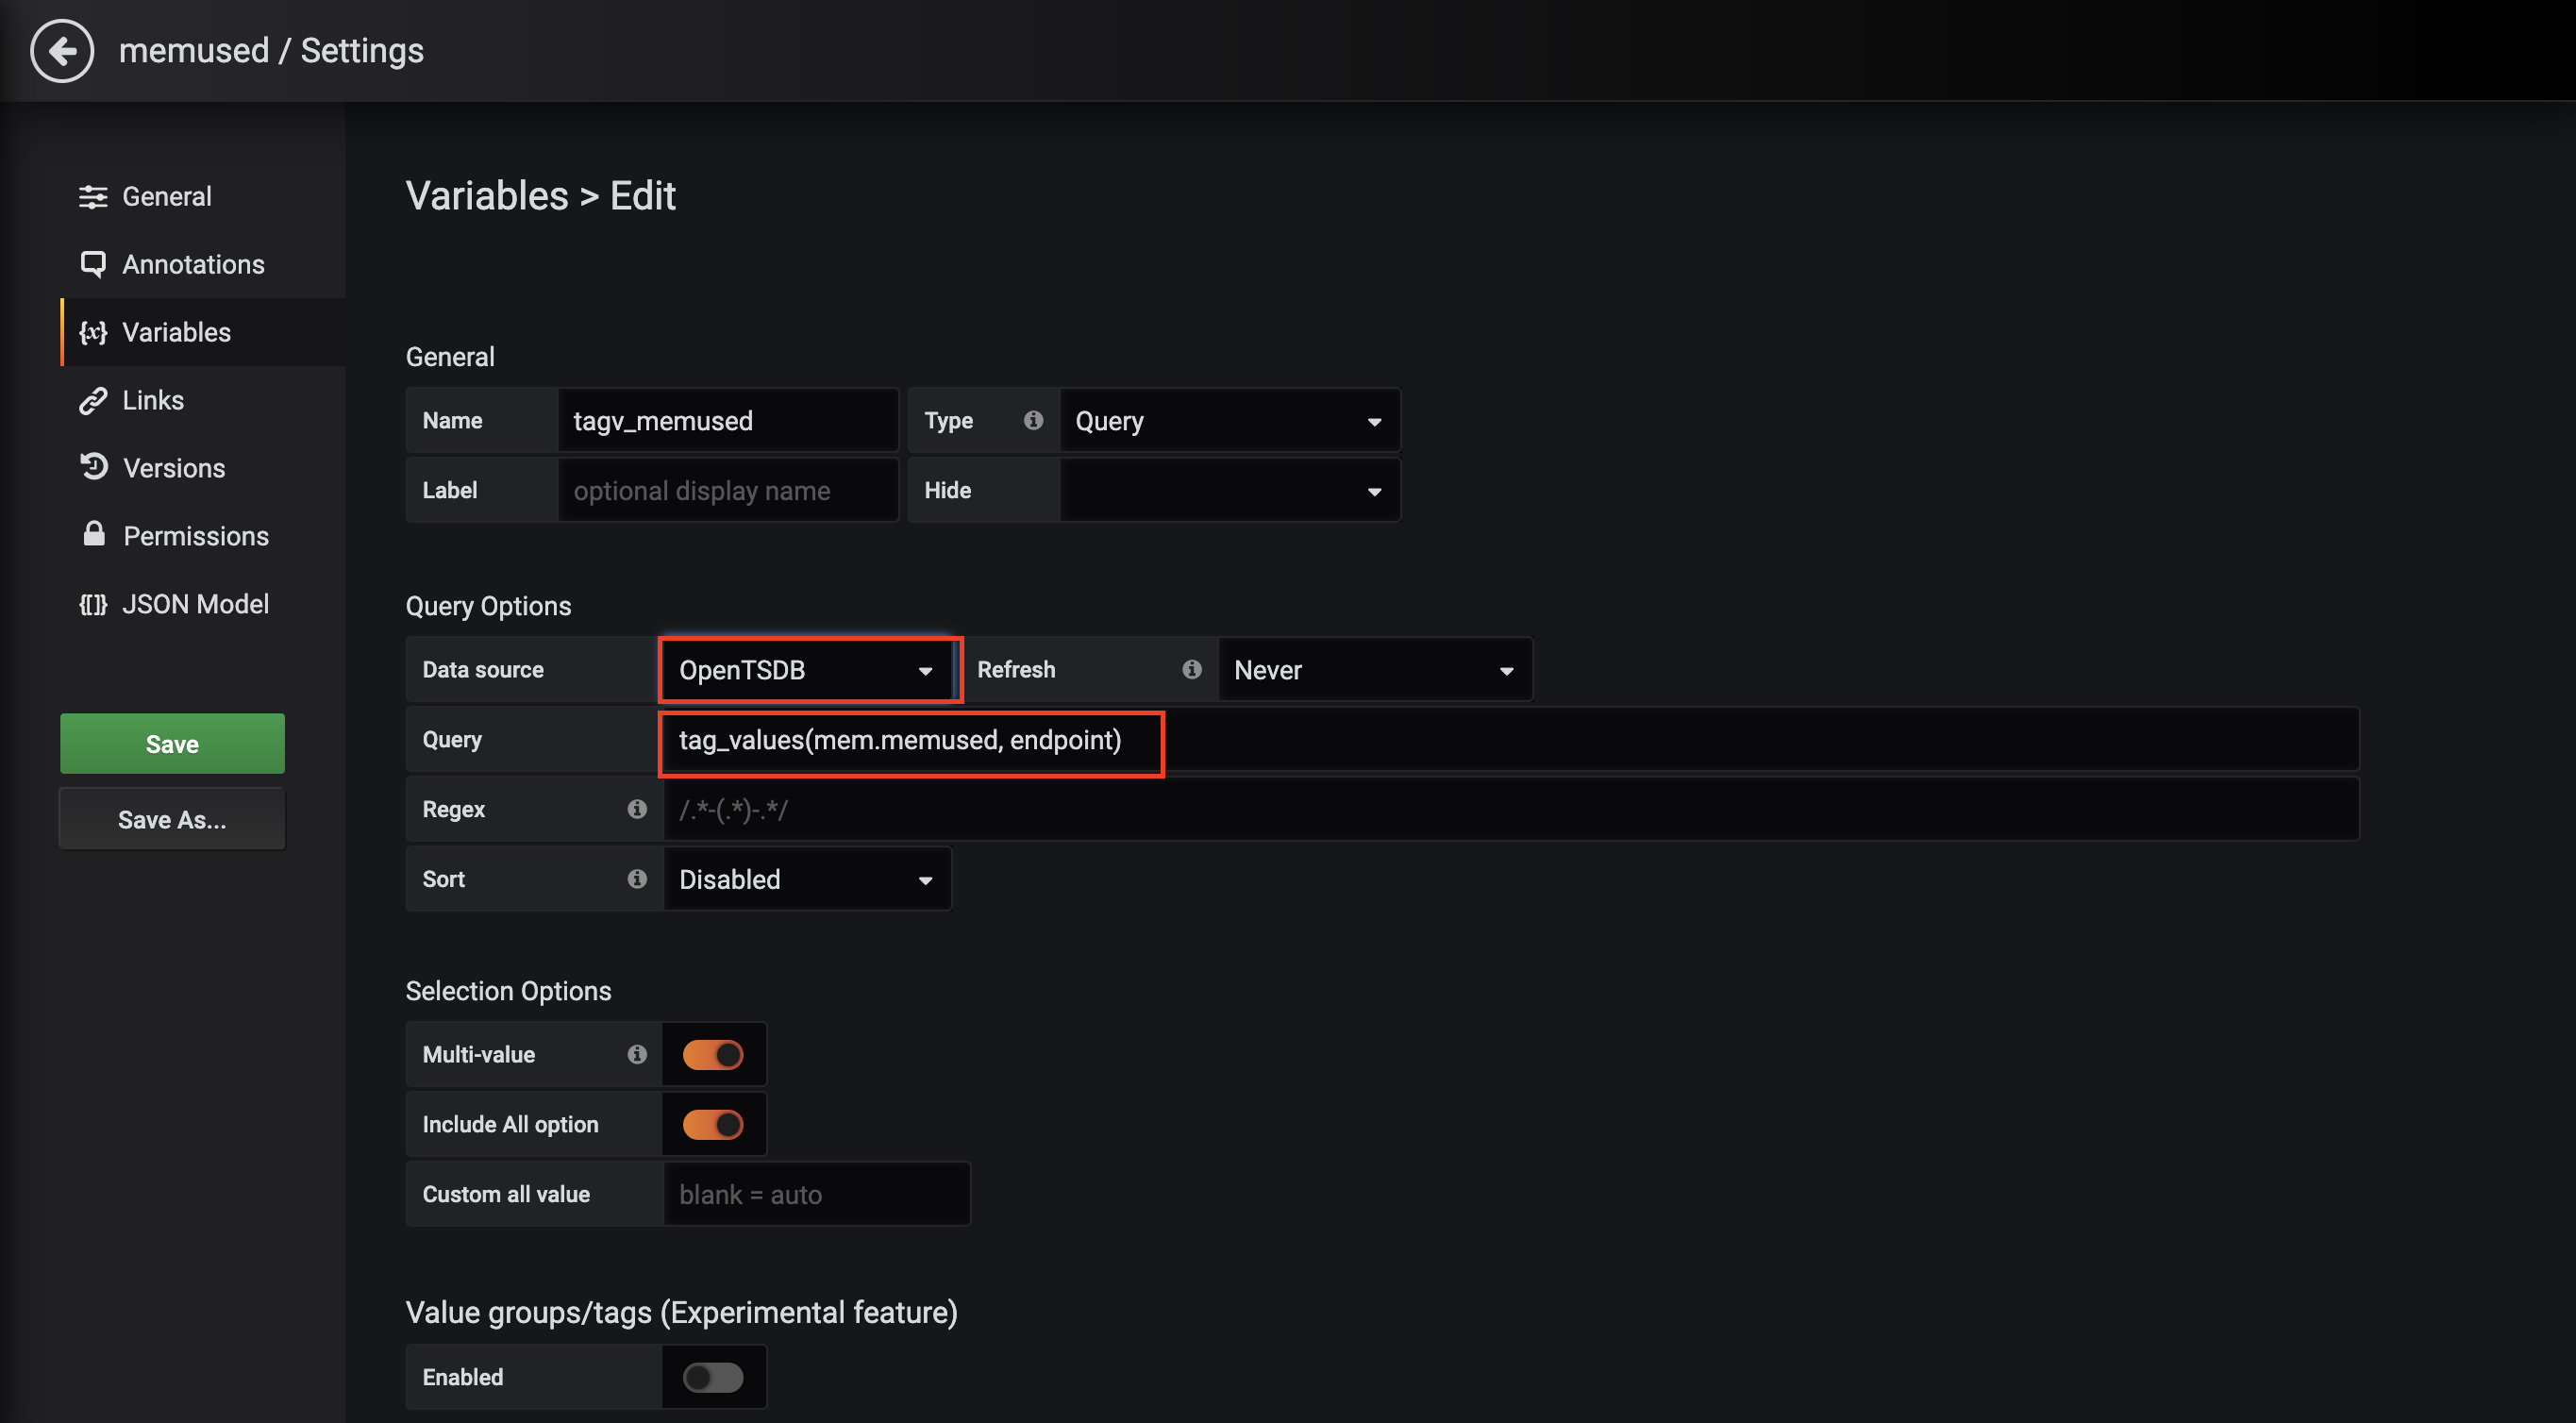
On the Variables page, configure the variable: For the full expression syntax, see the Grafana documentation. In this example, the variable represents tag values, so use an expression starting with
tag_values. > Query result limit in Grafana 6.2.2 and earlier: All Grafana versions return a limited number of query results. Some metrics, tag keys, or tag values may not appear in the dropdown. If this happens, refine your query criteria or apply a workaround. This issue is not fixed in version 6.2.2 or earlier.Set Data source to OpenTSDB.
In the Query field, enter a Grafana query expression for OpenTSDB. The following expressions are supported:
Expression Returns metrics(prefix)All metric names that contain the specified prefix (may return empty) tag_names(metric)All tag keys for the specified metric tag_values(metric, tagKey)All tag values of the specified tag key for the specified metric suggest_tagk(prefix)All tag keys with the specified prefix, across all metrics suggest_tagv(prefix)All tag values with the specified prefix, across all metrics
Reference the variable in a panel query using
$<variable-name>.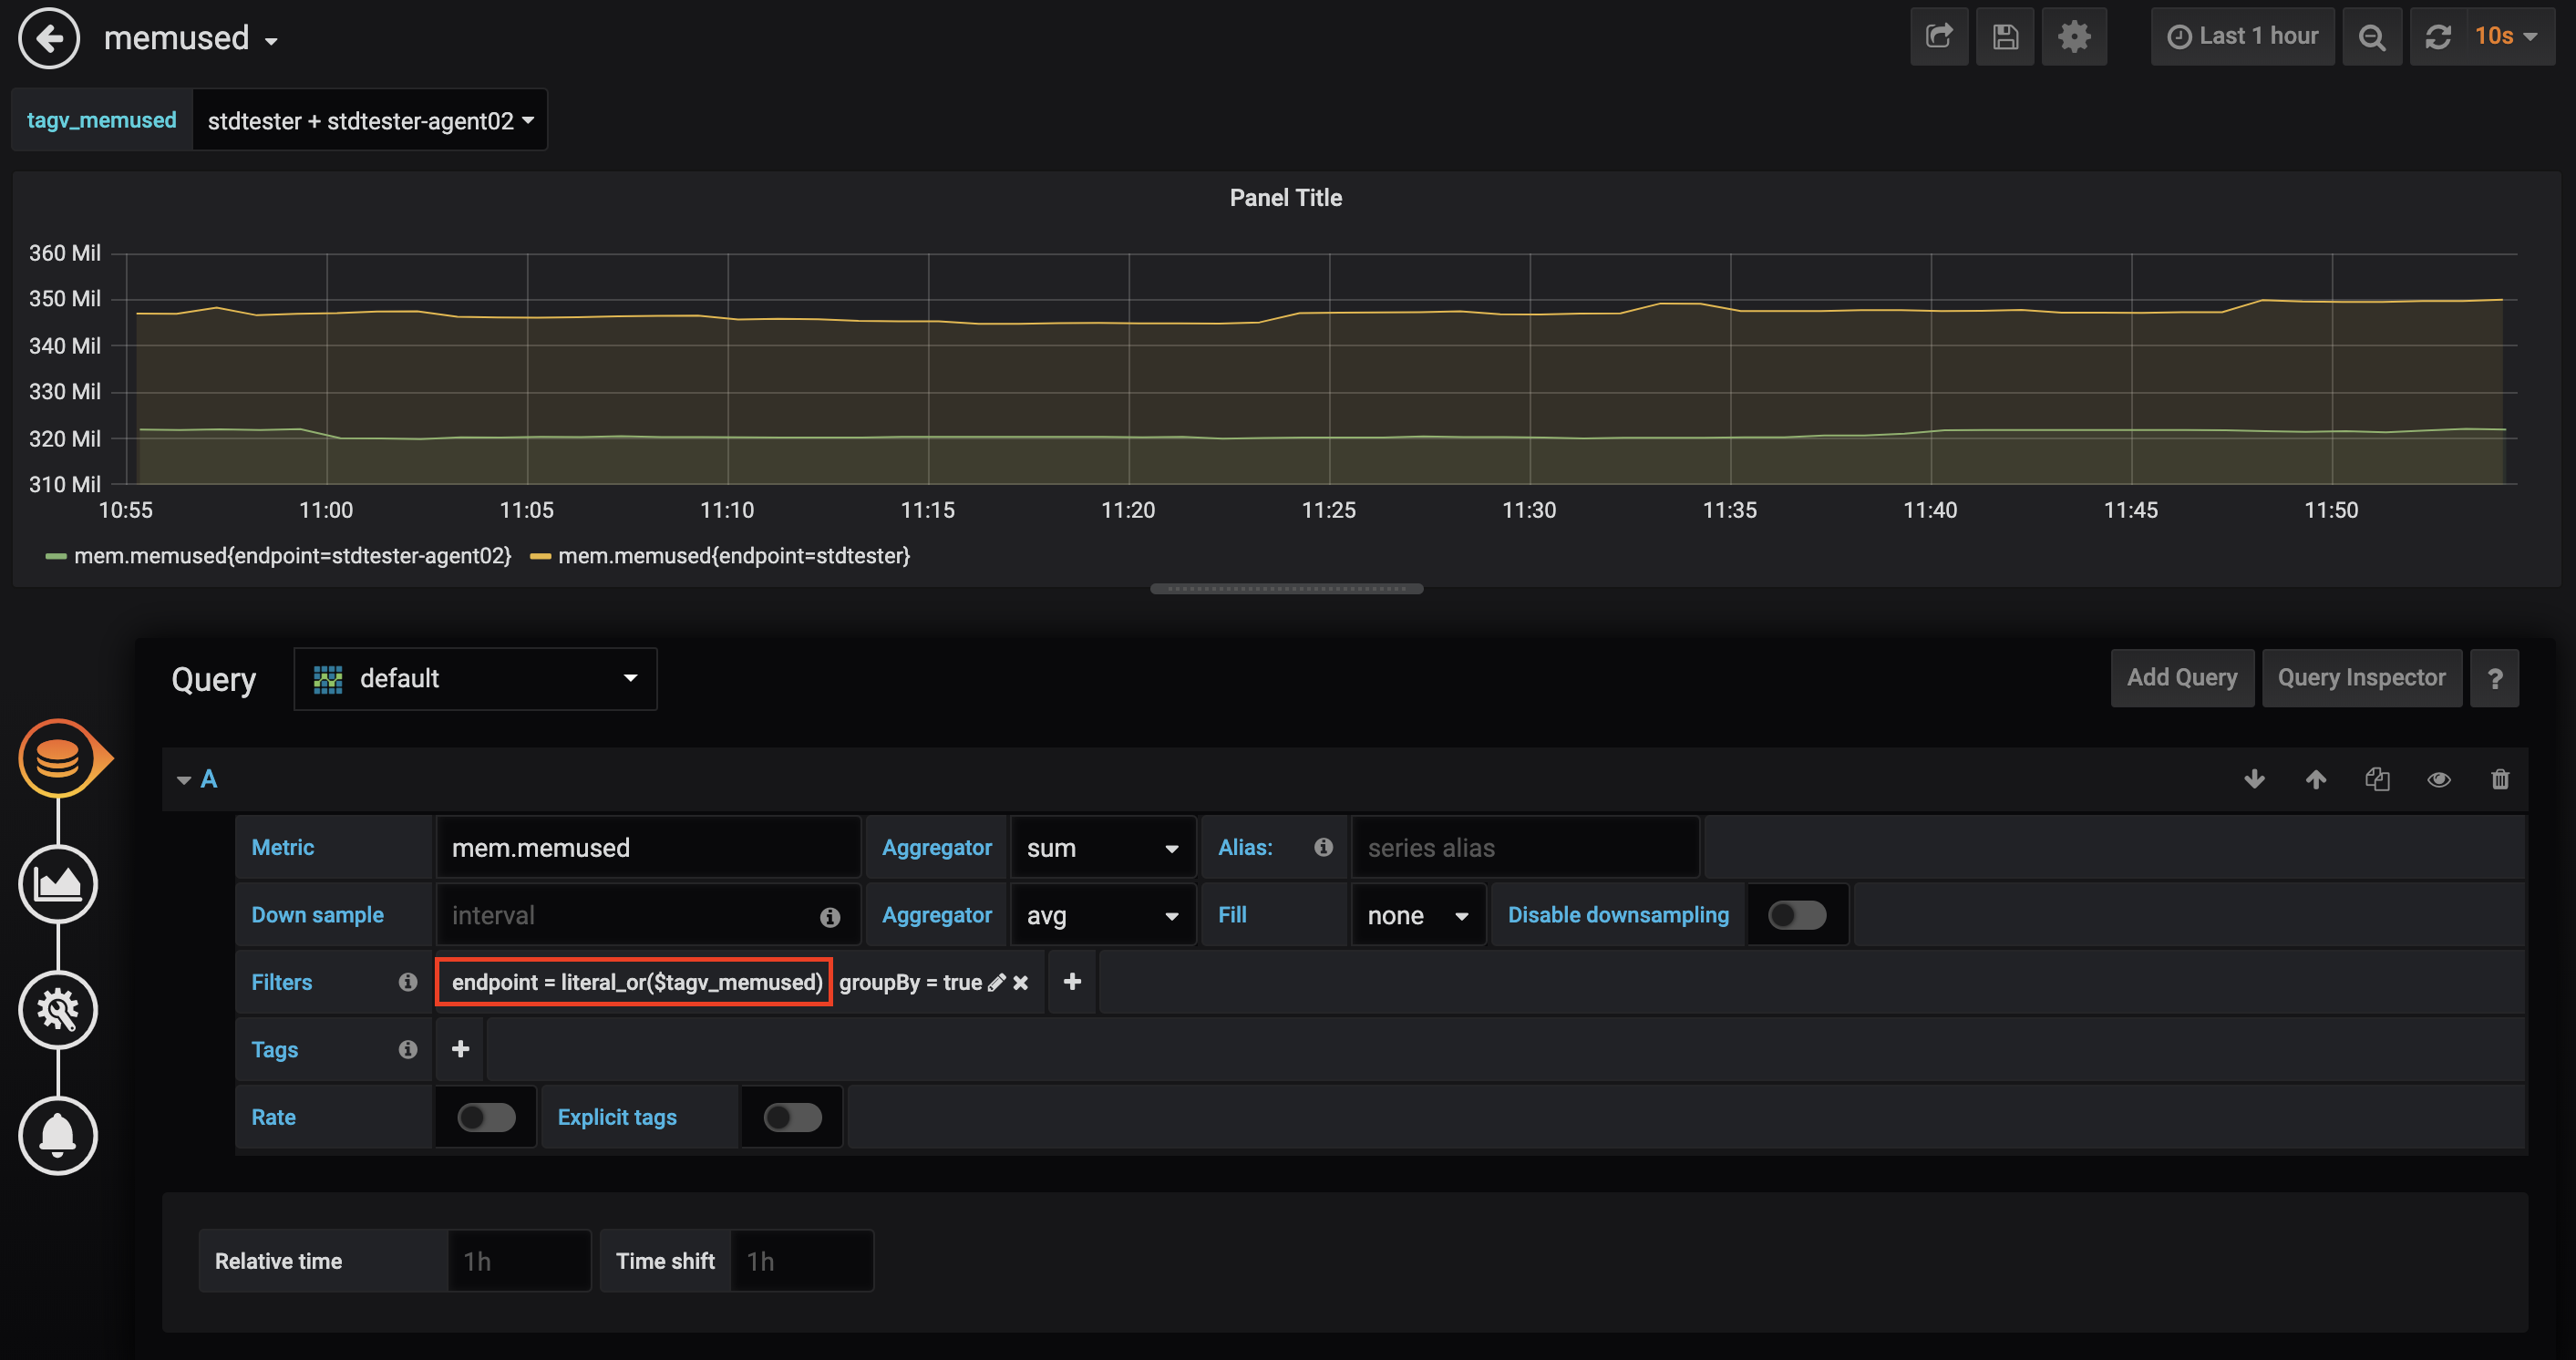
What's next
For more information, see Grafana official documentation.