This topic describes how to use Simple Log Service to query and analyze the network traffic of a Smart Access Gateway (SAG) instance.
Prerequisites
A project and a Logstore are created in Simple Log Service. For more information, see Quick start.
An SAG device is connected to Alibaba Cloud. For more information, see Deploy an SAG device in one-arm mode and enable static routing.
The model of the SAG device is SAG-1000.
Background information
SAG supports flow logs. You can use flow logs to capture network traffic that is distributed by SAG instances. Flow logs can be stored in Simple Log Service or on a specified NetFlow collector. In this topic, Simple Log Service is used as an example. This topic describes how to store the traffic information about an SAG instance, and query and analyze the collected information. This allows you to gain insights into the network traffic distribution of SAG instances.
Step 1: Add a data source
Before you can query or analyze network traffic, you must perform the following steps to collect and deliver the traffic information about the SAG instance to a Logstore in a Simple Log Service project:
Create a flow log.
In the SAG console, create a flow log for the SAG instance. Each flow log is associated with a Logstore in a Simple Log Service project. Traffic information about the SAG instance is stored in the associated project and Logstore.
Log on to the SAG console.
In the left-side navigation pane, click Flow Logs.
On the Flow Logs page, click Create Flow Log.
In the Create Flow Log panel, configure the following parameters and click OK:
Name: Enter a name for the flow log.
Output Interval Under Active Connections: Enter a time interval at which the log data of active network connections is collected. The default time interval is 300 seconds. You can specify a time interval from 60 to 6,000 seconds.
Output Interval Under Inactive Connections: Enter a time interval at which log data of inactive network connections is collected. The default time interval is 15 seconds. You can set a time interval from 10 to 600 seconds.
Deliver Flow Log Data To: Select a service where you want to store the collected log data. In this example, SLS is selected.
If you want to store the collected log data in Simple Log Service, select SLS.
If you want to store the collected log data on a NetFlow collector, select Netflow.
To store the collected log data both in Simple Log Service and on a NetFlow collector, select ALL.
SLS Region: Select the region where Simple Log Service is deployed.
SLS Project: Select the project to which the Logstore belongs.
SLS Logstore: Select the Logstore where you want to store the collected log data.
For more information, see Create a flow log.
Associate the flow log with the SAG instance.
After you create a flow log, you must associate it with the SAG instance from which you want to collect traffic information. After the flow log is associated with the SAG instance, the information about the network traffic of the SAG instance is stored in the specified Simple Log Service project and Logstore. You can query and analyze the collected log data in the Simple Log Service console.
On the Flow Logs page, click the ID of the flow log that you created.
On the details page, click Associate with Instance.
In the Associate with Instance panel, select the SAG instance with which you want to associate the flow log and click Save.
Step 2: Query and analyze log data
After the flow log is associated with the SAG instance, you can query and analyze the collected log data in the Log Service console.
Log on to the Simple Log Service console.
In the Projects section, click the project that you want to manage.
On the tab, click the Logstore that you want to manage.
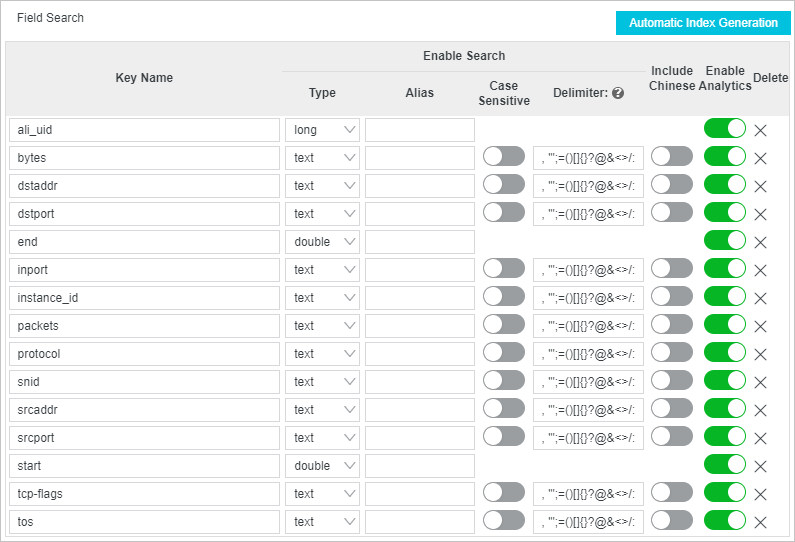
Enable the indexing feature for the Logstore. For more information, see Create indexes.
An index is a storage structure used to sort one or more columns of log data. You can query and analyze log data only after you configure indexes. Query and analysis results vary based on index configurations. Therefore, you must configure indexes based on your business requirements. In this example, the field indexing and statistics features are enabled.
 Note
NoteTo facilitate data analytics, make sure that the bytes field is of the TEXT type when you configure field indexing.
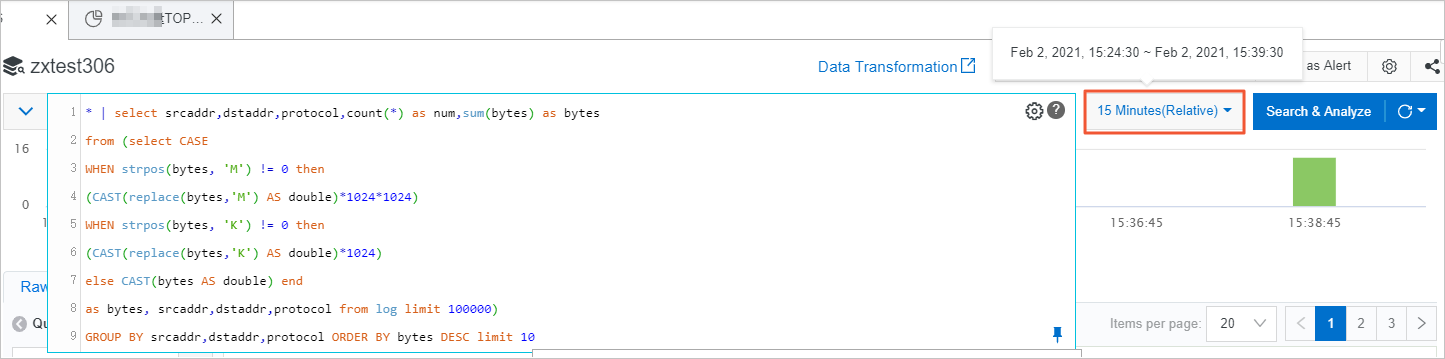
After you enable indexing, you can query and analyze log data. In the following example, the top ten 5-tuples that have generated the highest volume of network traffic are queried. The example shows how to query and analyze network traffic.
Enter a query statement in the search box.
In this example, the following fields are used to query the top ten 5-tuples that have generated the highest volume of network traffic: srcaddr, srcport, dstaddr, dstport, and protocol.
* | select srcaddr,srcport,dstaddr,dstport,protocol,count(*) as num,sum(bytes) as bytes
from (select CASE
WHEN strpos(bytes, 'M') != 0 then
(CAST(replace(bytes,'M') AS double)*1024*1024)
WHEN strpos(bytes, 'K') != 0 then
(CAST(replace(bytes,'K') AS double)*1024)
else CAST(bytes AS double) end
as bytes,srcaddr,srcport,dstaddr,dstport,protocol from log limit 100000)
GROUP BY srcaddr,dstaddr,srcport,dstport,protocol ORDER BY bytes DESC limit 10
By default, the system returns log data collected within the last 15 minutes. You can also specify a time range.
 Note
NoteDo not directly include the fields described in this topic in the query statements. These fields are for reference only. The fields in the collected log data shall prevail. For more information, see Log search overview.
Click Search & Analyze.
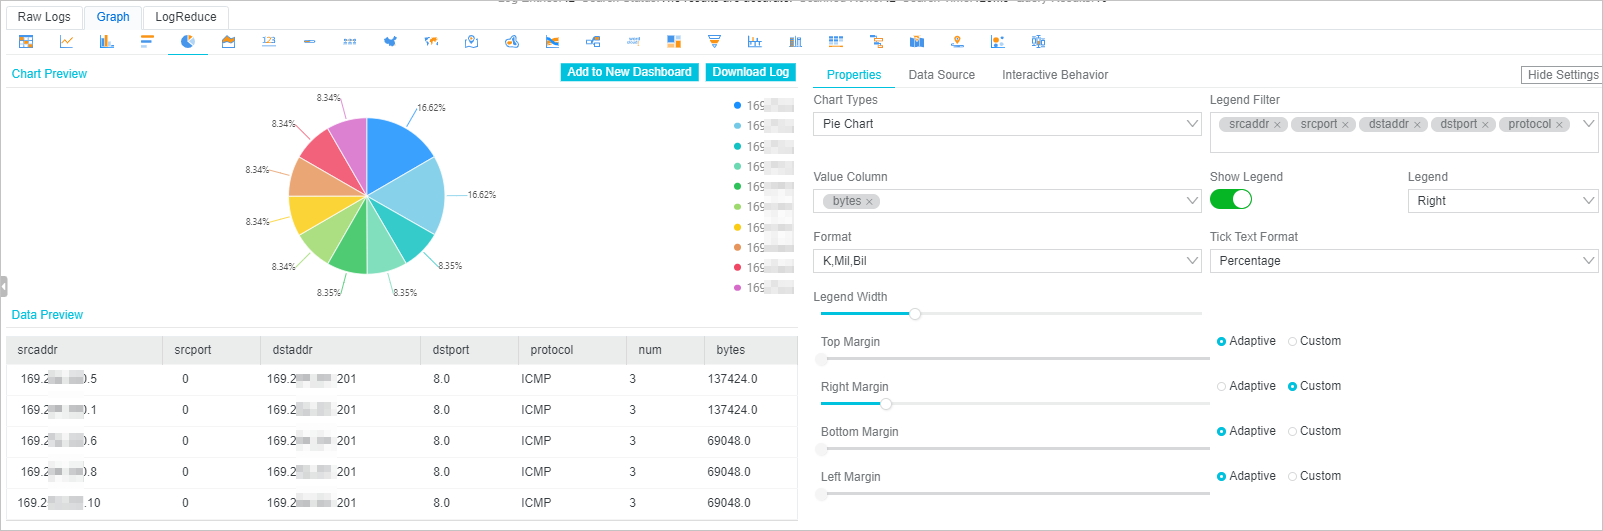
You are redirected to the Graph tab. The information about the top ten 5-tuples that have generated the highest volume of network traffic is displayed in a table. You can also display the data in other types of graphs. For more information, see Chart overview.
In this example, the data is displayed in a pie chart.
On the Graph tab, you can modify the attributes of the pie chart.
In this example, the following attributes are modified. Other attributes use the default values. For more information, see Pie chart (Pro).
Category: The category of the data.
In this example, the data is classified based on the following fields: srcaddr, srcport, dstaddr, dstport, and protocol. The volume of network traffic is counted only if all the preceding fields match the specified conditions.
Value Column: The value of the returned data entry.
In this example, the bytes field is used as the value column.
Optional. You can perform the preceding steps to query the top ten 3-tuples that have generated the highest volume of network traffic or the top 10 source IP addresses that have generated the largest amount of network traffic.
Query the top ten 3-tuples that have generated the highest volume of network traffic
Fields that are queried: srcaddr, dstaddr, protocol.
Statements for querying data:
* | select srcaddr,dstaddr,protocol,count(*) as num,sum(bytes) as bytes
from (select CASE
WHEN strpos(bytes, 'M') != 0 then
(CAST(replace(bytes,'M') AS double)*1024*1024)
WHEN strpos(bytes, 'K') != 0 then
(CAST(replace(bytes,'K') AS double)*1024)
else CAST(bytes AS double) end
as bytes, srcaddr,dstaddr,protocol from log limit 100000)
GROUP BY srcaddr,dstaddr,protocol ORDER BY bytes DESC limit 10
Query result:

Query the top 10 source IP addresses that have generated the highest volume of network traffic
Fields that are queried: srcaddr and dstaddr.
Statements for querying data:
* | select srcaddr,dstaddr,count(*) as num,sum(bytes) as bytes
from (select CASE
WHEN strpos(bytes, 'M') != 0 then
(CAST(replace(bytes,'M') AS double)*1024*1024)
WHEN strpos(bytes, 'K') != 0 then
(CAST(replace(bytes,'K') AS double)*1024)
else CAST(bytes AS double) end
as bytes, srcaddr,dstaddr from log limit 100000)
GROUP BY srcaddr,dstaddr ORDER BY bytes DESC limit 10
Query result:

Step 3: (Optional) Add the graph to a dashboard
Simple Log Service allows you to add graphs that contain query results to dashboards. This way, you can view the stored data as needed.
In the upper-right corner of the pie chart, click Add to New Dashboard.
In the Add to New Dashboard dialog box, configure the parameters and click OK.
Operation: In this example, Create Dashboard is selected.
Dashboard Name: Enter a name for the dashboard. In this example, Statistics Based on 5-tuples is used.
Chart Name: Enter a name for the graph. In this example, Pie Chart Based on 5-tuples is used.
For more information, see Add a chart to a dashboard.
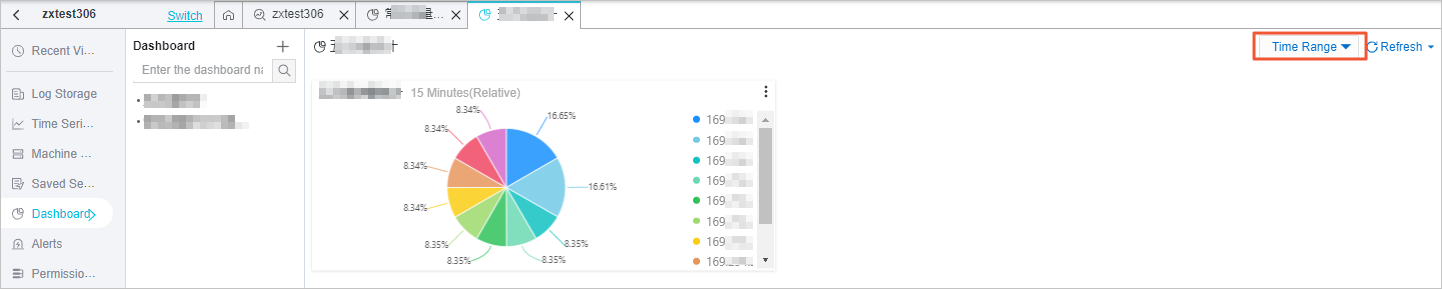
In the left-side navigation pane, click the Dashboard icon.
Click the name of the dashboard that you created to view the data.
On the dashboard, you can click Time Range to specify a time range to filter analysis data. For more information, see Manage a dashboard in display mode.