The window funnel function analyzes user behavior, app traffic, and product goal conversions by tracking sequential events within a sliding time window.
The window funnel function supports the following two syntaxes.
|
Function |
Syntax |
Description |
SQL support |
SPL support |
|
window_funnel(sliding_window, timestamp, event_id, ARRAY[event_list01, event_list02...]) |
Searches for an event chain within a sliding time window and calculates the maximum number of consecutive events in the chain. Use this syntax if an event column (event_id) is already defined in your data. |
√ |
× |
|
|
window_funnel(sliding_window, timestamp, ARRAY[event_id=event_list01, event_id=event_list02...]) |
Searches for an event chain within a sliding time window and calculates the maximum number of consecutive events in the chain. Use this syntax to define custom, non-enumerated event values for greater flexibility. |
√ |
× |
How it works
The window funnel function searches for an event chain within a sliding time window, identifies the longest matching sequence from the beginning of the chain, and returns the length of that sequence.
The function uses the following algorithm:
-
Starts from the first event in the defined chain, sets the event counter to 1, and opens the sliding window.
-
Within the sliding window, if subsequent events occur in the correct order, the counter increments.
-
If the sequence is interrupted, the current search terminates, the event counter stops incrementing, and a new search begins.
-
After all searches complete, if multiple matches were found, the function returns the highest counter value, which represents the length of the longest matched event chain.
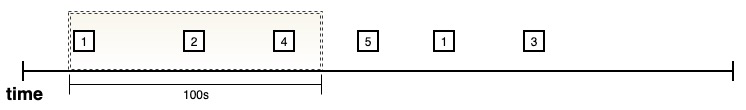
For example, assume a sliding time window of 100 seconds and an event chain of Event 1 -> Event 2 -> Event 3 -> Event 4 -> Event 5. If the actual sequence is Event 1 -> Event 2 -> Event 4 -> Event 5 -> Event 1 -> Event 3, the function returns 2 because the longest matched sequence starting from Event 1 is Event 1 -> Event 2.
-
The search must start with the first event in the defined chain. For example, if the actual event sequence is Event 2 -> Event 3 -> Event 4, the function returns 0.
-
The search requires a strict order and cannot skip events. For example, in the sequence Event 1 -> Event 2 -> Event 4, the match stops after Event 2 because Event 3 was skipped. Therefore, Event 4 is not counted.
Syntax
The window funnel function supports the following two syntaxes.
-
If an event column (event_id) is already defined in your data, use the following syntax:
window_funnel(sliding_window, timestamp, event_id, ARRAY[event_list01, event_list02...]) -
To define custom, non-enumerated event values, use the following syntax:
window_funnel(sliding_window, timestamp, ARRAY[event_id=event_list01, event_id=event_list02...])
Parameters
|
Parameter |
Description |
|
sliding_window |
The sliding time window, in seconds. The value must be of the bigint type. |
|
timestamp |
The timestamp, in seconds. The value must be of the bigint type. We recommend using the built-in __time__ log field. |
|
event_id |
The log field that represents an event, such as A, B, or C. The value must be of the varchar type. |
|
event_list |
The custom event chain to match, which can contain up to 32 events. The value must be of the array type. Examples:
|
Examples
An e-commerce store runs a promotion and uses the window funnel function to analyze conversion performance. The conversion path consists of three steps: browse commodity, add to cart, and purchase commodity. Simple Log Service collects logs for these events.
The following example shows the fields in a log entry: behavior_type:pv, category_id:149192, item_id:2073959, timestamp:1511860012, and user_id:137617.
|
Log field |
Description |
|
behavior_type |
The type of user behavior. Valid values:
|
|
category_id |
The category ID of the commodity. |
|
item_id |
The ID of the commodity. |
|
timestamp |
The time the user behavior occurred. |
|
user_id |
The ID of the user. |
Example 1
Analyze user purchase behavior within a 24-hour window.
-
Query statement
* | SELECT user_id, window_funnel( 86400, timestamp, ARRAY [behavior_type='pv', behavior_type='cart',behavior_type='buy'] ) AS levels GROUP BY user_id ORDER BY user_id LIMIT 1000 -
Results
-
The
levelsvalue for user 24 is 3, indicating the user completed the full path: browsed a commodity, added it to the cart, and purchased it. -
The
levelsvalue for user 14 is 2, indicating the user browsed a commodity and added it to the cart but did not complete the purchase.
The query returns 1,000 records in a table with two columns: user_id and levels.
-
Example 2
Analyze how many users completed each step of the funnel.
-
Query statement
* | SELECT levels, count, sum(count) over( ORDER BY levels DESC ) AS total FROM ( SELECT levels, count(1) AS count FROM ( SELECT user_id, window_funnel( 86400, timestamp, ARRAY [behavior_type='pv', behavior_type='cart',behavior_type='buy'] ) AS levels FROM log GROUP BY user_id ) GROUP BY levels ORDER BY levels ) -
Results
-
513,194 users browsed a commodity, and 138,491 of them left after this step.
-
374,703 users added a commodity to the cart, and 198,642 of them left after this step.
-
176,061 users purchased a commodity.
-
Example 3
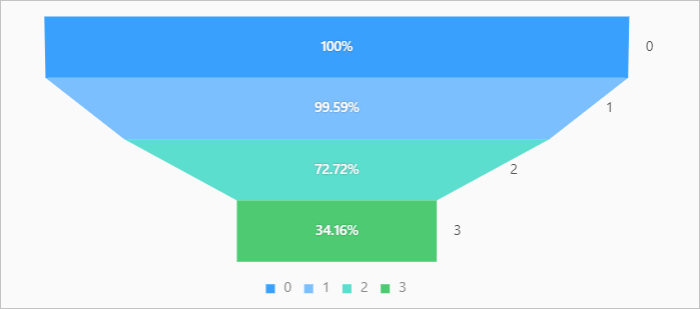
Calculate the conversion rates for the promotion.
-
Absolute conversion rate: the percentage of total users who completed a specific step.
-
Relative conversion rate: the percentage of users who completed a specific step relative to those who completed the previous step.
-
Query statement
* | SELECT *, 100.0 * total /(sum(count) over()) AS "absolute conversion rate", if( lag(total, 1, 0) over() = 0, 100, (100.0 * total / lag(total, 1, 0) over()) ) AS "relative conversion rate" FROM ( SELECT levels, count, sum(count) over( ORDER BY levels DESC ) AS total FROM ( SELECT levels, count(1) AS count FROM ( SELECT user_id, window_funnel( 86400, timestamp, ARRAY [behavior_type='pv', behavior_type='cart',behavior_type='buy'] ) AS levels FROM log GROUP BY user_id ) GROUP BY levels ) ORDER BY levels ) -
Results
-
The query returns a table with five columns: levels, count, total, absolute conversion rate, and relative conversion rate. For example, at level 2, the absolute conversion rate is approximately 72.72%. At level 3, the final step, the absolute conversion rate is approximately 34.17%, and the relative conversion rate is approximately 46.99%.
-
funnel chart
-