CloudLens for ALB provides dashboards that display metrics for an Application Load Balancer (ALB) instance from multiple perspectives, including monitoring overview, monitoring center, real-time monitoring, instance inspection, and access overview.
Prerequisites
Enable log collection for the target ALB instance. For more information, see Enable data collection.
Access
- Log on to the Log Service console.
- In the Log Application section, on the Cloud Service Lens tab, click CloudLens for ALB.
- In the left-side navigation pane, click Report Center.
- In the upper-left corner of the page, select the target ALB instance.
Monitoring overview
The Monitoring Overview dashboard summarizes key metrics for an ALB instance, including core indicators, error codes, traffic, exception events, page views (PV), request success rate, and average latency.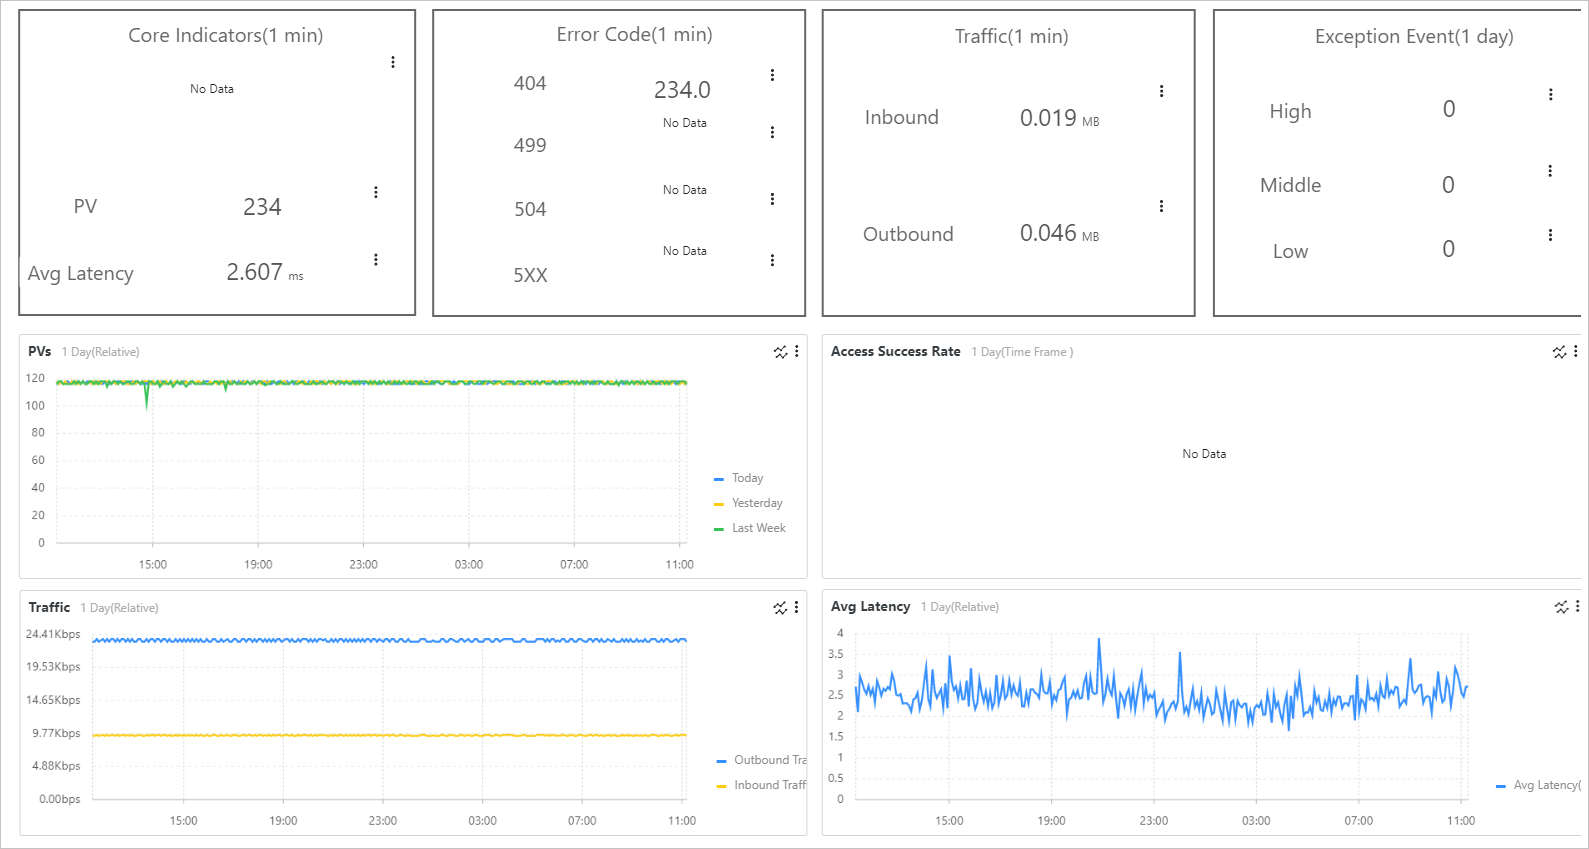
Monitoring center
The Monitoring Center dashboard displays real-time metrics for an ALB instance, including PV, request success rate, average latency, 4xx requests, status distribution, traffic, P50/P90/P99 latency, and top hosts, URLs, and backends ranked by request volume, latency, and failure rate.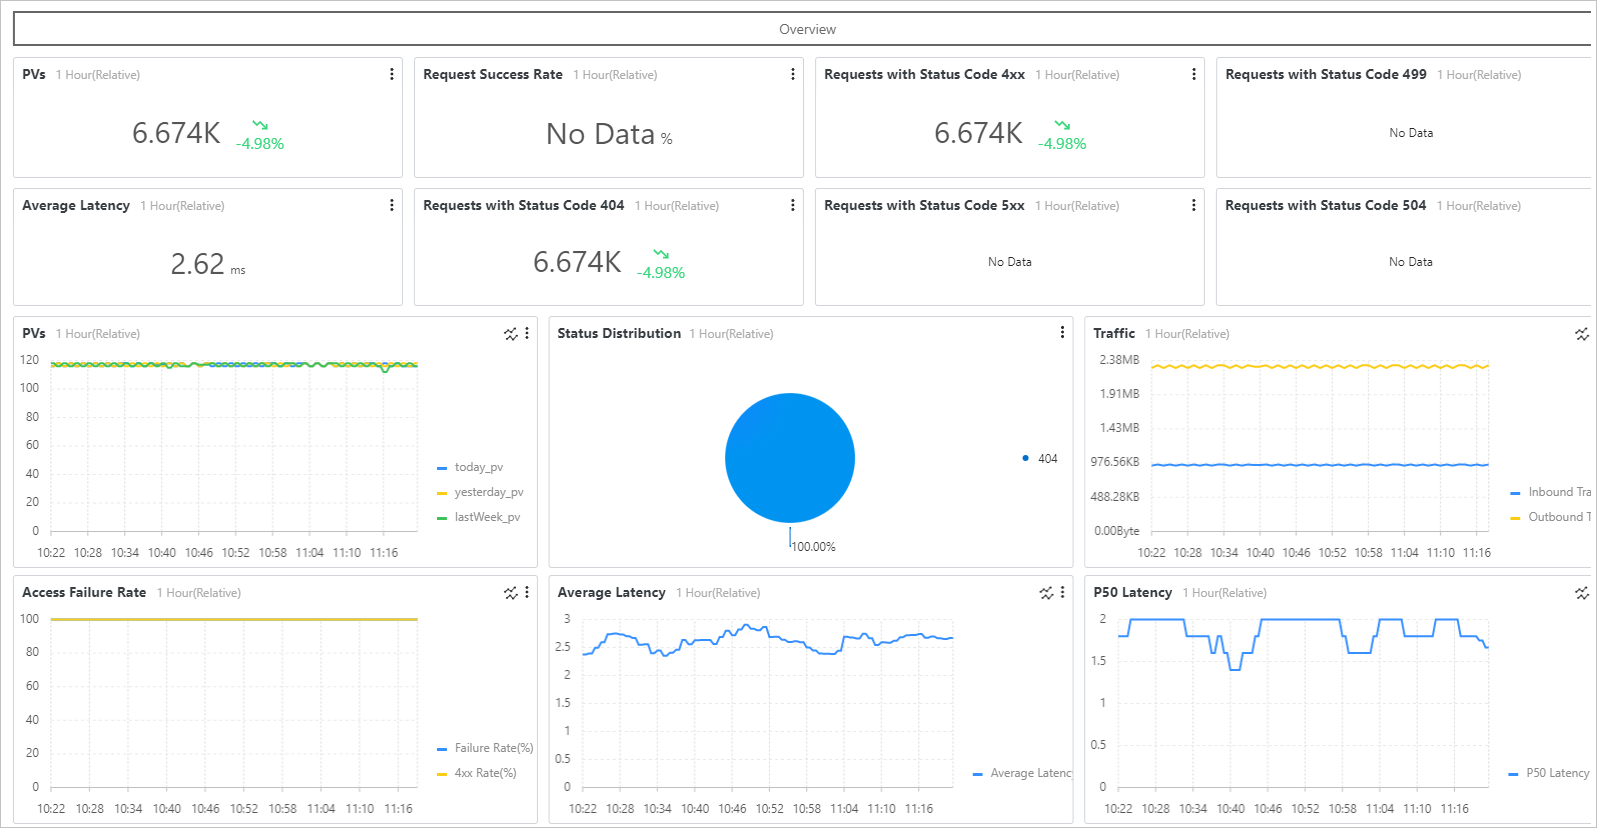
Real-time monitoring
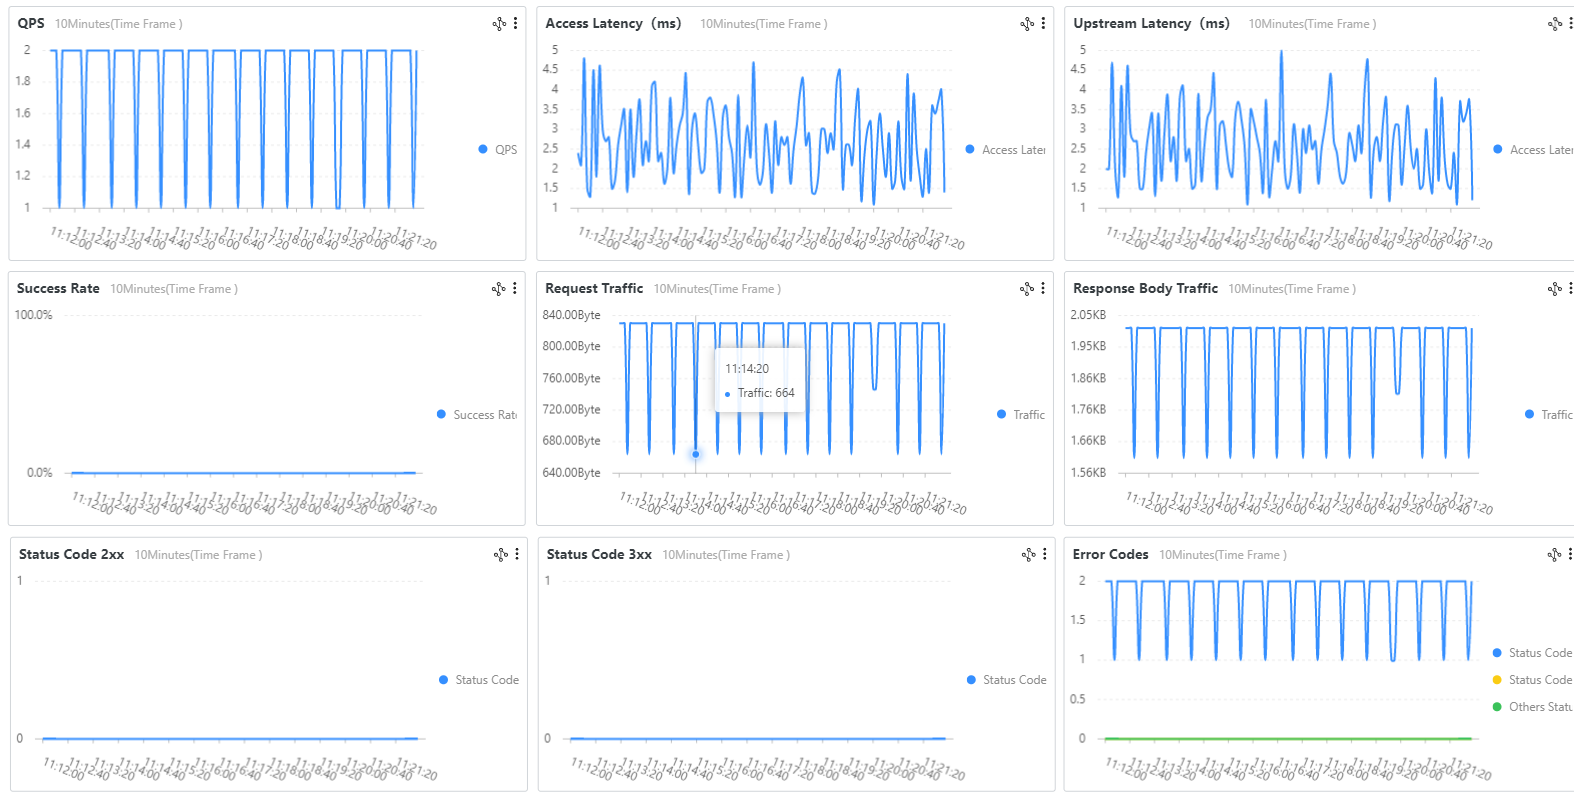
The Real-time Monitoring dashboard displays metrics for an ALB instance aggregated at one-second intervals, including QPS, access latency, upstream latency, success rate, request traffic, response body traffic, and status codes (2xx, 3xx, error) for both the ALB and upstream servers.
Instance inspection
The Instance Inspection dashboard uses machine learning algorithms provided by Simple Log Service to automatically detect anomalies for an ALB instance. Anomaly details include total count, level distribution (high, medium, low), metric distribution, anomaly list, and exception events.
The Instance Inspection dashboard provides the app_lb_id filter and a Query button at the top, supporting filtering by time range. In addition to anomaly detection metrics, the dashboard also displays the following time-series monitoring charts:
PV
Inbound traffic
Outbound traffic
Average request latency (ms)
Backend response latency (ms)
Average request length (Byte)
Average response body length (Byte)
Access overview
The Overview dashboard shows the overall access status of an ALB instance, including PV and UV comparisons (day-on-day and week-on-week), PV/UV distribution, today's PV, 7-day PV, top 10 requesting provinces, mobile client percentage, top 10 requesting hosts, top 10 user agents, and top requesting IPs. You can filter by ALB ID, host, URL, and Status at the top. The central area features a traffic topology map that visualizes the request path from user requests (PV/UV), through the ALB (inbound/outbound traffic, average request latency), to backend instances (instance count, effective PV, average response latency). The bottom displays error rate metrics such as the 404 rate and 5xx rate.